Demographics of South Africa Last updated January 15, 2026 Population 1904 Census South African population figures for the 1904 Census. [ 9]
Colony
Pop.
Cape Colony Natal Transvaal Orange River Total Percent Black 1,424,787904,041 937,127 225,101 3,491,056 White 579,741 97,109 297,277 142,690 1,116,805 Coloured 395,034 6,686 24,226 19,282 445,228 Indian 10,242 100,918 11,321 253 122,734 Total 2,409,804 1,108,754 1,269,951 387,315 5,175,823 % of S. Africa
1960 Census Sources: Statesman's Year-Book 1967–1968; [ 10] Europa Year Book 1969 [ 11]
Province
Pop. Group
Cape of Natal Transvaal Orange Total Percent Black 3,011,080 2,199,920 4,633,378 1,083,886 10,928,264 White 1,003,207 340,235 1,468,305 276,745 3,088,492 Coloured 1,330,089 45,253 108,007 25,909 1,509,258 Indian 18,477 394,854 63,787 7 477,125 Total 5,362,853 2,980,262 6,273,477 1,386,547 16,003,139 % of S. Africa
Bantustan demographics were removed from South African census data during Apartheid and for this reason official figures on the national population of the country during that period will be inaccurate. [ 12]
Population Size by Race, 1904–85 (1,000 people) Year Blacks Whites Coloureds Asians Total Popu- % Popu- % Popu- % Popu- % Popu- Area included 1904 3,490 1,117 445 122 5,174 South Africa 1911 4,019 1,276 525 152 5,972 South Africa 1921 4,697 1,521 545 163 6,926 South Africa 1936 6,596 2,003 769 220 9,588 South Africa 1946 7,830 2,372 928 285 11,415 South Africa 1951 8,560 2,642 1,103 367 12,672 South Africa 1960 10,928 3,088 1,509 477 16,002 South Africa 1970 11,891 3,759 2,039 630 18,319 South Africa - excluding Transkei , Bophuthatswana , Venda & Ciskei 1970 15,340 3,773 2,051 630 21,794 South Africa 1980 13,135 4,221 2,459 748 20,563 South Africa - excluding Transkei, Bophuthatswana & Venda 1980 16,992 4,512 2,688 803 24,995 South Africa - estimate 1985 15,163 4,569 2,833 821 23,386 South Africa - excluding Transkei, Bophuthatswana, Venda & Ciskei 1985 19,052 4,837 2,396 879 27,704 South Africa - estimate Year Blacks Whites Coloureds Asians Total Area included
1996 Census Source: The People of South Africa: Population Census, 1996 [ 13]
Black White Coloured Indian/ Other Total % of Northern Cape 278,633 111,844 435,368 2,268 12,208 840,321 Western Cape 826,691 821,551 2,146,109 40,376 122,148 3,956,875 Eastern Cape 5,448,495 330,294 468,532 19,356 35,849 6,302,525 KwaZulu-Natal 6,880,652 558,182 117,951 790,813 69,423 8,417,021 Mpumalanga 2,497,834 253,392 20,283 13,083 16,120 2,800,711 Free State 2,223,940 316,459 79,038 2,805 11,262 2,633,504 Gauteng 5,147,444 1,702,343 278,692 161,289 58,654 7,348,423 Northern Province (now Limpopo ) 4,765,255 117,878 7,821 5,510 32,904 4,929,368 North West 3,058,686 222,755 46,652 10,097 16,635 3,354,825 South Africa Total 31,127,631 4,434,697 3,600,446 1,045,596 375,204 40,583,573 Percent Population Group → Black White Coloured Asian Other Total % of RSA
2001 Census Source: Statistics South Africa: Census 2001 [ 14]
Province
Pop. Group
Eastern Cape Free State Gauteng KwaZulu-Natal Limpopo Mpumalanga Northern Cape North West Western Cape Total Percent Black 5,635,079 2,381,073 6,522,792 8,002,407 5,128,616 2,886,345 293,976 3,358,450 1,207,429 35,416,166 White 304,506 238,791 1,758,398 483,448 126,276 203,244 102,042 244,035 832,901 4,293,640 Coloured 478,807 83,193 337,974 141,887 10,163 22,158 424,389 56,959 2,438,976 3,994,505 Indian 18,372 3,719 218,015 798,275 8,587 11,244 2,320 9,906 45,030 1,115,467 Total 6,436,763 2,706,775 8,837,178 9,426,017 5,273,642 3,122,990 822,727 3,669,349 4,524,335 44,819,778 % of S.A.
2011 Census Source: Census 2011: Census in Brief [ 15]
Province
Pop. Group
Eastern Cape Free State Gauteng KwaZulu-Natal Limpopo Mpumalanga Northern Cape North West Western Cape Total Percent Black 5,660,230 2,405,533 9,493,684 8,912,921 5,224,754 3,662,219 576,986 3,152,063 1,912,547 41,000,938 Coloured 541,850 83,844 423,594 141,376 14,415 36,611 461,899 71,409 2,840,404 4,615,401 White 310,450 239,026 1,913,884 428,842 139,359 303,595 81,246 255,385 915,053 4,586,838 Indian /Asian 27,929 10,398 356,574 756,991 17,881 27,917 7,827 20,652 60,761 1,286,930 Other 21,595 6,790 84,527 27,170 8,459 9,597 17,903 10,444 93,969 280,454 Total 6,562,053 2,745,590 12,272,263 10,267,300 5,404,868 4,039,939 1,145,861 3,509,953 5,822,734 51,770,560 % of S.A.
2022 Census Source: Census 2022 Statistical Release [ 2]
Province
Pop. Group
Eastern Cape Free State Gauteng KwaZulu-Natal Limpopo Mpumalanga Northern Cape North West Western Cape Total Percent Black 6,189,075 2,630,556 12,763,312 10,535,830 6,341,601 4,898,063 679,383 3,562,524 2,884,511 50,486,856 Coloured 547,741 78,141 443,857 183,019 18,409 32,100 563,605 60,720 3,124,757 5,052,349 White 403,061 235,915 1,509,800 513,377 167,524 185,731 99,150 171,887 1,217,807 4,504,252 Indian 37,568 12,978 329,736 1,157,542 35,958 25,882 10,824 2,654 84,363 1,697,506 Other 48,339 4,274 35,890 27,442 7,172 440 2,667 5,894 115,235 247,353 Total 7,225,784 2,961,864 15,084,595 12,417,210 6,570,664 5,142,216 1,355,629 3,803,679 7,426,673 61,988,314 % of S.A.
Note: The 2022 South African census has been criticised for its inaccuracies, such as the overestimation of the Indian and White population. [ 16]
Total Historical Population Year 0 10,000,000 20,000,000 30,000,000 40,000,000 50,000,000 60,000,000 1820 1913 1950 1980 2007 Total Historical Population South Africa Total Historical Population
Total Population Year 45 48 51 54 57 60 63 2000 2005 2010 2015 2020 2025 Total Population South Africa Total Population
Population estimates for South Africa 2002-2020
Historical population Year 1 100,000 — 1000 300,000 +0.11% 1500 600,000 +0.14% 1600 700,000 +0.15% 1700 1,000,000 +0.36% 1820 1,550,000 +0.37% 1870 2,547,000 +1.00% 1904 5,175,463 +2.11% 1911 5,972,757 +2.07% 1913 6,153,000 +1.50% 1921 6,927,403 +1.49% 1936 9,587,863 +2.19% 1946 11,415,925 +1.76% 1950 13,683,162 +4.63% 1955 15,384,557 +2.37% 1960 17,396,367 +2.49% 1970 22,502,502 +2.61% 1980 29,077,143 +2.60% 1990 36,793,490 +2.38% 1995 41,426,810 +2.40% 2001 44,819,777 +1.32% 2007 48,502,063 +1.32% 2011 51,770,560 +1.64% 2016 55,653,654 +1.46% 2022 62,027,503 +1.82% Note: Population estimates (1 AD - 1870 AD) are deduced from quantitative macroeconomic historical calculations. 1 (est.), 1000 (est.), 1500 (est.), 1600 (est.), 1700 (est.), 1820 (est.), 1870 (est.), 1913, [ 17] 1904 [ 9] 1904-1946, [ 18] [ 19] [ 20] 1950-2010, [ 21] 2001 , 2011 , 2015 [ 22]
Historical and projected population for the years 1 to 2022 UN age and population estimates: 1950 to 2030 According to the 2019 revision of the United Nations World Population Prospects , South Africa's total population was 55,386,000 in 2015, compared to only 13,628,000 in 1950. In 2015, 29.3% of the people were children under the age of 15, 65.7% were between 15 and 64 years of age, and 5.0% were 65 or older. [ 23] All population estimates are rounded to the nearest thousand.
Year Total population Percentage in age bracket under 15 years old 15 to 64 years old at least 65 years old 1950 13,628,000 1955 15,207,000 1960 17,100,000 1965 19,385,000 1970 22,070,000 1975 25,195,000 1980 28,557,000 1985 32,679,000 1990 36,801,000 1995 41,436,000 2000 44,968,000 2005 47,881,000 2010 51,217,000 2015 55,386,000 2020 59,309,000 2025 62,803,000 2030 65,956,000
UN population projections: 2019 to 2100
U.N. Population projections Year 2019 58,558,000 — 2030 65,956,000 +1.09% 2050 75,518,000 +0.68% 2100 79,191,000 +0.10% Note that the average percentage changes are per year (per annum ), and not the total change over the period between estimatesUnited Nations Secretariat [ 24]
Vital statistics Vital statistics The following statistics are obtained from the mid-year population estimates published by Statistics South Africa : [ 1]
Total fertility rates by province United Nations Population Estimates The Population Department of the United Nations prepared the following estimates. [ 23] (Natural increase or decrease over a time period is the difference between that period's live births and deaths, before accounting for inward or outward migration.)
Period Live births per year Deaths per year Natural Increase per year Crude Birth Rate Crude Death Rate Natural Increase Total Fertility Rate (over av'ge woman's life) Infant Mortality Rate (per 100,000 live births) 1950–1955 606,600 292,400 + 314,200 42.1 20.7 + 21.8 6.05 134 1955–1960 669,400 293,800 + 375,600 41.4 18.2 + 23.3 6.05 121 1960–1965 740,200 304,600 + 435,600 40.6 16.7 + 23.9 6.00 112 1965–1970 810,600 313,600 + 497,000 39.1 15.2 + 24.0 5.80 103 1970–1975 896,000 315,400 + 580,600 37.9 13.3 + 24.6 5.50 89 1975–1980 967,400 309,800 + 657,600 36.0 11.5 + 24.5 5.05 71 1980–1985 1,099,200 311,000 + 788,200 35.9 10.2 + 25.7 4.90 56 1985–1990 1,147,400 299,400 + 848,000 33.0 8.6 + 24.4 4.40 46 1990–1995 1,074,600 318,000 + 756,600 27.5 8.1 + 19.3 3.51 41 1995–2000 1,026,600 448,000 + 578,600 23.8 10.4 + 13.4 2.88 47 2000–2005 1,051,600 626,800 + 424,800 22.7 13.5 + 9.2 2.61 54 2005–2010 1,166,200 671,400 + 494,800 23.5 13.6 + 10.0 2.62 48 2010–2015 1,207,200 557,200 + 650,000 22.6 10.5 + 12.2 2.55 33 2015–2020 1,185,000 546,000 + 639,000 20.7 9.5 + 11.1 2.41 27 2020–2025 1,159,600 573,200 + 586,400 19.0 9.4 + 9.6 2.31 24 2025–2030 1,143,400 604,400 + 539,000 17.8 9.4 + 8.4 2.22 21 Total Fertility Rate = average number of children over a woman's lifetime; Infant Mortality Rate per 100,000 live births
Age and sex distribution Population pyramid, 2011 Age group Male Female percent Female Total Percent of RSA 0–14 7,969,880 49.6% 7,842,388 15,812,268 31.3% 15–64 15,538,934 51.8% 16,696,600 32,235,534 63.7% 65+ 1,006,222 51.8% 1,532,733 2,538,955 5.0% All ages 24,515,036 51.5% 26,071,721 50,586,757 100%
Age group Male Female percent Female Total Percent of RSA under 5 2,867,585 49.6% 2,817,867 5,685,452 11.0% 5–9 2,425,181 49.7% 2,394,570 4,819,751 9.3% 10–14 2,344,275 49.0% 2,250,611 4,594,886 8.9% 15–19 2,498,572 50.1% 2,504,905 5,003,477 9.7% 20–24 2,694,646 49.9% 2,679,896 5,374,542 10.4% 25–29 2,542,682 49.7% 2,516,635 5,059,317 9.8% 30–34 2,036,206 49.5% 1,992,804 4,029,010 7.8% 35–39 1,709,347 50.7% 1,758,420 3,467,767 6.7% 40–44 1,402,328 52.4% 1,546,291 2,948,619 5.7% 45–49 1,195,740 54.4% 1,424,543 2,620,283 5.1% 50–54 1,011,349 54.4% 1,206,940 2,218,289 4.3% 55–59 811,950 54.8% 985,458 1,797,408 3.5% 60–64 612,364 55.8% 773,404 1,385,768 2.7% 65–69 401,548 58.1% 556,256 957,804 1.9% 70–74 293,498 60.8% 454,832 748,330 1.4% 75–79 165,283 65.7% 315,984 481,267 0.9% 80–84 100,694 68.8% 222,222 322,916 0.6% 85-plus 75,543 70.5% 180,130 255,673 0.5% TOTAL 25,188,791 51.3% 26,581,769 51,770,560 100%
Number of children 0–14 Number of women 15–49 Proportion Fertility Rate 15,812,264 13,866,489 1.14 2.35
Population by Sex and Age Group (Census 2022): [ 25]
Age group Male Female percent Female Total Percent of RSA 0–14 8 193 703 49.88% 8 153 039 16 346 742 26.35% 15–64 20 340 801 51.19% 21 332 902 41 673 703 67.19% 65+ 1 544 253 61.46% 2 462 805 4 007 058 6.46% All ages 30 078 757 51.51% 31 948 746 62 027 503 100%
Age group Male Female percent Female Total Percent of RSA under 5 2 918 292 50.0% 2 915 222 5 833 515 9.40% 5–9 2 561 963 49.9% 2 547 141 5 109 104 8.24% 10–14 2 713 448 49.8% 2 690 676 5 404 124 8.71% 15–19 2 504 677 49.7% 2 470 633 4 975 309 8.02% 20–24 2 670 986 49.7% 2 638 753 5 309 738 8.56% 25–29 2 825 292 50.7% 2 907 947 5 733 239 9.24% 30–34 2 776 212 50.4% 2 816 611 5 592 823 9.02% 35–39 2 596 891 50.3% 2 625 711 5 222 603 8.42% 40–44 2 089 077 50.1% 2 096 144 4 185 220 6.75% 45–49 1 586 698 51.8% 1 706 813 3 293 511 5.31% 50–54 1 277 910 53.9% 1 491 229 2 769 139 4.46% 55–59 1 100 778 55.9% 1 395 674 2 496 452 4.02% 60–64 912 280 56.5% 1 183 387 2 095 667 3.38% 65–69 672 433 58.0% 927 238 1 599 671 2.58% 70–74 419 393 59.9% 626 614 1 046 006 1.69% 75–79 238 713 63.4% 413 321 652 033 1.05% 80–84 132 074 66.5% 262 740 394 814 0.64% 85-plus 81 640 74.0% 232 892 314 532 0.51% TOTAL 30 078 757 51.5% 31 948 746 62 027 503 100%
Age and race distribution Mid-year population estimates for South Africa by population group and sex, 2020 Population Group Male Female Total Number % Distribution of Males Number % Distribution of Females Number % Distribution of Total Black African 23,519,474 80.7 24,634,253 80.8 48,153,727 80.8 Coloured 2,555,204 8.8 2,692,536 8.8 5,247,740 8.8 Indian/Asian 787,662 2.7 753,451 2.5 1,541,113 2.6 White 2,266,535 7.8 2,413,235 7.9 4,679,770 7.8 Total 29,128,875 100.0 30,493,475 100.0 59,622,350 100.0
Age distribution within each racial group By generation Age group All races Black African Coloured White Indian or other Asian Others # % # % # % # % # % # % 0–14 15,100,089 12,702,324 1,311,811 771,187 258,602 56,164 15–64 33,904,479 26,502,329 3,085,684 3,165,965 939,379 211,126 65-plus 2,765,992 1,796,285 217,906 649,686 88,949 13,164 All ages 51,770,560 41,000,938 4,615,401 4,586,838 1,286,930 280,454 % of SA
Age group All races Black African Coloured White Indian or other Asian # % # % # % # % # % 0–14 16,612,043 14,244,663 1,288,601 789,492 289,285 15–64 35,465,499 28,170,797 3,299,771 3,026,475 968,649 65-plus 2,879,378 1,812,535 244,544 718,041 104.068 All ages 54,956,920 100% 44,227,995 4,832,916 4,534,008 1,362,002 % of SA
By five-year cohorts Age group All races Black African Coloured White Indian or other Asian # % # % # % # % # % under 5 5,936,350 10.80% 5,156,508 11.66% 426,156 8.82% 254,978 5.62% 98,708 7.25% 5 to 9 5,537,225 10.08% 4,746,115 10.73% 430,666 8.91% 263,378 5.81% 97,065 7.13% 10 to 14 5,138,468 9.35% 4,342,040 9.82% 431,779 8.93% 271,136 5.98% 93,512 6.87% 15 to 19 5,124,373 9.32% 4,292,220 9.70% 437,412 9.05% 295,733 6.52% 99,007 7.27% 20 to 24 5,302,246 9.65% 4,461,515 10.09% 426,013 8.81% 306,415 6.76% 108,304 7.95% 25 to 29 5,232,254 9.52% 4,437,570 10.03% 389,429 8.06% 287,485 6.34% 117,771 8.65% 30 to 34 4,307,693 7.84% 3,535,173 7.99% 366,955 7.59% 281,358 6.21% 124,206 9.12% 35 to 39 3,774,921 6.87% 3,001,989 6.79% 376,488 7.79% 279,439 6.16% 117,005 8.59% 40 to 44 3,204,952 5.83% 2,444,972 5.53% 368,886 7.63% 288,370 6.36% 102,725 7.54% 45 to 49 2,738,580 4.98% 2,004,009 4.53% 307,363 6.36% 335,434 7.40% 91,774 6.74% 50 to 54 2,297,586 4.18% 1,619,249 3.66% 264,593 5.47% 332,977 7.34% 80,767 5.93% 55 to 59 1,942,942 3.54% 1,334,800 3.02% 209,933 4.34% 328,999 7.26% 69,210 5.08% 60 to 64 1,539,953 2.80% 1,039,301 2.35% 152,698 3.16% 290,075 6.40% 57,879 4.25% 65 to 69 1,153,159 2.10% 737,581 1.67% 105,403 2.18% 265,818 5.86% 44,357 3.26% 70 to 74 805,114 1.46% 511,723 1.16% 65,465 1.35% 198,876 4.39% 28,949 2.13% 75 to 79 502,005 0.91% 313,800 0.71% 41,978 0.87% 128,675 2.84% 17,552 1.29% 80-plus 419,100 0.76% 249,431 0.56% 31,698 0.66% 124,672 2.75% 13,210 0.97% All ages 54,956,920 100% 44,227,995 (100%) 4,832,916 (100%) 4,534,008 (100%) 1,362,002 (100%) % of SA 100% 80.48% 8.79% 8.25% 2.48%
Age group All races Black African Coloured White Indian or other Asian # % # % # % # % under 5 5,936,350 5,156,508 86.86% 426,156 7.18% 254,978 4.30% 98,708 1.66% 5 to 9 5,537,225 4,746,115 85.71% 430,666 7.78% 263,378 4.76% 97,065 1.75% 10 to 14 5,138,468 4,342,040 84.50% 431,779 8.40% 271,136 5.28% 93,512 1.82% 15 to 19 5,124,373 4,292,220 83.76% 437,412 8.54% 295,733 5.77% 99,007 1.93% 20 to 24 5,302,246 4,461,515 84.14% 426,013 8.03% 306,415 5.78% 108,304 2.04% 25 to 29 5,232,254 4,437,570 84.81% 389,429 7.44% 287,485 5.49% 117,771 2.25% 30 to 34 4,307,693 3,535,173 82.07% 366,955 8.52% 281,358 6.53% 124,206 2.88% 35 to 39 3,774,921 3,001,989 79.52% 376,488 9.97% 279,439 7.40% 117,005 3.10% 40 to 44 3,204,952 2,444,972 76.29% 368,886 11.51% 288,370 9.00% 102,725 3.21% 45 to 49 2,738,580 2,004,009 73.18% 307,363 11.22% 335,434 12.25% 91,774 3.35% 50 to 54 2,297,586 1,619,249 70.48% 264,593 11.52% 332,977 14.49% 80,767 3.52% 55 to 59 1,942,942 1,334,800 68.70% 209,933 10.80% 328,999 16.93% 69,210 3.56% 60 to 64 1,539,953 1,039,301 67.49% 152,698 9.92% 290,075 18.84% 57,879 3.76% 65 to 69 1,153,159 737,581 63.96% 105,403 9.14% 265,818 23.05% 44,357 3.85% 70 to 74 805,114 511,723 63.56% 65,465 8.13% 198,876 24.70% 28,949 3.60% 75 to 79 502,005 313,800 62.51% 41,978 8.36% 128,675 25.63% 17,552 3.50% 80-plus 419,100 249,431 59.52% 31,698 7.56% 124,672 29.75% 13,210 3.15% All ages 54,956,920 44,227,995 4,832,916 4,534,008 1,362,002 % of SA 80.48% 8.79% 8.25% 2.48%
Source: [ 26]
Age group All races Black African Coloured White Indian or other Asian # % # % # % # % # % 0–14 17,050,955 28.60% 14,605,416 30.33% 1,408,553 26.84% 742,913 15.87% 294,073 19.08% 15–64 38,941,221 65.31% 31,368,174 65.14% 3,487,284 66.45% 2,988,634 63.86% 1,097,129 71.19% 65-plus 3,630,174 6.09% 2,180,137 4.53% 351,903 6.71% 948,223 20.26% 149,911 9.73% All ages 59,622,350 100% 48,153,727 (100%) 5,247,740 (100%) 4,679,770 (100%) 1,541,113 (100%) % of SA 100% 80.76% 8.80% 7.85% 2.58%
Age group All races Black African Coloured White Indian or other Asian # % # % # % # % # % under 5 5,743,450 9.63% 4,940,751 10.26% 476,322 9.08% 226,715 4.84% 99,662 6.47% 5 to 9 5,715,952 9.59% 4,890,895 10.16% 475,518 9.06% 249,991 5.34% 99,548 6.46% 10 to 14 5,591,553 9.38% 4,773,770 9.91% 456,713 8.70% 266,207 5.69% 94,863 6.16% 15 to 19 4,774,579 8.01% 4,031,704 8.37% 411,056 7.83% 243,267 5.20% 88,552 5.75% 20 to 24 4,823,367 8.09% 4,043,432 8.40% 423,180 8.06% 254,465 5.44% 102,290 6.64% 25 to 29 5,420,754 9.09% 4,586,780 9.53% 435,746 8.30% 267,654 5.72% 130,574 8.47% 30 to 34 5,641,750 9.46% 4,769,499 9.90% 431,274 8.22% 296,160 6.33% 144,817 9.40% 35 to 39 4,798,293 8.05% 3,962,780 8.23% 381,858 7.28% 308,959 6.60% 144,696 9.39% 40 to 44 3,733,942 6.26% 2,988,999 6.21% 316,611 6.03% 306,414 6.55% 121,918 7.91% 45 to 49 3,169,648 5.32% 2,393,317 4.97% 312,665 5.96% 352,648 7.54% 111,018 7.20% 50 to 54 2,571,263 4.31% 1,834,191 3.81% 302,224 5.76% 337,839 7.22% 97,009 6.29% 55 to 59 2,211,309 3.71% 1,546,674 3.21% 264,967 5.05% 314,423 6.72% 85,245 5.53% 60 to 64 1,796,316 3.01% 1,210,798 2.51% 207,703 3.96% 306,805 6.56% 71,010 4.61% 65 to 69 1,408,665 2.36% 918,604 1.91% 150,941 2.88% 281,318 6.01% 57,802 3.75% 70 to 74 1,007,174 1.69% 619,106 1.29% 97,127 1.85% 248,673 5.31% 42,268 2.74% 75 to 79 637,062 1.07% 365,409 0.76% 56,822 1.08% 188,123 4.02% 26,708 1.73% 80-plus 577,273 0.97% 277,018 0.58% 47,013 0.90% 230,109 4.92% 23,133 1.50% All ages 59,622,350 100% 48,153,727 (100%) 5,247,740 (100%) 4,679,770 (100%) 1,541,113 (100%) % of SA 100% 80.76% 8.80% 7.85% 2.58%
Age group All races Black African Coloured White Indian or other Asian # % # % # % # % under 5 5,743,450 4,940,751 86.02% 476,322 8.29% 226,715 3.95% 99,662 1.74% 5 to 9 5,715,952 4,890,895 85.57% 475,518 8.32% 249,991 4.37% 99,548 1.74% 10 to 14 5,591,553 4,773,770 85.37% 456,713 8.17% 266,207 4.76% 94,863 1.70% 15 to 19 4,774,579 4,031,704 84.44% 411,056 8.61% 243,267 5.10% 88,552 1.85% 20 to 24 4,823,367 4,043,432 83.83% 423,180 8.77% 254,465 5.28% 102,290 2.12% 25 to 29 5,420,754 4,586,780 84.62% 435,746 8.04% 267,654 4.94% 130,574 2.41% 30 to 34 5,641,750 4,769,499 84.54% 431,274 7.64% 296,160 5.25% 144,817 2.57% 35 to 39 4,798,293 3,962,780 82.59% 381,858 7.96% 308,959 6.44% 144,696 3.02% 40 to 44 3,733,942 2,988,999 80.05% 316,611 8.48% 306,414 8.21% 121,918 3.27% 45 to 49 3,169,648 2,393,317 75.51% 312,665 9.86% 352,648 11.13% 111,018 3.50% 50 to 54 2,571,263 1,834,191 71.33% 302,224 11.75% 337,839 13.14% 97,009 3.77% 55 to 59 2,211,309 1,546,674 69.94% 264,967 11.98% 314,423 14.22% 85,245 3.85% 60 to 64 1,796,316 1,210,798 67.40% 207,703 11.56% 306,805 17.08% 71,010 3.95% 65 to 69 1,408,665 918,604 65.21% 150,941 10.72% 281,318 19.97% 57,802 4.10% 70 to 74 1,007,174 619,106 61.47% 97,127 9.64% 248,673 24.69% 42,268 4.20% 75 to 79 637,062 365,409 57.36% 56,822 8.92% 188,123 29.53% 26,708 4.19% 80-plus 577,273 277,018 47.99% 47,013 8.14% 230,109 39.86% 23,133 4.01% All ages 59,622,350 48,153,727 5,247,740 4,679,770 1,541,113 % of SA 80.76% 8.80% 7.85% 2.58%
Age group All races Black African Coloured White Indian or other Asian Other # % # % # % # % # % # % 0–14 16 343 887 26.37% 14 179 166 28.09% 1 251 356 24.77% 605 846 13.45% 263 172 15.50% 44 347 17.93% 15–64 41 640 194 67.18% 33 811 393 66.97% 3 466 232 68.61% 2 930 422 65.06% 1 245 195 73.36% 186 951 75.59% 65-plus 4 002 635 6.46% 2 495 338 4.94% 334 362 6.62% 967 789 21.49% 189 109 11.14% 16 039 6.48% All ages 61 986 716 100% 50 485 897 (100%) 5 051 950 (100%) 4 504 057 (100%) 1 697 476 (100%) 247 337 (100%) % of SA 100% 81.45% 8.15% 7.27% 2.74% 0.40%
Age group All races Black African Coloured White Indian or other Asian Other # % # % # % # % # % # % under 5 5 832 551 9.41 5 163 220 408 017 173 959 66 245 21 109 5 to 9 5 108 818 8.24 4 400 143 405 393 200 133 90 752 12 397 10 to 14 5 402 518 8.72 4 615 803 437 946 231 754 106 175 10 841 15 to 19 4 972 291 8.02 4 224 216 409 099 221 193 106 590 11 193 20 to 24 5 306 570 8.56 4 530 900 424 296 224 226 102 951 24 197 25 to 29 5 730 402 9.24 4 929 929 415 104 233 841 120 895 30 634 30 to 34 5 589 980 9.02 4 706 513 407 174 284 583 159 742 31 968 35 to 39 5 218 984 8.42 4 301 682 392 920 327 935 167 862 28 585 40 to 44 4 181 563 6.75 3 341 428 338 818 323 912 156 297 21 108 45 to 49 3 289 977 5.31 2 528 073 300 655 324 251 124 984 12 014 50 to 54 2 765 237 4.46 2 010 114 294 019 337 223 113 819 10 062 55 to 59 2 492 572 4.02 1 801 060 266 462 315 649 100 673 8 728 60 to 64 2 092 615 3.38 1 437 479 217 684 337 609 91 382 8 461 65 to 69 1 599 063 2.58 1 053 093 151 281 312 336 75 923 6 430 70 to 74 1 045 846 1.69 630 541 91 499 263 594 55 641 4 572 75 to 79 651 848 1.05 368 876 49 478 197 625 33 112 2 757 80 to 84 394 617 0.64 233 963 25 726 117 776 15 864 1 289 85-plus 311 261 0.50 208 865 16 378 76 458 8 569 991 All ages 61 986 716 100% 50 485 897 (100%) 5 051 950 (100%) 4 504 057 (100%) 1 697 476 (100%) 247 337 (100%) % of SA 100% 81.45% 8.15% 7.27% 2.74% 0.40%
Age group All races Black African Coloured White Indian or other Asian Other # % # % # % # % # % under 5 5 832 551 5 163 220 408 017 173 959 66 245 21 109 5 to 9 5 108 818 4 400 143 405 393 200 133 90 752 12 397 10 to 14 5 402 518 4 615 803 437 946 231 754 106 175 10 841 15 to 19 4 972 291 4 224 216 409 099 221 193 106 590 11 193 20 to 24 5 306 570 4 530 900 424 296 224 226 102 951 24 197 25 to 29 5 730 402 4 929 929 415 104 233 841 120 895 30 634 30 to 34 5 589 980 4 706 513 407 174 284 583 159 742 31 968 35 to 39 5 218 984 4 301 682 392 920 327 935 167 862 28 585 40 to 44 4 181 563 3 341 428 338 818 323 912 156 297 21 108 45 to 49 3 289 977 2 528 073 300 655 324 251 124 984 12 014 50 to 54 2 765 237 2 010 114 294 019 337 223 113 819 10 062 55 to 59 2 492 572 1 801 060 266 462 315 649 100 673 8 728 60 to 64 2 092 615 1 437 479 217 684 337 609 91 382 8 461 65 to 69 1 599 063 1 053 093 151 281 312 336 75 923 6 430 70 to 74 1 045 846 630 541 91 499 263 594 55 641 4 572 75 to 79 651 848 368 876 49 478 197 625 33 112 2 757 80 to 84 394 617 233 963 25 726 117 776 15 864 1 289 85-plus 311 261 208 865 16 378 76 458 8 569 991 All ages 61 986 716 50 485 897 (100%) 5 051 950 (100%) 4 504 057 (100%) 1 697 476 (100%) 247 337 (100%) % of SA 100% 81.45% 8.15% 7.27% 2.74% 0.40%
Demographic and Health Surveys Fertility rate (TFR) (Wanted Fertility Rate) and CBR (Crude Birth Rate ): [ 27]
Year Total Urban Rural CBR TFR CBR TFR CBR TFR 1998 21.90 2.90 (2.3) 19.2 2.25 (1.8) 25.4 3.92 (2.9) 2016 22.3 2.6 (2.0) 21.9 2.4 (1.9) 23.1 3.1 (2.4)
Fertility rate (TFR) (Wanted Fertility Rate) by ethnic group.
Year Total Black African White Coloured Indian/Asian 1998 2.9 (2.3) 3.1 (2.4) 1.9 (1.5) 2.5 (2.1) 2016 2.6 (2.0) 2.7 (2.1) 1.5 (1.2) 2.5 (1.9) 1.7 (1.6)
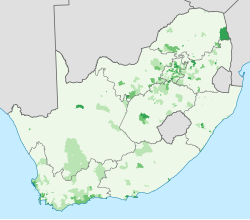
Ethnic groups Dominant population groups in South Africa.
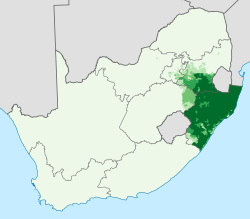
African
Coloured
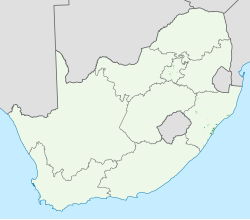
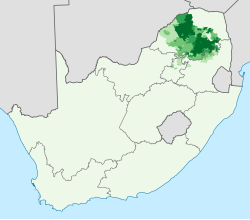
Indian or other Asian
White
None dominant
Little or no population
Statistics South Africa asks people to describe themselves in the census in terms of five racial population groups. [ 30] The 2011 census figures for these groups were African at 80.2%, White at 8.4%, Coloured at 8.8%, Indian /Asian at 2.5%, and Other/Unspecified at 0.5%. [ 31]
The white percentage of the population has sharply declined. The first census in South Africa in 1911 showed that whites made up 22% of the population. This declined to 16% in 1980, [ 32] 8.9% in 2011 and 7.65% in 2022. [ 33] : 21
Maps of ethnoracial groups of South Africa Blacks : 50,486,856 (81.45%)
Coloureds : 5,052,349 (8.15%)
Whites : 4,504,252 (7.30%)
Indians : 1,697,506 (2.74%)
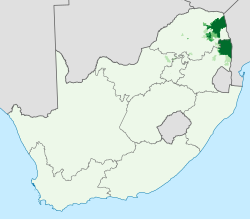
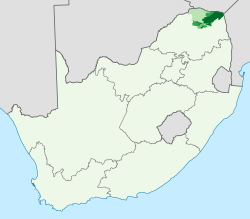
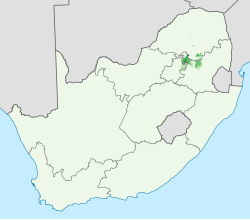
Languages South Africa has twelve official languages : [ 2] isiZulu [ 31] 24.4%, isiXhosa [ 31] 16.3%, Afrikaans [ 31] 10.6%, English [ 31] 8.7%, Sepedi [ 31] 10.0%, Setswana [ 31] 8.3%, Sesotho [ 31] 7.8%, Xitsonga [ 31] 4.7%, siSwati [ 31] 2.8%, Tshivenda [ 31] 2.5%, isiNdebele [ 31] 1.7% and South African Sign Language . [ 34]
In this regard, it is third only to Bolivia and India in number. While all the languages are formally equal, some languages are spoken more than others. According to the 2022 census , the three most spoken languages in the household are Zulu (24.4%), Xhosa (16.3%), and Afrikaans (10.6%). [ 3]
Between 1996 and 2022, the proportion of Afrikaans speakers declined from 14.5% to 10.6% and English held steady at 8.7%, whle isiZulu grew from 22.8% to 24.4%, and Xhosa declined from 17.9% to 16.3% [ 2]
The country also recognises several unofficial languages, including Sekholokoe , Fanagalo , Khwe , Lobedu , Nama , Northern Ndebele , Phuthi and San . [ 35] These unofficial languages may be used in certain official uses in limited areas where it has been determined that these languages are prevalent. Nevertheless, their populations are not such that they require nationwide recognition.
Many of the "unofficial languages" of the San and Khoikhoi people contain regional dialects stretching northwards into Namibia and Botswana , and elsewhere. These people, who are a physically distinct population from other Africans, have their own cultural identity based on their hunter-gatherer societies. They have been marginalised to a great extent, and many of their languages are in danger of becoming extinct .
Many white South Africans also speak other European languages , such as Portuguese (also spoken by black Angolans and Mozambicans ), German , Serbian and Greek , while some Indians and other Asians in South Africa speak South Asian languages , such as Bhojpuri , Tamil , Hindi , Gujarati , Urdu and Telugu . Although many South Africans are of Huguenot (French) origin, South African French is spoken by fewer than 10,000 individuals country-wide. Congolese French is also spoken in South Africa by migrants.
The primary sign language of deaf South Africans is South African Sign Language . Other sign languages among indigenous peoples are also used.
Language maps in South Africa By ethnicity In 2011, the first language was Zulu for 28.1% of Black South African residents, Xhosa for 19.8%, Sepedi for 11.2%, Tswana for 9.7%, Sesotho for 9.3%, Tsonga for 5.5%, siSwati for 3.1%, Venda for 2.9%, English for 2.8%, Southern Ndebele for 2.6%, Afrikaans for 1.5%, while 3.4% had another first language. [ 36]
Among whites, Afrikaans was the first language for 59.1% of the population, compared to 35.0% for English. Other languages accounted for the remaining 5.9%. [ 36]
Religion This section needs to be updated . Please help update this article to reflect recent events or newly available information. (September 2020 )
According to the 2022 national census, Christians accounted for 85.3% of the population. [ 3] This includes[ when? ] Protestant (36.6%), Zionist Christian (11.1%), Pentecostal /Charismatic (8.2%), Roman Catholic (7.1%), Methodist (6.8%), Dutch Reformed (6.7%), Anglican (3.8%); members of other Christian churches accounted for another 36% of the population. Muslims accounted for 1.5% of the population, Other 2.3%, and 1.4% were Unspecified and None 15.1%.[ citation needed ]
Muslims are largely found among the Coloured and Indian ethnic groups. They have been joined by black or white South African converts as well as immigrants from other parts of Africa. [ 37]
The Hindu population has its roots in the British colonial period , but later waves of immigration from India have also contributed to it. Most Hindus are of South Asian origin, but there are many who come from mixed racial stock. Some are converts due to the efforts of ISKCON .
Other minority religions in South Africa are Sikhism , Jainism , Baháʼí Faith and Judaism . [ 38]
By ethnicity 86.0% of black residents are Christian, 3.0% have no religion , 0.3% are Muslim, 0.0% are Jewish , 0.0% are Hindu , 9.5% Traditional African and 1.2% have other or undetermined beliefs (2022 Census).
90.1% of white residents are Christian, 4.9% have no religion, 0.3% are Muslim, 0.7% are Jewish, and 0.1% are Hindu. 3.9% have other or undetermined beliefs (2022 Census).
Other demographic statistics Demographics development according to the United Nations The following demographics are from the CIA World Factbook [ 39] unless otherwise indicated.
Population 57,516,665 (2022 est.) 55,380,210 (July 2018 est.) Age structure Population pyramid of South Africa in 2020 0-14 years: 27.94% (male 7,894,742/female 7,883,266)15-24 years: 16.8% (male 4,680,587/female 4,804,337)25-54 years: 42.37% (male 12,099,441/female 11,825,193)55-64 years: 6.8% (male 1,782,902/female 2,056,988)65 years and over: 6.09% (2020 est.) (male 1,443,956/female 1,992,205)0-14 years: 28.18% (male 7,815,651 /female 7,793,261)15-24 years: 17.24% (male 4,711,480 /female 4,837,897)25-54 years: 42.05% (male 11,782,848 /female 11,503,831)55-64 years: 6.71% (male 1,725,034 /female 1,992,035)65 years and over: 5.81% (male 1,351,991 /female 1,866,182) (2018 est.)Birth rate 18.56 births/1,000 population (2022 est.) Country comparison to the world: 77th 19.9 births/1,000 population (2018 est.) Country comparison to the world: 78th Death rate 9.26 deaths/1,000 population (2022 est.) Country comparison to the world: 52nd 9.3 deaths/1,000 population (2018 est.) Country comparison to the world: 57th 2.18 children born/woman (2022 est.) Country comparison to the world: 90th 2.26 children born/woman (2018 est.) Country comparison to the world: 91st Population growth rate 0.93% (2022 est.) Country comparison to the world: 103rd 0.97% (2018 est.) Country comparison to the world: 114th Total: 28 years. Country comparison to the world: 142nd Male: 27.9 years Female: 28.1 years (2020 est.) Total: 27.4 years. Country comparison to the world: 144th Male: 27.2 years Female: 27.6 years (2018 est.) Contraceptive prevalence rate 54.6% (2016) Net migration rate 0 migrant(s)/1,000 population (2022 est.) Country comparison to the world: 98th -0.9 migrant(s)/1,000 population (2018 est.) Country comparison to the world: 138th Total dependency ratio: 52.5 (2015 est.) Youth dependency ratio: 44.8 (2015 est.) Elderly dependency ratio: 7.7 (2015 est.) Potential support ratio : 12.9 (2015 est.) Urbanization Urban population: 68.3% of total population (2022) Rate of urbanization: 1.72% annual rate of change (2020-25 est.) Urban population: 66.4% of total population (2018) Rate of urbanization: 1.97% annual rate of change (2015-20 est.) Life expectancy at birth Total population: 65.32 years. Country comparison to the world: 202nd Male: 63.99 years Female: 66.68 years (2022 est.) Total population: 64.1 years (2018 est.) Major infectious diseases Degree of risk: intermediate (2020) Food or waterborne diseases : bacterial diarrhea , hepatitis A , and typhoid fever Water contact diseases: schistosomiasis note: widespread ongoing transmission of a respiratory illness caused by the novel coronavirus (COVID-19 ) is occurring throughout South Africa; as of 6 June 2022, South Africa has reported a total of 3,968,205 cases of COVID-19 or 6,690.7 cumulative cases of COVID-19 per 100,000 population with a total of 101,317 cumulative deaths or a rate of 170.83 cumulative deaths per 100,000 population; as of 6 June 2022, 36.33% of the population has received at least one dose of COVID-19 vaccine
Ethnic groups Black African 80.9%, coloured 8.8%, white 7.8%, Indian/Asian 2.6% (2021 est.) Languages Map showing the dominant languages in South Africa isiZulu (official) 24.7%, isiXhosa (official) 15.6%, Afrikaans (official) 12.1%, Sepedi (official) 9.8%, Setswana (official) 8.9%, English (official) 8.4%, Sesotho (official) 8%, Xitsonga (official) 4%, siSwati (official) 2.6%, Tshivenda (official) 2.5%, Khoi, Nama, and San languages 1.9% isiNdebele (official) 1.6% (2017 est.) note: data represent language spoken most often at home Education expenditures 6.8% of GDP (2020) Country comparison to the world: 22nd 6.1% of GDP (2017) Country comparison to the world: 34th Literacy Definition: age 15 and over can read and write (2015 est.)
Total population: 95% Male: 95.5% Female: 94.5% (2019) Total population: 94.4% Male: 95.4% Female: 95.4% (2015 est.) Total: 14 years Male: 13 years Female: 14 years (2019) Total: 59.4% Male: 55.4% Female: 64.1% (2020 est.) Immigration South Africa hosts a sizeable refugee and asylum seeker population. According to the World Refugee Survey 2008 , published by the U.S. Committee for Refugees and Immigrants , this population numbered approximately 144,700 in 2007. [ 40] Groups of refugees and asylum seekers numbering over 10,000 included people from Zimbabwe (48,400), the Democratic Republic of the Congo (24,800), and Somalia (12,900). [ 40] These populations mainly lived in Johannesburg , Pretoria , Durban , Cape Town , and Port Elizabeth . [ 40] Many refugees have now also started to work and live in rural areas in provinces such as Mpumalanga and KwaZulu-Natal .
Statistics SA assumes in some of their calculations that there are fewer than 2 million immigrants in South Africa. [ 41] Other institutions, like the police and Médecins Sans Frontières place estimate the figure at 4 million. [ 42] [ 43] [ 44] [ 45]
Main countries of immigration in South Africa according to the 2011 Census and 2022 Census:
Source: 2022 South African census [ 2] Place of birth Population, 2011 Population, 2022 Difference Zimbabwe 672,308 1,012,059 339,751 Mozambique 393,231 416,564 23,333 Lesotho 160,806 227,770 66,964 Malawi 86,606 198,807 112,201 United Kingdom 81,720 61,282 -20,438 Ethiopia 28,230 58,131 29,901 Namibia 40,575 36,140 -4,435 India 31,165 27,350 -3,815 Nigeria 26,341 24,718 -1,623 Zambia 30,054 24,625 -5,429 Congo 26,061 23,328 -2,733 Bangladesh 19,696 20,894 1,198 DRC 25,630 17,635 -7,995 Somalia 26,116 15,838 -10,278 Pakistan 17,241 15,006 -2,235 Germany 20,494 12,139 -8,355 Botswana 12,316 8,976 -3,340 Portugal 15,626 7,615 -8,011
Immigration assumptions by Statistics South Africa to South Africa based on race. Negative numbers represent net migration from South Africa to other countries. [ 46]
Immigration by Race Year -400,000 -200,000 0 200,000 400,000 600,000 800,000 1,000,000 1985–2000 2011–2016 African Asian White Immigration in South Africa
Immigration to SA by Race
Year African Asian White 1985-2000 632 633 36 908 -202 868 2001-2006 565 916 25 310 -99 574 2006-2011 815 780 43 222 -106 787 2011-2016 972 995 54 697 -111 346 2016-2021 894 365 49 584 -90 956
Urbanisation "Urban areas contain about two-thirds of the population; many of these consist of huge informal or squatter settlements ." [ 47]
References 1 2 3 4 5 6 7 8 9 10 "Mid-year population estimates, 2024" . www.statssa.gov.za . Retrieved 29 September 2024 . 1 2 3 4 5 6 7 8 9 "Census 2022: Statistical Release" (PDF) . statssa.gov.za . Statistics South Africa. 10 October 2023. Archived (PDF) from the original on 26 July 2025. 1 2 3 "Statistics South Africa - Census Dissemination" . census.statssa.gov.za . Retrieved 20 October 2023 . ↑ "Census 2021 New Methodologies Test" . Statistics South Africa (Stats SA) . 20 July 2018. Archived from the original on 4 August 2018. ↑ "Table 3.5, Statistical release (Revised) P0301.4, Census 2011" (PDF) . Statssa.gov.za . Archived from the original (PDF) on 13 November 2015. Retrieved 25 July 2016 . ↑ "Nowhere left to go" . The Economist . 20 May 2008. Retrieved 29 August 2017 . ↑ "Escape From Mugabe: Zimbabwe's Exodus" . Archived from the original on 24 January 2016. ↑ "South Africa - Apartheid, Colonization, Freedom | Britannica" . www.britannica.com . 28 October 2024. Retrieved 29 October 2024 . 1 2 Smuts I: The Sanguine Years 1870–1919, W.K. Hancock, Cambridge University Press, 1962, pg 219 ↑ The Statesman's Year-Book, 1967–1968 (104th annual edition), edited by S.H. Steinberg, Macmillan, London; St. Martin's Press, New York, 1967, pages 1405–1424 ↑ The Europa Year Book 1969, Volume II: Africa, The Americas, Asia, Australasia , Europa Publications, London, 1969, page 1286 ↑ Ogura, Mitsuo (1996). "Urbanization and Apartheid in South Africa: Influx Controls and Their Abolition" . The Developing Economies . 34 (4): 402– 423. doi : 10.1111/j.1746-1049.1996.tb01178.x . ISSN 1746-1049 . PMID 12292280 . ↑ Statistics South Africa (1999). "The People of South Africa: Population Census, 1996" (PDF) . Retrieved 19 April 2020 . ↑ Statistics South Africa (2003). "Statistics South Africa: Census 2001" (PDF) . Retrieved 20 April 2020 . ↑ Statistics South Africa (2012). "Census 2011: Census in Brief" (PDF) . Retrieved 20 April 2020 . ↑ Ginsburg, Carl (2024). "South Africa's 2022 census under fire" . South African Journal of Science . 120 (7/8). Retrieved 17 June 2025 . ↑ Angus Maddison (2010). "Statistics on World Population, GDP and Per Capita GDP, 1-2008 AD" . University of Groningen . Archived from the original on 30 January 2021. Retrieved 1 March 2016 . ↑ The Statesman's Year-Book 1977–1978 (ed. John Paxton), St. Martin's Press, New York (& Macmillan, London), 1977, page 1296 ↑ "City of Cape Town / Isixeko Sasekapa, Stad Kaapstad: Metropolitan Municipality & Main Places – Statistics & Maps on City Population" . Citypopulation.de . Archived from the original on 29 August 2017. Retrieved 29 August 2017 . ↑ "South Africa: Provinces and Major Urban Areas - Population Statistics in Maps and Charts" . Citypopulation.de . Retrieved 29 August 2017 . ↑ Population Division of the Department of Economic and Social Affairs of the United Nations Secretariat (2015). "Total Population - Both Sexes (XLS, 3.74 MB) - 2015 revision" . United Nations. Archived from the original on 22 December 2015. Retrieved 1 March 2016 . ↑ "Mid-year population estimates" (PDF) . Statistics South Africa. 23 July 2015. Retrieved 1 March 2016 . 1 2 "World Population Prospects - Population Division - United Nations" . population.un.org . Archived from the original on 17 June 2020. Retrieved 6 February 2023 . ↑ "World Population Prospects 2019: Data Booklet" (PDF) . United Nations Department of Economic and Social Affairs Population Dynamics. Archived from the original (PDF) on 12 February 2020. Retrieved 21 March 2020 . ↑ https://census.statssa.gov.za/assets/documents/2022/P03014_Census_2022_Statistical_Release.pdf [ bare URL PDF ] ↑ "Statistical Release: Mid-year population estimates" (PDF) . statssa.gov.za . Statistics South Africa. 31 July 2021. Archived (PDF) from the original on 4 May 2025. ↑ "The DHS Program - Quality information to plan, monitor and improve population, health, and nutrition programs" . Dhsprogram.com . Retrieved 29 August 2017 . ↑ "World Population Prospects – Population Division – United Nations" . Archived from the original on 19 September 2016. Retrieved 15 July 2017 . ↑ "Life Expectancy at Exact Age x (ex) - Both Sexes (XLSX, 172.2 MB)" . docs.google.com . Retrieved 2 April 2023 . "World Population Prospects - Population Division - United Nations" . population.un.org . Retrieved 2 April 2023 . ↑ Lehohla, Pali (5 May 2005). "Debate over race and censuses not peculiar to SA" . Business Report . Archived from the original on 14 August 2007. Retrieved 25 August 2013 . Others pointed out that the repeal of the Population Registration Act in 1991 removed any legal basis for specifying 'race'. The Identification Act of 1997 makes no mention of race. On the other hand, the Employment Equity Act speaks of 'designated groups' being 'black people, women and people with disabilities'. The Act defines 'black' as referring to 'Africans, coloureds and Indians'. Apartheid and the racial identification which underpinned it explicitly linked race with differential access to resources and power. If the post-apartheid order was committed to remedying this, race would have to be included in surveys and censuses, so that progress in eradicating the consequences of apartheid could be measured and monitored. This was the reasoning that led to a 'self-identifying' question about 'race' or 'population group' in both the 1996 and 2001 population censuses, and in Statistics SA's household survey programme. 1 2 3 4 5 6 7 8 9 10 11 12 "Africa :: SOUTH AFRICA" . CIA The World Factbook. 2 November 2022. ↑ Study Commission on U.S. Policy toward Southern Africa (U.S.) (1981). South Africa: time running out : the report of the Study Commission on U.S. Policy Toward Southern Africa 42. ISBN 0-520-04547-5 ↑ Census 2011: Census in brief (PDF) . Pretoria: Statistics South Africa. 2012. ISBN 9780621413885 ↑ "The NA Approves South African Sign Language as the 12th Official Language - Parliament of South Africa" . ↑ "The languages of South Africa" . Media Club South Africa . Brand South Africa. December 2011. Archived from the original on 1 December 2017. Retrieved 24 November 2017 . 1 2 "Community profiles > Census 2011" . Statistics South Africa Superweb. Archived from the original on 30 September 2013. Retrieved 21 August 2013 . ↑ "In South Africa, many blacks convert to Islam" . Christian Science Monitor . 10 January 2002. Retrieved 29 August 2017 . ↑ "South Africa – Section I. Religious Demography" . U.S. Department of State. Retrieved 15 July 2006 . ↑ "The World FactBook - South Africa" , The World Factbook , 2022 This article incorporates text from this source, which is in the public domain . 1 2 3 "World Refugee Survey 2008" . U.S. Committee for Refugees and Immigrants. 19 June 2008. Archived from the original on 5 October 2007. ↑ "P03022009_6" . Statssa.gov.za. Archived from the original on 5 August 2012. Retrieved 5 January 2014 . ↑ "So where are Zimbabweans going?" . 8 November 2005. Retrieved 6 February 2023 . ↑ Slabbert, Antoinette (1 June 2009). "SA het baie meer mense as geraam" [ SA population may be much larger than previously thought] . sake24.com . Archived from the original on 15 July 2011. Retrieved 6 February 2023 . ↑ "South African Department of Home Affairs" . Archived from the original on 18 September 2010. Retrieved 6 February 2016 . ↑ South African Police Service 2009 Annual Report Archived 25 July 2013 at the Wayback Machine ↑ "Mid-year population estimates 2022" (PDF) . Statistics South Africa. 28 July 2022. Retrieved 14 November 2022 . ↑ "South Africa: Settlement Patterns" . Britannica.com . Retrieved 25 October 2017 . External links
Sovereign states States with limited
Dependencies and
This page is based on this
Wikipedia article Text is available under the
CC BY-SA 4.0 license; additional terms may apply.
Images, videos and audio are available under their respective licenses.