World Resources Institute

Last updated

World Resources Institute (WRI)
Formation1982;42 years ago (1982)
Founder James Gustave Speth
Headquarters Washington, D.C.
United States
Ani Dasgupta
Chairman of the Board
James Harmon
Revenue (2020)
US$ 149 million [1]
Expenses (2020)US$ 144 million [2]
Website WRI.org

The World Resources Institute (WRI) is a global research non-profit organization established in 1982 with funding from the MacArthur Foundation [3] [4] under the leadership of James Gustave Speth. [5] [6] Subsequent presidents include Jonathan Lash (1993 - 2011), Andrew D. Steer [3] (2012 - 2021) [7] and current president Ani Dasgupta (2021-). [8]

Contents

WRI studies sustainable practices for business, economics, finance and governance, with the purpose of better supporting human society in six areas: food, forests, water, energy, cities, and climate. [9] The institute's flagship report series is the World Resources Report, [10] each of which deals with a different topic. [11] WRI encourages initiatives for monitoring, data analysis, and risk assessment, including global and open source projects. WRI has maintained a 4 out of 4 stars rating from Charity Navigator since 1 October 2008.[ citation needed ] [12]

Organization

The mission of the World Resources Institute (WRI) is to “move society to provide for the needs and aspirations of current and future generations”. [13] It seeks to promote a sustainable human society [14] with a basis of human health and well-being, environmental sustainability, and economic opportunity. [15] WRI partners with local and national governments, private companies, publicly held corporations, and other non-profits, and offers services including global climate change issues, sustainable markets, ecosystem protection, and environmental responsible governance services. [16] [17]

The World Resources Institute maintains international offices in the Brazil, China, Colombia, Ethiopia, India, Indonesia, Kenya, Mexico, the Netherlands, Turkey, the United Kingdom and the United States and is active in over 50 countries. [18] A report by the Center for International Policy's Foreign Influence Transparency Initiative of the top 50 think tanks on the University of Pennsylvania's Global Go-To Think Tanks rating index found that during the period 2014–2018 World Resources Institute received more funding from outside the United States than any other think tank, with a total of more than US$63 million, though this was described as "unsurprising" given the institute's presence in so many countries. [19] In 2014, Stephen M. Ross, an American real estate developer, gave the organization US$30 million to establish the WRI Ross Center for Sustainable Cities. [20]

Initiatives

WRI's activities are focused on the areas of water (including oceans), forests, climate, [21] energy, [22] food [23] [24] and cities. [25] [26] WRI is active in initiatives for monitoring, data analysis, and risk assessment. WRI emphasizes the extent to which systems are linked, and the need to connect issues such as addressing food insecurity with strategies to address climate change, protect ecosystems, and provide economic security. [27]

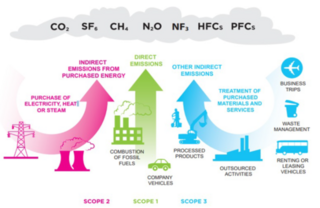
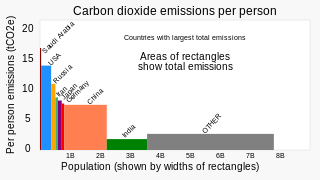
WRI worked with companies to develop a common standard, the Greenhouse Gas Protocol for quantifying and managing GHG emissions. [28] [29] WRI tracks estimates of fossil fuel combustion and greenhouse gas emissions, published as biennial reports. [30] WRI's Science Based Targets initiative (SBTi) was established in 2015 to help companies to set emission reduction targets in line with climate science. [31] [32] The WRI manages the Climate Watch website (formerly known as the CAIT Climate Data Explorer), which enables journalists and others to examine greenhouse gas data by country and per capita emissions. [33] [34]

In 1997 and 2000, WRI published the first comparative study of material flow accounting (MFA), using time series data to comprehensively assess all material inputs and outputs (excluding water) used by industrial economies. [35]

In 2008, the World Resources Institute reported on water quality world-wide, identifying over 400 dead zones due to eutrophication including areas in the Baltic Sea, the Chesapeake Bay in the United States, and Australia's Great Barrier Reef (33, 34). Eutrophication results from the discharge of highly concentrated phosphorus in urban wastewater into lakes and rivers, and from agricultural nutrient pollution. [36] WRI advocates for the use of local nature-based solutions (NBS), which tend to be cost-effective, to improve ecosystems, resist water-related climate impacts, and mitigate the effects of warming. [37] WRI publishes the Aqueduct Water Risk Atlas, ranking countries in terms of risk of severe water crises. [38] [39]

WRI is active in studying the world's coral reefs, [40] publishing reports in 1998 and 2011 that tracked damages due to coastal development, overfishing, climate change and rising ocean acidity. [41] [42] [43] A 2022 report examines reefs to a 500 metres (1,600 ft) resolution and analyzes the protection that reefs provide to people, infrastructure and the GDP. [44]

Beginning in 2002, the World Resources Institute worked with the Cameroon Forest Initiative, to combine disparate sources of data on land use to form digital and paper maps to track changes to Cameroon's forests and improve their management. They integrated satellite imagery with information on agricultural terrain, boundaries, protected land, community-owned forests, and authorized land use by commercial logging operations and mining concessions. [45]

In 2014, WRI built upon Matthew C. Hansen's work at the University of Maryland on forest change analysis. WRI partnered with Google Earth Engine to develop Global Forest Watch (GFW), an open-source web application that uses Landsat satellite imagery to map forest changes. [46] [47] [48] Weekly GLAD deforestation alerts and daily Fires alerts can be specific to a 30 square metres (320 sq ft) area. Global Forest Watch is most frequently used by nongovernmental organizations (NGOs), academic researchers, government employees, and the private sector. It is also used by journalists and indigenous groups, [49] [50] many of whose lands are threatened. [51] [52] Applications of Global Forest Watch include rapid detection and response to fires, [49] detecting illegal logging, assuring supply chain transparency, and assessing endangered tiger habitats. [53]

Working with the Sustainability Consortium, WRI works to identify and quantify major drivers of forest losses. For example, they have identified industrial scale internationally traded commodity crops such as beef, soybeans, palm oil, corn, and cotton as a dominant driver of forest loss in South America and Southeast Asia. [54] [55]

As of January 2021, WRI used Global Forest Watch to generate a forest carbon flux map that combined data about emissions and removals of forest-related greenhouse gases. Using a new method for integrating ground, airborne, and satellite data to measure carbon fluctuations in forests, they were able to map forests worldwide at a resolution of 30 metres (98 ft) yearly from 2001–2019. They were able to identify the contributions of different forest types, confirming that tropical forests both absorb more carbon than other types of forests, and release more as a result of deforestation and degradation. By integrating emissions and removals, the map increases the transparency and accuracy of global carbon estimates and can support more effective forest management decisions. [56] [57]

In addition to mapping carbon emissions from forest loss, WRI is working with scientists at Purdue University, Science-i, and the Global Forest Biodiversity Initiative to develop methods for assessing carbon accumulation rates in forested ecosystems. Such rates are affected by three forest growth components, which are difficult to measure: ingrowth, upgrowth and mortality. Being able to assess this more accurately would reduce uncertainty in estimating the impact of global forests as a carbon sink. [58]

WRI has partnered with Google Earth Engine to develop Dynamic World, a near real-time (NRT) application that uses high-resolution satellite images to do land use land cover (LULC) classification. Dynamic World identifies areas of land and water such as wetlands, forests, trees, crops and urban areas. Released in June 2022, its uses include monitoring ecosystem restoration, assessing protected areas, and detecting land changes due to deforestation and fires. [59] [60] [61]

WRI's LandMark project provides maps and information indicating lands that are collectively held and used by Indigenous peoples and local communities. [52] Data for the Amazon region has shown that rainforest managed by local and Indigenous communities stores carbon dioxide, while rainforest managed by government and private interests is a net source of greenhouse gases. [62]

Other WRI initiatives include The Access Initiative, which ranks countries based on environmental democracy, the ability of citizens to engage in decision-making about natural resources, as measured by transparency, public participation laws, and access to justice. [63] [64]

In 2014, philanthropist Stephen M. Ross established the WRI Ross Center for Sustainable Cities through a major gift. [65] The Center focuses on the development of sustainable cities and improvements in quality of life in developing countries around the world. WRI's flagship report for 2021 was Seven Transformations for More Equitable and Sustainable Cities. [10] It followed Accelerating Building Efficiency: Eight Actions for Urban Leaders (2019). [66]

The Platform for Accelerating the Circular Economy (PACE) is a public-private collaboration platform and project accelerating focusing on building the circular economy. [67] PACE was launched during the 2018 World Economic Forum Annual meeting. [68]

The Renewable Energy Buyers Alliance (REBA) is an alliance of large clean energy buyers, energy providers, and service providers that is unlocking the marketplace for all non-residential energy buyers to lead a rapid transition to a cleaner, prosperous, zero-carbon renewable energy future. [69] It has over 200 members including Google, GM, Facebook, Walmart, Disney and other large companies, and reached 6 GW capacity in 2018. [70]

WIR's Champions 12.3 coalition [13] promotes a “Target, Measure, Act” strategy with the goal of halving food loss and waste by 2030. [71]

Criticism

A 1990 study by the World Resources Institute was criticized by Anil Agarwal, who had been on the council of the World Resources Institute from 1988 to 1990. Agarwal, who "was among the first to argue that concepts of social equity need to be integrated into international policies aimed at mitigating the harmful effects of human-induced climate change", [72] accused WRI of allocating too much responsibility for global warming to developing countries, and under-acknowledging the impact of U.S. overconsumption on global warming. He called the WRI study an example of environmental colonialism and suggested that a fairer analysis would balance sources of emissions against terrestrial sinks for each nation. [73] [74] His critique sparked considerable debate about the appropriate methodologies for such analysis, and resulted in increased awareness of the issues involved. [75] [76]

See also

Related Research Articles

<span class="mw-page-title-main">Causes of climate change</span> Effort to scientifically ascertain mechanisms responsible for recent global warming

The scientific community has been investigating the causes of climate change for decades. After thousands of studies, it came to a consensus, where it is "unequivocal that human influence has warmed the atmosphere, ocean and land since pre-industrial times." This consensus is supported by around 200 scientific organizations worldwide, The dominant role in this climate change has been played by the direct emissions of carbon dioxide from the burning of fossil fuels. Indirect CO2 emissions from land use change, and the emissions of methane, nitrous oxide and other greenhouse gases play major supporting roles.

<span class="mw-page-title-main">Climate change mitigation</span> Actions to reduce net greenhouse gas emissions to limit climate change

Climate change mitigation is action to limit the greenhouse gases in the atmosphere that cause climate change. Greenhouse gas emissions are primarily caused by people burning fossil fuels such as coal, oil, and natural gas. Phasing out fossil fuel use can happen by conserving energy and replacing fossil fuels with clean energy sources such as wind, hydro, solar, and nuclear power. Secondary mitigation strategies include changes to land use and removing carbon dioxide (CO2) from the atmosphere. Governments have pledged to reduce greenhouse gas emissions, but actions to date are insufficient to avoid dangerous levels of climate change.

<span class="mw-page-title-main">Carbon footprint</span> Concept to quantify greenhouse gas emissions from activities or products

A carbon footprint (or greenhouse gas footprint) is a calculated value or index that makes it possible to compare the total amount of greenhouse gases that an activity, product, company or country adds to the atmosphere. Carbon footprints are usually reported in tonnes of emissions (CO2-equivalent) per unit of comparison. Such units can be for example tonnes CO2-eq per year, per kilogram of protein for consumption, per kilometer travelled, per piece of clothing and so forth. A product's carbon footprint includes the emissions for the entire life cycle. These run from the production along the supply chain to its final consumption and disposal.

<span class="mw-page-title-main">Carbon offsets and credits</span> Carbon dioxide reduction scheme

Carbon offsetting is a carbon trading mechanism that allows entities such as governments or businesses to compensate for (i.e. “offset”) their greenhouse gas emissions. It works by supporting projects that reduce, avoid, or remove emissions elsewhere. In other words, carbon offsets work by offsetting emissions through investments in emission reduction projects. When an entity invests in a carbon offsetting program, it receives carbon credits. These "tokens" are then used to account for net climate benefits from one entity to another. A carbon credit or offset credit can be bought or sold after certification by a government or independent certification body. One carbon offset or credit represents a reduction, avoidance or removal of one tonne of carbon dioxide or its carbon dioxide-equivalent (CO2e).

<span class="mw-page-title-main">Carbon accounting</span> Processes used to measure how much carbon dioxide equivalents an organization sequesters or emits

Carbon accounting is a framework of methods to measure and track how much greenhouse gas (GHG) an organization emits. It can also be used to track projects or actions to reduce emissions in sectors such as forestry or renewable energy. Corporations, cities and other groups use these techniques to help limit climate change. Organizations will often set an emissions baseline, create targets for reducing emissions, and track progress towards them. The accounting methods enable them to do this in a more consistent and transparent manner.

<span class="mw-page-title-main">Greenhouse gas emissions</span> Sources and amounts of greenhouse gases emitted to the atmosphere from human activities

Greenhouse gas (GHG) emissions from human activities intensify the greenhouse effect. This contributes to climate change. Carbon dioxide, from burning fossil fuels such as coal, oil, and natural gas, is one of the most important factors in causing climate change. The largest emitters are China followed by the United States. The United States has higher emissions per capita. The main producers fueling the emissions globally are large oil and gas companies. Emissions from human activities have increased atmospheric carbon dioxide by about 50% over pre-industrial levels. The growing levels of emissions have varied, but have been consistent among all greenhouse gases. Emissions in the 2010s averaged 56 billion tons a year, higher than any decade before. Total cumulative emissions from 1870 to 2017 were 425±20 GtC from fossil fuels and industry, and 180±60 GtC from land use change. Land-use change, such as deforestation, caused about 31% of cumulative emissions over 1870–2017, coal 32%, oil 25%, and gas 10%.

<span class="mw-page-title-main">Greenhouse gas emissions by the United States</span> Climate changing gases from the North American country

The United States produced 5.2 billion metric tons of carbon dioxide equivalent greenhouse gas (GHG) emissions in 2020, the second largest in the world after greenhouse gas emissions by China and among the countries with the highest greenhouse gas emissions per person. In 2019 China is estimated to have emitted 27% of world GHG, followed by the United States with 11%, then India with 6.6%. In total the United States has emitted a quarter of world GHG, more than any other country. Annual emissions are over 15 tons per person and, amongst the top eight emitters, is the highest country by greenhouse gas emissions per person. However, the IEA estimates that the richest decile in the US emits over 55 tonnes of CO2 per capita each year. Because coal-fired power stations are gradually shutting down, in the 2010s emissions from electricity generation fell to second place behind transportation which is now the largest single source. In 2020, 27% of the GHG emissions of the United States were from transportation, 25% from electricity, 24% from industry, 13% from commercial and residential buildings and 11% from agriculture. In 2021, the electric power sector was the second largest source of U.S. greenhouse gas emissions, accounting for 25% of the U.S. total. These greenhouse gas emissions are contributing to climate change in the United States, as well as worldwide.

<span class="mw-page-title-main">Low-carbon electricity</span> Power produced with lower carbon dioxide emissions

Low-carbon electricity or low-carbon power is electricity produced with substantially lower greenhouse gas emissions over the entire lifecycle than power generation using fossil fuels. The energy transition to low-carbon power is one of the most important actions required to limit climate change.

<span class="mw-page-title-main">Climate change in Australia</span> Impacts of climate change on Australia and responses

Climate change has been a critical issue in Australia since the beginning of the 21st century. Australia is becoming hotter and more prone to extreme heat, bushfires, droughts, floods, and longer fire seasons because of climate change. Climate issues include wildfires, heatwaves, cyclones, rising sea levels, and erosion.

<span class="mw-page-title-main">Climate change in China</span> Emissions, impacts and responses of China related to climate change

Climate change is having major effects on the Chinese economy, society and the environment. China is the largest emitter of carbon dioxide, through an energy infrastructure heavily focused on coal. Other industries, such as a burgeoning construction industry and industrial manufacturing, contribute heavily to carbon emissions. However, like other developing countries, on a per-capita basis, China's carbon emissions are considerably less than countries like the United States. It has also been noted that higher-income countries have outsourced emissions-intensive industries to China. On the basis of cumulative CO2 emissions measured from 1751 through to 2017, China is responsible for 13% globally and about half of the United States' cumulative emissions. China is now the world's largest polluter and in 2023 recorded it's hottest year on record with an average temperature of 10.7 C.

<span class="mw-page-title-main">Deforestation and climate change</span> Relationship between deforestation and global warming

Deforestation is a primary contributor to climate change, and climate change affects the health of forests. Land use change, especially in the form of deforestation, is the second largest source of carbon dioxide emissions from human activities, after the burning of fossil fuels. Greenhouse gases are emitted from deforestation during the burning of forest biomass and decomposition of remaining plant material and soil carbon. Global models and national greenhouse gas inventories give similar results for deforestation emissions. As of 2019, deforestation is responsible for about 11% of global greenhouse gas emissions. Carbon emissions from tropical deforestation are accelerating.

<span class="mw-page-title-main">Climate-smart agriculture</span> System for agricultural productivity

Climate-smart agriculture (CSA) is a set of farming methods that has three main objectives with regards to climate change. Firstly, they use adaptation methods to respond to the effects of climate change on agriculture. Secondly, they aim to increase agricultural productivity and to ensure food security for a growing world population. Thirdly, they try to reduce greenhouse gas emissions from agriculture as much as possible. Climate-smart agriculture works as an integrated approach to managing land. This approach helps farmers to adapt their agricultural methods to the effects of climate change.

<span class="mw-page-title-main">Greenhouse gas emissions from agriculture</span> Agricultures effects on climate change

The amount of greenhouse gas emissions from agriculture is significant: The agriculture, forestry and land use sector contribute between 13% and 21% of global greenhouse gas emissions. Agriculture contributes towards climate change through direct greenhouse gas emissions and by the conversion of non-agricultural land such as forests into agricultural land. Emissions of nitrous oxide and methane make up over half of total greenhouse gas emission from agriculture. Animal husbandry is a major source of greenhouse gas emissions.

<span class="mw-page-title-main">Greenhouse gas emissions by China</span> Emissions of gases harmful to the climate from China

China's greenhouse gas emissions are the largest of any country in the world both in production and consumption terms, and stem mainly from coal burning, including coal power, coal mining, and blast furnaces producing iron and steel. When measuring production-based emissions, China emitted over 14 gigatonnes (Gt) CO2eq of greenhouse gases in 2019, 27% of the world total. When measuring in consumption-based terms, which adds emissions associated with imported goods and extracts those associated with exported goods, China accounts for 13 gigatonnes (Gt) or 25% of global emissions.

The GHG Protocol Corporate Standard is an initiative for the global standardisation of emission of Greenhouse Gases in order that corporate entities should measure, quantify, and provide reportage of their own emission levels so that global emissions are made manageable. The relevant gases, as described by the 11 December 1997 Kyoto Protocol, that was implemented 16 February 2005, are: carbon dioxide, hydrofluorocarbons, methane, nitrous oxide, nitrogen trifluoride, perfluorocarbons and sulphur hexafluoride. The protocol itself is under the management of the World Resources Institute and the World Business Council for Sustainable Development. The GHGP was launched in 1998 and introduced in 2001.

References

  1. World Resources Institute. "WRI ANNUAL REPORT | 2020-2021" (PDF). www.wri.org/. p. 36. Retrieved April 4, 2024.{{cite web}}: CS1 maint: url-status (link)
  2. World Resources Institute. "WRI ANNUAL REPORT | 2020-2021" (PDF). www.wri.org/. p. 36. Retrieved April 4, 2024.{{cite web}}: CS1 maint: url-status (link)
  3. 1 2 Broder, John M. (March 14, 2012). "Climate Change Envoy to Lead Influential Institute". New York Times. Retrieved August 6, 2014.
  4. "World Resources Institute". MacArthur Foundation. Retrieved June 5, 2023.
  5. "James Gustave Speth". World Resources Institute. Retrieved August 6, 2014.
  6. Rich, Nathaniel (August 1, 2018). "Losing Earth: The Decade We Almost Stopped Climate Change". The New York Times. Retrieved June 6, 2023.
  7. Stiffler, Lisa (March 9, 2021). "$10B Bezos Earth Fund hires a long-time global leader on climate issues as president and CEO". GeekWire. Retrieved June 1, 2023.
  8. Uchida, Kyoko (April 17, 2023). "Ani Dasgupta, President and CEO, World Resources Institute: Philanthropy's opportunity to fill the gaps—and do it right". Philanthropy News Digest. Retrieved June 1, 2023.
  9. "World Resources Institute | UNDP Climate Change Adaptation". United Nations Development Programme 2023. Retrieved June 5, 2023.
  10. 1 2 "Illustrating a Call to Action for More Equitable and Sustainable Cities". Graphicacy. December 2, 2021.
  11. "World Resources Report". World Resources Institute. December 4, 2018.
  12. "Charity Navigator - Rating for World Resources Institute". www.charitynavigator.org. Retrieved June 8, 2023.
  13. 1 2 Steer, Andrew (October 17, 2018). "Raising Early Warnings About Climate Change". MacArthur Foundation. Retrieved June 6, 2023.
  14. "World Resources Institute". UNCCD. Retrieved June 5, 2023.
  15. "World Resources Institute Offices – Washington DC". Office Snapshots. August 30, 2016. Retrieved October 11, 2017.
  16. Bloomberg (2017). "World Resources Institute". bloomberg.com. Retrieved October 11, 2017.
  17. "Charitywatch: World Resources Institute". American Institute of Philanthropy. Retrieved October 11, 2017.
  18. "WRI develops practical solutions that improve people's lives and ensure nature can thrive". World Resources Institute. Retrieved June 2, 2023.
  19. Freeman, Ben (January 2020). Foreign Funding of Think Tanks in America (PDF) (Report). Center for International Policy. p. 11. Archived from the original (PDF) on September 1, 2020. Retrieved September 6, 2020.
  20. Pogrebin, Robin. "Developer Gives $30 Million to Establish City Planning Center". New York Times. Retrieved August 6, 2014.
  21. Gardner, Timothy (October 19, 2022). "'Massive gaps' seen in countries' plans to tackle climate change -study". Reuters.
  22. M.A. Siraj (September 15, 2017). "Powering cities with clean energy". Thehindu.com . Retrieved October 9, 2017.
  23. "Food That's Climate-Friendly, Tasty, Nutritious". Csrwire. April 19, 2023. Retrieved June 6, 2023.
  24. "Sustainable Hospitality Alliance partners with World Resources Institute to support the Hospitality Industry Tackle Climate Change Through Food". Hospitality Net. May 25, 2023.
  25. "How Barranquilla brought green urban spaces to the people". Smart Cities World. February 20, 2023.
  26. "Transcript: This is Climate: Sustainable Cities". Washington Post. April 5, 2023.
  27. "World Resources Report: Creating a Sustainable Food Future - A Menu of Solutions to Feed Nearly 10 Billion People by 2050, Final Report, July 2019 - World | ReliefWeb". ReliefWeb Blog. July 17, 2019.
  28. Michaelowa, Axel (November 4, 2015). "Opportunities for and Alternatives to Global Climate Regimes Post-Kyoto". Annual Review of Environment and Resources. 40 (1): 395–417. doi: 10.1146/annurev-environ-102014-021112 . ISSN   1543-5938.
  29. Yetano Roche, María; Lechtenböhmer, Stefan; Fischedick, Manfred; Gröne, Marie-Christine; Xia, Chun; Dienst, Carmen (October 17, 2014). "Concepts and Methodologies for Measuring the Sustainability of Cities". Annual Review of Environment and Resources. 39 (1): 519–547. doi: 10.1146/annurev-environ-012913-101223 . ISSN   1543-5938.
  30. Siddiqi, Toufiq A. (November 1995). "Asia-Wide Emissions of Greenhouse Gases". Annual Review of Energy and the Environment. 20 (1): 213–232. doi: 10.1146/annurev.eg.20.110195.001241 . ISSN   1056-3466.
  31. Novozymes (November 10, 2022). "As one of the first companies in the world, Novozymes has had its net-zero target validated by the Science Based Targets initiative". GlobeNewswire News Room. Retrieved June 6, 2023.
  32. "Set Science-Based Emission Reduction Targets | UN Global Compact". United Nations Global Compact. Retrieved June 6, 2023.
  33. "The World's Greenhouse Gas Emissions in One Graphic | Climate Central". www.climatecentral.org. July 3, 2015.
  34. Darby, Megan (October 21, 2015). "7 climate change data tools and what they tell you". Climate Home News.
  35. Krausmann, Fridolin; Schandl, Heinz; Eisenmenger, Nina; Giljum, Stefan; Jackson, Tim (October 17, 2017). "Material Flow Accounting: Measuring Global Material Use for Sustainable Development". Annual Review of Environment and Resources. 42 (1): 647–675. doi: 10.1146/annurev-environ-102016-060726 . ISSN   1543-5938.
  36. Cordell, Dana; White, Stuart (October 17, 2014). "Life's Bottleneck: Sustaining the World's Phosphorus for a Food Secure Future". Annual Review of Environment and Resources. 39 (1): 161–188. doi: 10.1146/annurev-environ-010213-113300 . ISSN   1543-5938.
  37. "WRI: Investing in nature is most cost-effective for water crisis". La Prensa Latina Media. September 3, 2022.
  38. Mala, Alisa (December 30, 2022). "The 10 Most Water-Stressed Countries In The World". WorldAtlas. Retrieved June 6, 2023.
  39. Holden, Emily; Doshi, Vidhi (August 6, 2019). "Extreme water stress affects a quarter of the world's population, say experts". The Guardian.
  40. Novi, Lyuba; Bracco, Annalisa (December 10, 2022). "Machine learning prediction of connectivity, biodiversity and resilience in the Coral Triangle". Communications Biology. 5 (1): 1359. doi:10.1038/s42003-022-04330-8. ISSN   2399-3642. PMC   9741626 . PMID   36496519.
  41. Rudolf, John Collins (February 24, 2011). "Deeper Peril for Coral Reefs". The New York Times Green Blog.
  42. Irvine, Dean (May 25, 2010). "Could online maps save coral reefs? - CNN.com". CNN. Retrieved June 6, 2023.
  43. Society, Wildlife Conservation (April 8, 2015). "Recipe for saving coral reefs: Add more fish". Phys.org.
  44. "Coral Reefs as Coastal Defenders". The Nature Conservancy. October 17, 2022. Retrieved June 6, 2023.
  45. Bryce, Emma (November 15, 2012). "Mapping Cameroon's Motley Canopy". The New York Times Green Blog.
  46. McGrath, Matt (February 21, 2014). "New online tool tracks tree loss in 'near real time'". BBC News. Retrieved November 10, 2015.
  47. Newman, Lily (February 21, 2014). "This Mapping Service Lets Us Watch Forests Shrink". Slate. Retrieved November 10, 2015.
  48. Hansen, M. C.; Potapov, P. V.; Moore, R.; Hancher, M.; Turubanova, S. A.; Tyukavina, A.; Thau, D.; Stehman, S. V.; Goetz, S. J.; Loveland, T. R.; Kommareddy, A.; Egorov, A.; Chini, L.; Justice, C. O.; Townshend, J. R. G. (November 15, 2013). "High-Resolution Global Maps of 21st-Century Forest Cover Change". Science. 342 (6160): 850–853. doi:10.1126/science.1244693. ISSN   0036-8075.
  49. 1 2 Shea, Katherine (2022). "Measuring the Impact of Monitoring: How We Know Transparent Near-Real-Time Data Can Help Save the Forests". Transformational Change for People and the Planet: Evaluating Environment and Development. Sustainable Development Goals Series. Springer International Publishing. pp. 263–273. doi:10.1007/978-3-030-78853-7_18. ISBN   978-3-030-78853-7.
  50. Datta, Anusuya (January 31, 2022). "Eyes in the skies: Getting the most out of satellite data and images | Quill". Quill.
  51. Yeung, Peter (May 1, 2023). "The world's best rainforest guardians already live there". Washington Post.
  52. 1 2 "LandMark Map". LandMark. Retrieved June 6, 2023.
  53. "Case Studies". Google Earth Engine. Retrieved June 5, 2023.
  54. Ritchie, Hannah; Roser, Max; Rosado, Pablo (May 11, 2020). "CO₂ and Greenhouse Gas Emissions". Our World in Data.
  55. Voiland, Adam (August 11, 2021). "Sizing Up How Agriculture Connects to Deforestation". earthobservatory.nasa.gov. Retrieved June 5, 2023.
  56. "NASA Satellites Help Quantify Forests' Impacts on the Global Carbon Budget". NASA Jet Propulsion Laboratory (JPL). February 3, 2021. Retrieved June 6, 2023.
  57. Harris, Nancy L.; Gibbs, David A.; Baccini, Alessandro; Birdsey, Richard A.; de Bruin, Sytze; Farina, Mary; Fatoyinbo, Lola; Hansen, Matthew C.; Herold, Martin; Houghton, Richard A.; Potapov, Peter V.; Suarez, Daniela Requena; Roman-Cuesta, Rosa M.; Saatchi, Sassan S.; Slay, Christy M.; Turubanova, Svetlana A.; Tyukavina, Alexandra (March 2021). "Global maps of twenty-first century forest carbon fluxes". Nature Climate Change. 11 (3): 234–240. doi:10.1038/s41558-020-00976-6. ISSN   1758-6798.
  58. "Purdue launches new AI-based global forest mapping project". Purdue University Agriculture News. January 25, 2023.
  59. Cowan, Carolyn (June 9, 2022). "New near-real-time tool reveals Earth's land cover in more detail than ever before". Mongabay Environmental News. Retrieved June 5, 2023.
  60. Price, Gary (June 9, 2022). "Dynamic World: A New Online Tool from World Resources Institute and Google Earth Engine Shows How the Planet Is Changing in Near Real Time". Library Journal infoDOCKET. Retrieved June 5, 2023.
  61. Brown, Christopher F.; Brumby, Steven P.; Guzder-Williams, Brookie; Birch, Tanya; Hyde, Samantha Brooks; Mazzariello, Joseph; Czerwinski, Wanda; Pasquarella, Valerie J.; Haertel, Robert; Ilyushchenko, Simon; Schwehr, Kurt; Weisse, Mikaela; Stolle, Fred; Hanson, Craig; Guinan, Oliver; Moore, Rebecca; Tait, Alexander M. (June 9, 2022). "Dynamic World, Near real-time global 10 m land use land cover mapping". Scientific Data. 9 (1): 251. doi:10.1038/s41597-022-01307-4. PMC   9184477 .
  62. Berwyn, Bob; Surma, Katie (January 16, 2023). "In the Amazon, Indigenous and Locally Controlled Land Stores Carbon, but the Rest of the Rainforest Emits Greenhouse Gases". Inside Climate News. Retrieved June 6, 2023.
  63. "Home | The Access Initiative". accessinitiative.org.
  64. "India ranks 24th out of 70 countries in the first Environmental Democracy Index". The Indian Express. May 21, 2015.
  65. "Stephen Ross Makes Over $30 Million Gift to WRI to Advance Sustainable Cities". World Resources Institute. May 19, 2014. Retrieved June 6, 2023.
  66. Michell, Nick (June 5, 2016). "WRI releases new cities report on building efficiency". Cities Today.
  67. Moloney, Anastasia (February 5, 2021). "Consume less, recycle more to meet climate goals, ministers say". Thomson Reuters Foundation News.
  68. "PACE Releases Guidance for Circular Economy Transition in Five Sectors | News". IISD's SDG Knowledge Hub. February 24, 2021.
  69. "REBA – Renewable Energy Buyers Alliance". rebuyers.org.
  70. Dzikiy, Phil (March 28, 2019). "Google, GM, and more than 300 other companies launch Renewable Energy Buyers Alliance". Electrek . Retrieved March 28, 2019.
  71. Goodwin, Liz (October 28, 2022). "Is Global Progress to Fight Food Loss and Waste Enough?". The OECD Forum Network.
  72. Dickson, David (January 2002). "Anil Agarwal (1947–2002)". Nature. 415 (6870): 384. doi: 10.1038/415384a . ISSN   1476-4687.
  73. Agarwal, Anil; Narain, Sunita (November 21, 2019). "Global Warming in an Unequal World: A Case of Environmental Colonialism". India in a Warming World: Integrating Climate Change and Development. doi: 10.1093/oso/9780199498734.003.0005 .
  74. World resources 1990-91: a report. New York, NY: Oxford Univ. Pr. 1990. ISBN   978-0195062298.
  75. Guha, Ramachandra (2002). "Environmentalist of the Poor". Economic and Political Weekly. 37 (3): 204–207. ISSN   0012-9976. JSTOR   4411622.
  76. Lash, Scott; Szerszynski, Bronislaw; Wynne, Brian (April 5, 1996). Risk, Environment and Modernity: Towards a New Ecology. SAGE. p. 244. ISBN   978-0-8039-7938-3.