This article needs additional citations for verification .(January 2017) |


Environmental issues in the United States include climate change, energy, species conservation, invasive species, deforestation, mining, nuclear accidents, pesticides, pollution, waste and over-population. Despite taking hundreds of measures, the rate of environmental issues is increasing rapidly instead of reducing. The United States is among the most significant emitters of greenhouse gasses in the world. In terms of both total and per capita emissions, it is among the largest contributors. [2] The climate policy of the United States has a major influence on the world. [3] [4]
Contents
- Movements and ideas
- 20th century
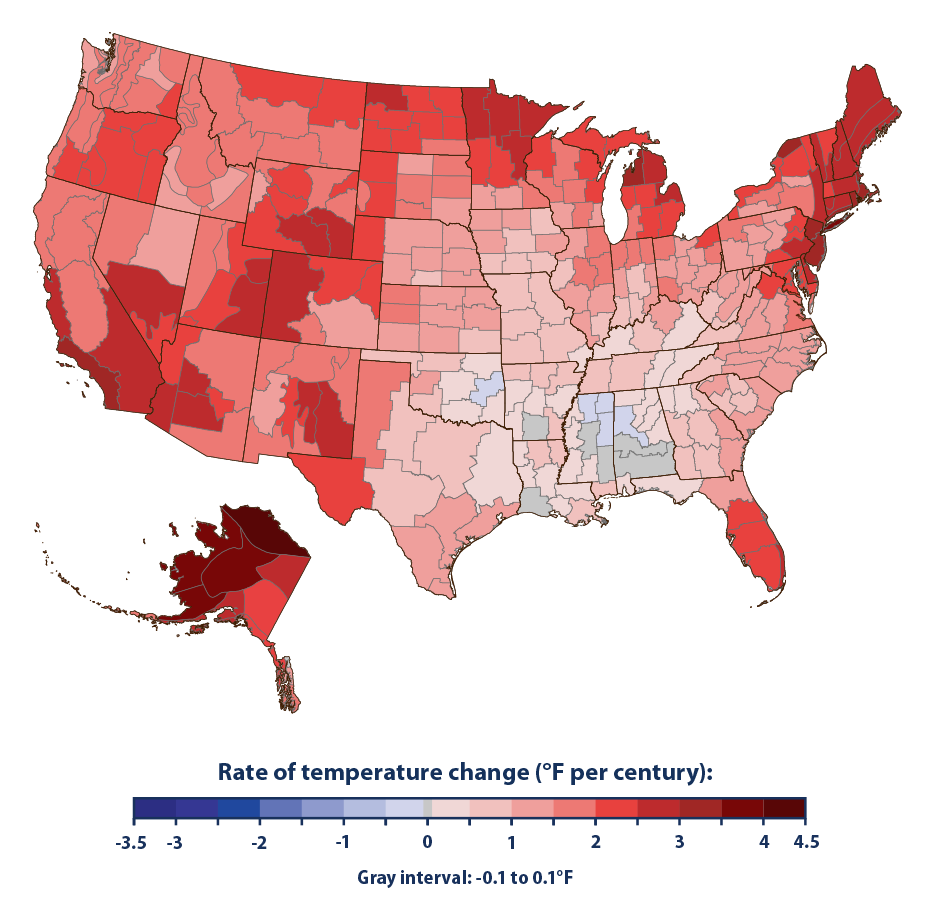
- Climate change
- Energy
- Species conservation
- Invasive species
- Deforestation
- Mining
- Abandoned fossil fuel wells
- Nuclear
- Pesticides
- Pollution
- Air pollution
- Water pollution
- Marine pollution
- Plastic pollution
- Solid waste
- Population
- Conservation and environmental movement
- See also
- Notes
- References
- Works cited
- Further reading
- External links


