Obesity is defined as a person having excess body fat "Obesity can be measured in different ways, but most common is the Body Mass Index (BMI) which is calculated based on a person's height and weight." [2]
Statistics
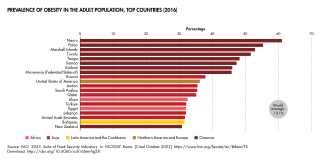
Prevalence of obesity in the adult population, top countries (2016), the United States has the tenth highest rate in the world.
The CDC defines an adult (a person aged 20 years or greater) with a body mass index (BMI) of 30 or greater as obese and an adult with a BMI of 25.0 to 29.9 as overweight.[3] Obesity in adults is divided into three categories. Adults with a BMI of 30 to 34.9 have class 1 obesity; adults with a BMI of 35 to 39.9 have class 2 obesity; adults with a BMI of 40 or greater have class 3 obesity, which is also known as extreme or severe obesity (and was formerly known as morbid obesity).[4][5] Children (persons aged 2 to 19 years) with a BMI at or above the 95th percentile of children of the same age and sex are defined as obese, and children with a BMI at or above the 85th percentile but less than the 95th percentile are defined as overweight.[6]
Compared to non-obese Americans, between 2001 and 2016, obese Americans incurred an average of $2,505 more in medical expenses annually, and in 2016, the aggregate medical cost due to obesity in the United States of America was $260.6 billion.[7] However, some evidence suggests the lifetime cost of medical treatment for obese individuals is lower than for healthy weight individuals. This is because healthy weight people live longer statistically and tend to develop chronic diseases that need to be continually treated into old age, whereas obese people tend to die from metabolic diseases at younger ages and avoid some of those protracted medical costs.[8] While lifetime medical costs for obese individuals may be lower than for healthy weight individuals, obese individuals cause significant economic productivity loss (ranging from $13.4 billion to $26.8 billion in 2016).[9]
The obesity rate has steadily increased since 1960–1962, where approximately 13% of American adults were obese. By 2014, figures from the CDC found that more than one-third (crude estimate 36.5%) of U.S. adults[10][11] and 17% of children were obese.[12] By 2014, figures from the National Institute of diabetes shows that 82% of Americans are overweight.[13]National Center for Health Statistics at the CDC showed that 42.4% of U.S. adults were obese as of 2017–2018 (43% for men and 41.9% for women).[14] The National institute of Diabetes states that 73.1% of Americans were obese or overweight as of 2017-2018.[15]
For the following statistics, "adult" is defined as age 20 and over. The overweight + obese percentages for the overall US population are higher reaching 39.4% in 1997, 44.5% in 2004,[16] 56.6% in 2007,[17] 63.8% (adults) and 17% (children) in 2008,[18][19] in 2010 65.7% of American adults and 17% of American children are overweight or obese, and 63% of teenage girls become overweight by age 11.[20] In 2013 the Organization for Economic Co-operation and Development (OECD) found that 57.6% of all American citizens were overweight or obese. The organization estimated that 3/4 of the American population would likely be overweight or obese by 2020.[21] According to research done by the Harvard T.H. Chan School of Public Health, it is estimated that around 40% of Americans are considered obese, and 18% are considered severely obese as of 2019. Severe obesity is defined as a BMI over 35 in the study. Their projections say that about half of the US population (48.9%) will be considered obese and nearly 1 in 4 (24.2%) will be considered severely obese by 2030.[22][23]
New data in 2024, reveals the U.S. adult obesity rate decreased by about 2% from 2020 to 2023, according to data from the U.S. National Health and Nutrition Examination Survey.[24] Researchers attribute this decline in part to the increasing use of weight loss drugs like Wegovy and Ozempic, now used by 6% of Americans. These medications may be helping to reverse the long-standing rise in obesity rates in the country.
Global obesity compared to the United States
Obesity Rates by Country 2023
A survey in 2007 showed 63% of Americans were overweight or obese, with 26% in the obese category (a BMI of 30 or more). "By 2014, 37.7% of adults in the United States were obese, 35% of men and 40.4% of women (BMI over 40) values were 7.7% for men and 9.9% for women."[26] However, according to world statistics, "American Samoans have the highest BMI (75.6) While Egypt has 43% and Iraq has a BMI of 37.4%."[27] According to the WHO (World Health Organization), obesity has tripled since 1975 and research has shown that obesity is linked to health issues, and high cost of medical care. [27] The Pacific Islands dominate the top obese countries and factors contributed to this problem include dietary change, fast foods, and possible genetic predispositions.[27] The least obese countries include Madagascar, Ethiopia, and Japan. Factors involve a more healthy diet, famine and poverty. WHO and GOO research reports that obesity rates vary by country because of lifestyle, diet and also obesity rates depend on its economic status as well. [27] However, the wealthier the country is, the more educated their citizens tend to be. Promoting a healthier lifestyle is encouraged. The United States being one of the wealthiest countries has the 18th highest obesity rate in the world at 42.7% and researchers attribute that to diet, environment and cultural factors. [27]
According to NHANES data, African American and Mexican American adolescents between 12 and 19 years old are more likely to be overweight than non-Hispanic White adolescents. The prevalence is 21%, 23% and 14% respectively. Also, in a national survey of American Indian children 5–18 years old, 39 percent were found to be overweight or at risk for being overweight.[29] As per national survey data, these trends indicate that by 2030, 86.3% of adults will be overweight or obese and 51.1% obese.[30]
Looking at the long-term consequences, overweight adolescents have a 70 percent chance of becoming overweight or obese adults, which increases to 80 percent if one or both parents are overweight or obese. In 2000, the total cost of obesity for children and adults in the United States was estimated to be US$117billion (US$61billion in direct medical costs). Given existing trends, this amount is projected to range from US$860.7–956.9billion in healthcare costs by 2030.[30]
Food consumption has increased over time. Annual per capita consumption of cheese was 4 pounds (1.8kg) in 1909; 32 pounds (15kg) in 2000; the average person consumed 389 grams (13.7oz) of carbohydrates daily in 1970; 490 grams (17oz) in 2000; 41 pounds (19kg) of fats and oils in 1909; 79 pounds (36kg) in 2000. In 1977, 18% of an average person's food was consumed outside the home; in 1996, this had risen to 32%.[32]
Obesity is a major public health problem in the United States owing to its rapidly increasing prevalence, substantial mortality and morbidity, and growing healthcare costs.[33] Several studies have inquired about the relationship between community food environment and obesity, which are often inversely related.[34] The large-scale study demonstrated a substantial and inverse relationship between the local food environment and adult obesity in the US using local spatially weighted regression. Approximately 23.5 million American live in food deserts, areas in geolocations with minimal healthy food retailers.[35] More importantly, there were considerable regional differences in the strength and direction of this connection.[34] The findings of the study also show the need for geographically specific public health policies and interventions to address issues with food environments that are specific to particular regions.[34]
Contributing factors
Obesity rates of adult females, 1960–2015
Numerous studies have attempted to identify contributing factors for obesity in the United States. Common factors include an overconsumption of food and an insufficient amount of physical exercise. Only 20% of jobs require physical activity.[36]
Related factors that have been attributed to an increase in childhood obesity includes "food deserts." Food deserts are considered urban areas that do not have the stores or access to proper nutritional food required for a sustainably healthy diet. Certain examples of this would include cities, where transportation may be limited, and the only surrounding food available at an affordable price is limited to fast food.[37]Food insecure individuals have turned to food banks, which in turn has led to a rise in obesity and diabetes within the food insecure community. Individuals in lower income areas are dependent on food banks and because of that are not getting foods that are high in nutrients. Food insecure individuals, who live in low-income communities experience higher rates of chronic disease, leading to healthcare costs which create more financial hardships.[38]
Obesity rates of adult males, 1960–2015
Other factors not directly related to caloric intake and activity levels that are believed to contribute to obesity include air conditioning,[39] the ability to delay gratification, and the thickness of the prefrontal cortex of the brain.[40][bettersourceneeded][41] Genetics are also believed to be a factor, with a 2018 study stating that the presence of the human gene APOA2 could result in a higher BMI in individuals.[42] Additionally, factors contributing to the probability of obesity can occur even before birth, including maternal behaviors during gestation such as smoking or significant weight gain.[36]
The microbiome (population of microbes like bacteria, fungi, and viruses) of a person's gastrointestinal tract can additionally contribute to obesity, and is also modified by it. Lean people and obese people have been shown to have differences in their gut bacteria which affect their metabolism.[43][bettersourceneeded]
Causes of obesity
Dietary
In the United States, many people's diets are excessively high in calories, often due to fast food and sugary beverages. Individuals with obesity may consume more calories before feeling full, experience hunger more quickly, or eat in response to stress or anxiety.[1] Per the USDA's Dietary Guidelines for Americans, 2020-2025, most Americans do not follow a healthy dietary pattern.[44] Few individuals being tested for nutrient levels would be able to meet them without the use of fortification or enrichment.[45] Americans eat an abundance of fast food. 36.6% of adults consume fast food on a given day, which is slightly more than 1 out of every 3 people,[46] and 2 out of 3 people consume fast food at least once a week. While the negative effects of fast food, such as lack of nutritional value and high amounts of calories, are widely known, fast food remains popular for its convenience, specifically because it is time-efficient and cheap.[47]
Quantity of food consumption plays an important role as well. A study shows a significant increase in food portion sizes of marketplace products since the 1970s that exceed the federal standards for dietary guidance. Reasons for this increase include the expansion of the food industry since the seventies, marketing strategies, and customer demand.[48] Extreme differences in portion sizes between the same menu items of the same franchises have also been observed. In some instances, American food portion sizes are as much as double the size of their British counterparts.[49]
Physical activity and transportation
"In 2020, 24.2% of adults aged 18 and over met the 2018 Physical Activity Guidelines for Americans for both aerobic and muscle-strengthening activities."[50] This means that more than 75% of citizens did not get enough physical activity that is necessary for their well-being. With the increase in the usage of automobiles in the 20th century, physical activity has become less necessary. As of 2024, 91.7% of households in the US have at least one vehicle.[51] A researcher from the University of Illinois, Sheldon Jacobson, discusses the surge of passenger vehicle usage in relation to the surge of obesity rates between the 1950s and today: "For the last 60-plus years, we've literally built our society around the automobile and getting from point A to point B as quickly as we can. Because we choose to drive rather than walk or cycle, the result is an inactive, sedentary lifestyle. Not coincidentally, obesity also became a public health issue during this period."[52] Since obesity is affected by not only energy intake but also by energy output, the shift to driving has resulted in less physical activity and a higher risk of obesity.
Genetics
The amount of body fat a person retains, and the speed with which his or her body converts food into energy are all influenced by genetics. But how much influence genetics has as a whole had been debated. The involvement of the central nervous system in body weight management is supported by recent advances in obesitygenetics. This happens through the control of long-term energy use and other systems (such as the food reward mechanism), demonstrating that the cause of obesity cannot be limited only to peripherally mediated pathways.[53] The environment, the five senses, stress, emotions, reward, sleep, eating disorders, and information gaps all have an impact on how we eat. [54] McGill University conducted a study on obesity is genetically intertwined with brain structure and mental performance. [55] Through their research, we believe that there is a link between obesity, the brain, and genetics
Effects on life expectancy
The United States' high obesity rate is a major contributor to its relatively lower life expectancy in comparison with other high-income countries.[56] In the US, about 20% of cancer deaths in women and 14% of those in men are due to obesity.[57] It has been suggested that obesity may lead to a halt in the rise in life expectancy observed in the United States during the 19th and 20th centuries.[58][59] In the event that obesity continues to grow in newer generations, a decrease in well-being and life span in the future generations may continue to degenerate. According to Olshansky, obesity diminishes "the length of life of people who are severely obese by an estimated 5 to 20 years."[58] History shows that the number of years lost will continue to grow because the likelihood of obesity in new generations is higher. Children and teens are now experiencing obesity at younger ages. They are eating less healthy and are becoming less active, possibly resulting in less time lived compared to their parents'.[58] The life expectancy for newer generations can expect to be lower due to obesity and the health risks they can experience at a later age.
Obesity has also been shown to increase the prevalence of complications during pregnancy and childbirth. Babies born to obese women are almost three times as likely to die within one month of birth and almost twice as likely to be stillborn than babies born to women of normal weight.[64]
Prevalence
The National Center for Health Statistics estimates that, for 2015–2016 in the U.S., 39.8% of adults aged 20 and over were obese (including 7.6% with severe obesity) and that another 31.8% were overweight.[65] In the NCHS update for 2018, statistics on severe obesity among U.S. adults had already climbed to 9.2% while the total obesity prevalence had reached 42.4%. This also marked the first time in American history that the obesity rates had reached or exceeded 2/5 people in every adult age group.[66]
Obesity rates have increased for all population groups in the United States over the last several decades.[67] Between 1986 and 2000, the prevalence of severe obesity (BMI ≥ 40kg/m2) quadrupled from one in two hundred Americans to one in fifty. Extreme obesity (BMI ≥ 50kg/m2) in adults increased by a factor of five, from one in two thousand to one in four hundred.[68]
Previous studies often show that lower income is associated with higher risk of obesity. The CDC once again provides the statistics, concluding that, "During 2011–2014, the age-adjusted prevalence of obesity among adults was lower in the highest income group (31.2%) than the other groups (40.8% [>130% to ≤350%] and 39.0% [≤130%])."[69]
There have been similar increases seen in children and adolescents, with the prevalence of overweight in pediatric age groups nearly tripling over the same period. Approximately nine million children over six years of age are considered obese. Several recent studies have shown that the rise in obesity in the US is slowing, possibly explained by saturation of health-oriented media.[68]
Race
Rates of obesity in US by race based on 2015–2016 data
Obesity is distributed unevenly across racial groups in the United States.[70]
Many racial minority populations disproportionately reside in low-income neighborhoods that can lack resources such as adequate healthcare, safe recreational areas, and grocery stores offering affordable, nutritious food options such as fresh fruits and vegetables.[71] Furthermore, minority households can be more prone to obesity because of cultural food preferences and family norms.[72] The higher prevalence of obesity among Black women compared to other demographics has been attributed to influence from cultural beauty ideals that tolerate or favor fuller body shapes.[73]
Hispanics have a high genetic susceptibility to obesity, as their Native American ancestors had adapted to a low-calorie diet, which predisposes Hispanics to obesity in the modern world, where high calorie foods are abundant.[74][75]
White Americans
As of 2018, 41.3% of white American men over the age of 20 are obese, while 39% of white women in this age cohort are obese.[76] However, newer data from 2025 suggests that the actual obesify rate for White Americans is around 65%, based on anthropometric measurements alone rather than BMI.[77] This newer study did not segregate Hispanics as a race and includes people identifying as both "White" and "Hispanic".[77]
Black or African American
As of 2023, the obesity rate for Black adults age 20 years and older was 42.9%.[78]
For adult Black men in 2018, the rate of obesity was 31.2%.[78] For adult Black women, the rate of obesity was 44.3%.[78]
American Indian or Alaska Native
The obesity rate for American Indian or Alaska Native adults (over 30 BMI) in the US in 2015 was 42.9%.[79] However, newer research based on waist circumference suggests that the actual rate of obesity among Native Americans is approximately 80%.[77]
Asian
42.7% of Asian Americans were obese or overweight from 2013-2016.[80]
Asian Americans are less likely to be obese than other ethnic groups in the United States, however, their obesity rates are also rising faster.[77]
However, this older data for Asian Americans relies only on the BMI concept. A newer study published in 2025 suggested that the diagnosis of obesity should include direct measurements of the waistline, as well as waist-to-height ratio, to get a truly accurate diagnosis of obesity.[77]
Under this new definition of obesity, 51% of Asian Americans are obese, which represents a 90.3% increase compared to the older, less holistic statistics.[77]
The 2025 study also found that Asian Americans had a distinct metabolic profile that put them at increased risk of obesity-related health problems compared to other groups.[77]
Even before this study was published, previous studies had suggested that the obesity rate among Asian Americans may be underestimated, because it relies on the controversial BMI concept.[81][82] However, Asians have a higher percentage of body fat than white Americans,[83][84] and a lower percentage of muscle mass, a condition Melissa Dahl refers to as "skinny fat".[82] Evidence shows that Asians suffer from diabetes and cardiovascular diseases at a lower BMI than white Americans, which suggests that BMI may not be an accurate indicator of obesity in Asian Americans, and that it is also a poor predictor of Asian American health.[82][85]
Rates of obesity among Asian Americans varied widely by ethnicity, with Filipinos and South Asians having the highest rates of obesity in the Asian American population.[86]
Hispanic or Latino
As of 2018, 80% of Hispanic women (age 20 and over) are overweight or obese, compared to 66% of non-Hispanic white women.[76]
The obesity rate for Hispanic women is 47.1%, while for men, the rate is 44.3%. Hispanic men are 10% more likely to be obese than non-Hispanic white men.[76]
Native Hawaiian or other Pacific Islander
The obesity rate for Native Hawaiian or other Pacific Islander adults (over 30 BMI) in the US in 2015 was 33.4%.[79] No breakdown by sex was given for Native Hawaiian or other Pacific Islander adults in the CDC figures.[79]
Sex
Over 70million adults in U.S. are obese (35million men and 35million women). 99million are overweight (45million women and 54million men).[87] NHANES 2016 statistics showed that about 39.6% of American adults were obese. Men had an age-adjusted rate of 37.9% and Women had an age-adjusted rate of 41.1%.[88]
The CDC provided a data update in May 2017 stating that for adults 20 years and older, the crude obesity rate was 39.8% and the age adjusted rate was measured to be 39.7%. Including the obese, 71.6% of all American adults age 20 and above were overweight.[89][90]
Age
Historically, obesity primarily affected adults, but childhood obesity has grown significantly in recent decades. From the mid-1980s to the mid-2010s, obesity roughly doubled among U.S. children ages 2 to 5 and roughly tripled among young people over the age of 6.[91] Overall, obesity in the United States peaks during the middle aged years. During the period 2015–16, the prevalence of obesity among adults aged 20–39 was 35.7%, among those aged 40–59, 42.8%, and among those 60 and over, 41.0%.[92]
Newborns
This section is empty. You can help by adding to it. (December 2022)
The rise of overweight among children aged 6–19 in the US
From 1980 to 2008, the prevalence of obesity in children aged 6 to 11 years tripled from 6.5% to 19.6%. The prevalence of obesity in teenagers more than tripled from 5% to 18.1% in the same time frame.[93] In less than one generation, the average weight of a child has risen by 5kg in the United States.[94] The CDC has reported that, in 2014, 17.2% of youth aged 2–19 were considered obese and another 16.2% were overweight.[95] Meaning, over one-third of children and teens in the US were overweight or obese. Statistics from a 2016–2017 page on the CDC's official website that 13.9% of toddlers and children age 2–5, 18.4% of children 6–11, and 20.6% of adolescents 12–19 are obese.[90] The prevalence of child obesity in today's society concerns health professionals because a number of these children develop health issues that weren't usually seen until adulthood.[96]
Some of the consequences in childhood and adolescent obesity are psychosocial. Overweight children and overweight adolescents are targeted for social discrimination, and thus, they begin to stress-eat.[97] The psychological stress that a child or adolescent can endure from social stigma can cause low self-esteem which can hinder a child's after school social and athletic capability, especially in plump teenage girls, and could continue into adulthood.[98]
Data from NHANES surveys (1976–1980 and 2003–2006) show that the prevalence of obesity has increased: for children aged 2–5 years, prevalence increased from 5.0% to 12.4%; for those aged 6–11 years, prevalence increased from 6.5% to 19.6%; and for those aged 12–19 years, prevalence increased from 5.0% to 17.6%.[99]
In 2000, approximately 39% of children (ages 6–11) and 17% of adolescents (ages 12–19) were overweight and an additional 15% of children and adolescents were at risk of becoming overweight, based on their BMI.[100]
Analyses of the trends in high BMI for age showed no statistically significant trend over the four time periods (1999–2000, 2001–2002, 2003–2004, and 2005–2006) for either boys or girls. Overall, in 2003–2006, 11.3% of children and adolescents aged 2 through 19 years were at or above the 97th percentile of the 2000 BMI-for-age growth charts, 16.3% were at or above the 95th percentile, and 31.9% were at or above the 85th percentile.[101]
Trend analyses indicate no significant trend between 1999 and 2000 and 2007–2008 except at the highest BMI cut point (BMI for age 97th percentile) among all 6- through 19-year-old boys. In 2007–2008, 9.5% of infants and toddlers were at or above the 95th percentile of the weight-for-recumbent-length growth charts. Among children and adolescents aged 2 through 19 years, 11.9% were at or above the 97th percentile of the BMI-for-age growth charts; 16.9% were at or above the 95th percentile; and 31.7% were at or above the 85th percentile of BMI for age.[102]
In summary, between 2003 and 2006, 11.3% of children and adolescents were obese and 16.3% were overweight. A slight increase was observed in 2007 and 2008 when the recorded data shows that 11.9% of the children between 6 and 19 years old were obese and 16.9% were overweight. The data recorded in the first survey was obtained by measuring 8,165 children over four years and the second was obtained by measuring 3,281 children.
"More than 80 percent of affected children become overweight adults, often with lifelong health problems."[103] Children are not only highly at risk of diabetes, high cholesterol and high blood pressure but obesity also takes a toll on the child's psychological development. Social problems can arise and have a snowball effect, causing low self-esteem which can later develop into eating disorders.
Adults
There are more obese US adults than those who are just overweight.[104] According to a study in The Journal of the American Medical Association (JAMA), in 2008, the obesity rate among adult Americans was estimated at 32.2% for men and 35.5% for women; these rates were roughly confirmed by the CDC again for 2009–2010. A Gallup survey found 41% of U.S. adults, on average, from 2017 to 2021, have characterized themselves as overweight, while the slight majority (53%) have said their weight is about right, and 5% reported they are underweight.[105] Though the rate for women has held steady over the previous decade, the obesity rate for men continued to increase between 1999 and 2008, according to the JAMA study notes.[citation needed] Moreover, "The prevalence of obesity for adults aged 20 to 74 years increased by 7.9 percentage points for men and by 8.9 percentage points for women between 1976–1980 and 1988–1994, and subsequently by 7.1 percentage points for men and by 8.1 percentage points for women between 1988–1994 and 1999–2000."[106][107] According to the CDC, obesity has consistently remained the highest among middle-age adults since 2011. In the most recent update, 44.8% of Americans in their forties and fifties qualified as obese; meanwhile 40% of young adults and 42.4% of older adults were obese.[11][65][66]
Elderly
Although obesity is reported in the elderly, the numbers are still significantly lower than the levels seen in the young adult population. It is speculated that socioeconomic factors may play a role in this age group when it comes to developing obesity.[108] Obesity in the elderly increases healthcare costs.[clarification needed] Nursing homes are not equipped with the proper equipment needed to maintain a safe environment for the obese residents.[citation needed] If a heavy bedridden patient is not turned, the chances of a bed sore increases. If the sore is untreated, the patient will need to be hospitalized and have a wound vac placed.[109]
Prevalence by state and territory
Adult obesity rates in the U.S. by state (2013)
20.2–24.0%
24.0–25.0%
25.0–26.8%
26.8–28.7%
28.7–30.4%
30.4–32.7%
32.7–34.0%
34.0–35.2%
Obesity rates in the U.S. by state (1985–2010)
The following figures were averaged from 2005 to 2007 adult data compiled by the CDC BRFSS program[110] and 2003–2004 child data[A] from the National Survey of Children's Health.[111][112] There is also data from a more recent 2016 CDC study of the 50 states plus the District of Columbia, Puerto Rico, the U.S. Virgin Islands and Guam.[113]
Care should be taken in interpreting these numbers, because they are based on self-report surveys which asked individuals (or, in case of children and adolescents, their parents) to report their height and weight. Height is commonly overreported and weight underreported, sometimes resulting in significantly lower estimates. One study estimated the difference between actual and self-reported obesity as 7% among males and 13% among females as of 2002, with the tendency to increase.[114]
The long-running REGARDS study, published in the journal of Obesity in 2014, brought in individuals from the nine census regions and measured their height and weight. The data collected disagreed with the data in the CDC's phone survey used to create the following chart. REGARDS found that the West North Central region (North Dakota, South Dakota, Minnesota, Missouri, Nebraska, and Iowa), and East North Central region (Illinois, Ohio, Wisconsin, Michigan, and Indiana) were the worst in obesity numbers, not the East South Central region (Tennessee, Mississippi, Alabama, Kentucky) as had been previously thought.[115] Dr. P.H.[clarification needed], professor in the Department of Biostatistics in the UAB School of Public Health George Howard explains that "Asking someone how much they weigh is probably the second worst question behind how much money they make," "From past research, we know that women tend to under-report their weight, and men tend to over-report their height." Howard said as far as equivalency between the self-reported and measured data sets, the East South Central region showed the least misreporting. "This suggests that people from the South come closer to telling the truth than people from other regions, perhaps because there's not the social stigma of being obese in the South as there is in other regions."[116]
The area of the United States with the highest obesity rate is American Samoa (75% obese and 95% overweight).[117]
^Except territories, whose data is from the late 2000s to 2010s
Total costs to the US
Obesity has been cited as a contributing factor to approximately 100,000–400,000 deaths in the United States per year[67] (including increased morbidity in car accidents)[126] and has increased health care use and expenditures,[61][127][128][129] costing society an estimated $117billion in direct (preventive, diagnostic, and treatment services related to weight) and indirect (absenteeism, loss of future earnings due to premature death) costs.[130] This exceeds health-care costs associated with smoking or problem drinking[129] and, by one estimate, accounts for 6% to 12% of national health care expenditures in the United States[131] (although another estimate states the figure is between 5% and 10%).[132]
The Medicare and Medicaid programs bear about half of this cost.[129] Annual hospital costs for treating obesity-related diseases in children rose threefold, from US$35million to US$127million, in the period from 1979 to 1999,[133] and the inpatient and ambulatory healthcare costs increased drastically by US$395 per person per year.[128]
These trends in healthcare costs associated with pediatric obesity and its comorbidities are staggering, urging the Surgeon General to predict that preventable morbidity and mortality associated with obesity may surpass those associated with cigarette smoking.[127][134] Furthermore, the probability of childhood obesity persisting into adulthood is estimated to increase from approximately twenty percent at four years of age to approximately eighty percent by adolescence,[135] and it is likely that these obesity comorbidities will persist into adulthood.[136]
In the military
An estimated 16% percent of active duty U.S. military personnel were obese in 2004, with the cost of remedial bariatric surgery for the military reaching US$15million in 2002. Obesity is currently the largest single cause for the discharge of uniformed personnel.[137] A financial analysis published in 2007 further showed that the treatment of diseases and disorders associated with obesity costs the military $1.1billion annually. Moreover, the analysis found that the increased absenteeism of obese or overweight personnel amounted to a further 658,000 work days lost per year. This lost productivity is higher than the productivity loss in the military due to high alcohol consumption which was found to be 548,000 work days. Problems associated with obesity further manifested itself in early discharge due to inability to meet weight standards. Approximately 1200 military enlistees were discharged due to this reason in 2006.[138]
The rise in obesity has led to fewer citizens able to join the military and therefore more difficulty in recruitment for the armed forces. In 2005, 9million adults aged 17 to 24, or 27%, were too overweight to be considered for service in the military.[139] For comparison, just 6% of military aged men in 1960 would have exceeded the current weight standards of the U.S. military. Excess weight is the most common reason for medical disqualification and accounts for the rejection of 23.3% of all recruits to the military. Of those who failed to meet weight qualifications but still entered the military, 80% left the military before completing their first term of enlistment.[140] In light of these developments, organizations such as Mission: Readiness, made up of retired generals and admirals, have advocated for focusing on childhood health education to combat obesity's effect on the military.[141]
Accommodations
[142] Along with obesity came the accommodations made of American products. Child-safety seats in 2006 became modified for the 250,000 obese U.S. children ages six and below.[143] The obese incur extra costs for themselves and airlines when flying. Weight is a major component to the formula that goes into the planes take off and for it to successfully fly to the desired destination. Due to the weight limits taken in consideration for flight in 2000, airlines spent $275million on 350million additional gallons of fuel for compensation of additional weight to travel.[143] Accommodations have also been made in work place environments for workers, including those such as chairs with no armrests and access to work outside of the office.[144] Occupational safety may require accommodations such as wider, more robust office chairs that allow for safe and comfortable working.[citation needed]
Trends in obesity prevalence show no increase among youth since 2003–2004, but trends do show increases in both adults and youth from 1999 to 2000 through 2013–2014. No significant differences between 2011 and 2012 and 2013–2014 were seen in either youth or adults.[145]
Under pressure from parents and anti-obesity advocates, many school districts moved to ban sodas, junk foods, and candy from vending machines and cafeterias.[146] State legislators in California, for example, passed laws banning the sale of machine-dispensed snacks and drinks in elementary schools in 2003, despite objections by the California-Nevada Soft Drink Association. The state followed more recently with legislation to prohibit their soda sales in high schools starting July 1, 2009, with the shortfall in school revenue to be compensated by an increase in funding for school lunch programs.[147] A similar law passed by the Connecticut General Assembly in June 2005 was vetoed by governorJodi Rell, who stated the legislation "undermines the control and responsibility of parents with school-aged children."[148]
In mid-2006, the American Beverage Association (including Cadbury, Coca-Cola, and PepsiCo) agreed to a voluntary ban on the sale of all high-calorie drinks and all beverages in containers larger than 8, 10 and 12 ounces in elementary, middle and high schools, respectively.[149][150]
There have been many strategies to try to control obesity issues. One cost-effective population-level change is taxes on sugary drinks. Interventions such as taxes can be a powerful way to improve the economic landscape of the food environment. According to Circulation, "Beverages with added sugar are a prime candidate for taxation; they constitute >10% of caloric intake nationwide and provide little or no nutritional value." Weight gain is due to consumption of these sugary drinks along with other health issues such as diabetes, hypertension, and more.
A penny-per-ounce tax on sugary drinks would raise the shelf price of these drinks by around 20%. Many studies have been done and it has shown that there has been a 14% to 20% reduction in the consumption of these taxed drinks. People's weight will determine if they choose healthier options or not to replace these sugary beverages. This interest of taxes on drinks has been gaining popularity across the U.S. According to Circulation, "They were considered as a measure at the federal level to fund healthcare reform in 2009 and were proposed in 11 states and 2 major cities in the 2009 to 2010 legislative cycle." There has been some resistance from the beverage industry. Policymakers are increasingly considering the beverage industry to promote public health.
Non-profit organizations such as HealthCorps work to educate people on healthy eating and advocate for healthy food choices in an effort to combat obesity.[151]
Former American First LadyMichelle Obama led an initiative to combat childhood obesity entitled "Let's Move!". Obama said she aimed to wipe out obesity "in a generation". Let's Move! has partnered with other programs.[152] Walking and bicycling to school helps children increase their physical activity.[28]
In 2005 MeMe Roth began an obesity campaign that led to several appearances in American mainstream media.
Programs such as Eat Smart, Move More, Weigh Less, developed in 2007 by writing teams from North Carolina State University and North Carolina Division of Public Health, and now available beyond North Carolina, aim to combat obesity by a combination of healthy eating and increased exercise.[153]
In 2008, the state of Pennsylvania enacted a law, the "School Nutrition Policy Initiative," aimed at the elementary level. These "interventions included removing all sodas, sweetened drinks, and unhealthy snack foods from selected schools, 'social marketing' to encourage the consumption of nutritious foods and outreach to parents."[154] The results were a "50 percent drop in incidence of obesity and overweight", as opposed to those individuals who were not part of the study.[154]
In the past decade, there have been school-based programs that target the prevention and management of childhood obesity. There is evidence that long term school-based programs have been effective in reducing the prevalence of childhood obesity.[155]
For two years, Duke University psychology and global health professor Gary Bennett and eight colleagues followed 365 obese patients who had already developed hypertension. They found that regular medical feedback, self-monitoring, and a set of personalized goals can help obese patients in a primary care setting lose weight and keep it off.[156]
Major U.S. manufacturers of processed food, aware of the possible contribution of their products to the obesity epidemic, met together and discussed the problem as early as April 8, 1999; however, a proactive strategy was considered and rejected. As a general rule, optimizing the amount of salt, sugar and fat in a product will improve its palatability, and profitability. Reducing salt, sugar and fat, for the purpose of public health, had the potential to decrease palatability and profitability.[157]
Media influence may play an important role in prevention of obesity as it has the ability to boost many of the main prevention/intervention methods used nowadays including lifestyle modification. The media is also highly influential on children and teenagers as it promotes healthy body image and sets societal goals for lifestyle improvement. Examples of media influence are support for the "Let's Move!" campaign and the MyPlate program initiated by Michelle Obama, and the NFL's Play60 campaign. These campaigns promote physical activity in an effort to reduce obesity especially for children.[158]
In 2011, the Obama administration introduced a $400million Healthy Food Financing Initiative, the goal of the program is to "create jobs and economic development, and establish market opportunities for farmers and ranchers," as described by the secretary of agriculture, Tom Vilsack.[159]
Population-based approaches have been recommended and pursued in the U.S. Obesity is complex because it affects multiple environments, involves multiple industries and sectors, and affects both energy intake and expenditure. Federal level policies include Healthy, Hunger-Free Kids Act, the Supplemental Nutrition Assistance Program Education program, and Safe Routes to School funding. (PMC) The Healthy, Hunger-Free Kids Act of 2010 helped provide nutrition standards for meals and drinks through a variety of programs affecting 50 million children daily at 99,000 schools. The risk of obesity declines each year for children in poverty. The results suggest that the Healthy, Hunger-Free Kids Act's science-based nutritional standards should be maintained to support healthy growth, especially among children living in poverty, according to Health Affairs.
The Supplemental Nutrition Assistance Program Education program (SNAP-Ed) is an approach that helps people be healthy and active. This program teaches people how to manage their SNAP dollars, how to shop and cook for healthy food, and how to stay active. They partner with state and local organizations to meet people where they are located. Some of their efforts include nutrition education classes, policy improvement, social media campaigns, and more. SNAP-Ed directly and sustainably improves food security either with or without food assistance. Nutrition education is critical to improving food security in the U.S. low-income population.
Safe Routes to School is an initiative that makes it safe and convenient for children to walk and bicycle to and from school. The goal is to get more children to improve kids' safety, increase their health and physical activity, and to get more children walking and bicycling to school. Studies show that Safe Routes to School programs are effective at increasing rates of bicycling and walking to school and decreasing injuries (Safe Routes Partnership).
According to authors from the state of childhood obesity, their focus was on a few programs and policies regarding children. The Child and Adult Food Care Program (CACFP) provides federal funding to many states to reimburse providers for the cost of providing healthy meals to children and adults in their care. Around 4.3 million children and 130,000 adults partake in this program each year. Providers are required to meet the minimum nutrition standards to receive reimbursement. Some of their nutrition requirements are more whole grains, a wider variety of fruits and vegetables, free added sugars, and less saturated fat. The goal is to increase children's intake of these healthy foods, reduce their consumption of grain-based desserts, and improve their overall health. Research has been done on this program and it has been found that participation in CACFP moderately increases the consumption of milk and vegetables among children, and it helps regulate their weight.
Another early childhood education program that helps prepare children for school by providing education, health, and social services is Head Start. This program reaches over one million children who have family economic trouble each year. Early Head Start serves children aged three and under and pregnant women. Head Start and Early Head Start programs participate in either CATFP or the federal school meals programs. Research shows that children who participate in Head Start are more likely to eat better than children who don't participate in this program.
Solutions to worldwide obesity problems require unique approaches that include lifestyle changes, health policies, advancements of healthcare, involvement of parents and concerned citizens and education to prevent this problem from escalating. Several school districts have banned sodas, junk foods and candy from vending machines and cafeterias. [160] Programs have been formed to help improve this health crisis such as, Lets Move, Eat Smart, Move More, Weigh Less, and Weight Watchers are just a few that have helped people lose weight. Some towns have initiatives that are safe routes for children to walk or ride their bikes. This program is called "Safe Routes to School".[161] Educational programs such as Head Start have been created to offer federal funded school meals to children. This was one way of teaching children about healthy choices and good nutrition. Also, to help reduce obesity, the federal and local governments in the United States have asked food and beverage industries to label all foods and drinks. These labels help consumers be more conscious about the foods and drinks they are buying.
Food labeling
Ultimately, federal and local governments in the U.S. are willing to create political solutions that will reduce obesity ratings by "recommending nutrition education, encouraging exercise, and asking the food and beverage industry to promote healthy practices voluntarily."[154] In 2008, New York City was the first city to pass a "labeling bill" that "require[d] restaurants" in several cities and states to "post the caloric content of all regular menu items, in a prominent place and using the same font and format as the price."[154]
Furthermore, adding better labels to food and drink products can help to improve diets. According to a 2021 study, proper labeling on the front side of products has been proven to reduce the amount of unhealthy food purchased. On the other hand, there has been an increase in purchases of healthier products. These labels help consumers to be more health conscious about the food they are buying.[162]
Many states have started to adopt policies allowing only healthier drinks such as milk and water. In general, the Affordable Care Act (ACA) started to require chain restaurants to post calorie information on their menus, menu boards, and to provide additional nutrition information such as saturated fat and added sugars to customers upon request. The Food and Drug Administration's rules that enforce this provision took effect in 2018. It has applied to supermarkets, convenience stores, delis, movie theaters, and stadiums. Retails with fewer than 20 locations don't have to abide by these rules. It has been shown that benefits of this calorie labeling has increased awareness of and a reduction in calories purchased. Also, it has shown to reduce calorie intake and reduce portion sizes. A net savings total of $8 billion over 20 years will be saved by the menu labeling policy, according to an FDA regulatory impact analysis.
↑[niddk.noh.gov/health-information/health-statisticz/overweight-obesity "National institute of diabetes and digestive and kidney disease"]. National institute of diabetes.{{cite web}}: Check |url= value (help)
12Wang Y, Beydoun MA, Liang L, Caballero B, Kumanyika SK (October 2008). "Will all Americans become overweight or obese? estimating the progression and cost of the US obesity epidemic". Obesity. 16 (10): 2323–30. doi:10.1038/oby.2008.351. PMID18719634. S2CID40159882.
↑Cerceo, Elizabeth & Sharma, Elena & Boguslavsky, Anne & Rachoin, Jean-Sebastien. (2023). Impact of Food Environments on Obesity Rates: A State-Level Analysis. Journal of Obesity. 2023. 1-7. 10.1155/2023/5052613.
↑Fulgoni, Victor & Keast, Debra & Bailey, Regan & Dwyer, Johanna. (2011). Foods, Fortificants, and Supplements: Where Do Americans Get Their Nutrients? The Journal of Nutrition. 141. 1847-54. 10.3945/jn.111.142257.
↑Wulan, S. N.; Westerterp, K. R.; Plasqui, G. (April 2010). "Ethnic differences in body composition and the associated metabolic profile: a comparative study between Asians and Caucasians". Maturitas. 65 (4): 315–319. doi:10.1016/j.maturitas.2009.12.012. ISSN1873-4111. PMID20079586.
↑Wang, J.; Thornton, J. C.; Russell, M.; Burastero, S.; Heymsfield, S.; Pierson, R. N. (July 1994). "Asians have lower body mass index (BMI) but higher percent body fat than do whites: comparisons of anthropometric measurements". The American Journal of Clinical Nutrition. 60 (1): 23–28. doi:10.1093/ajcn/60.1.23. ISSN0002-9165. PMID8017333.
123Finkelstein EA, Fiebelkorn IC, Wang G (2003). "National Medical Spending Attributable To Overweight And Obesity: How Much, And Who's Paying?". Health Affairs. 3 (1): 219–226. doi:10.1377/hlthaff.w3.219. PMID14527256. S2CID7620808.
↑Dall TM, Zhang Y, Chen YJ, Wagner RC, Hogan PF, Fagan NK, etal. (November 2007). "Cost associated with being overweight and with obesity, high alcohol consumption, and tobacco use within the military health system's TRICARE prime-enrolled population". American Journal of Health Promotion. 22 (2): 120–139. doi:10.4278/0890-1171-22.2.120. PMID18019889. S2CID46775056.
↑Gonzalez-Suarez C, Worley A, Grimmer-Somers K, Dones V (November 2009). "School-based interventions on childhood obesity: a meta-analysis". American Journal of Preventive Medicine. 37 (5): 418–27. doi:10.1016/j.amepre.2009.07.012. PMID19840696.
This page is based on this Wikipedia article Text is available under the CC BY-SA 4.0 license; additional terms may apply. Images, videos and audio are available under their respective licenses.