List of United States congressional districts Last updated January 20, 2026
U.S. congressional districts of the 119th Congress (2025–2027) with territoriesInteractive map version Change in apportionment of congressional districts , starting in 2023, as a result of the 2020 United States census Congressional districts in the United States are electoral divisions for the purpose of electing members of the United States House of Representatives . The number of voting seats within the House of Representatives is currently set at 435, with each one representing an average of 761,169 people following the 2020 United States census . [ 1] The number of voting seats has applied since 1913, excluding a temporary increase to 437 after the admissions of Alaska and Hawaii . The total number of state members is capped by the Reapportionment Act of 1929 . [ 2] In addition, each of the five inhabited U.S. territories and the federal district of Washington, D.C. , sends a non-voting delegate to the House of Representatives.
The Bureau of the Census conducts a constitutionally mandated decennial census whose figures are used to determine the number of congressional districts to which each state is entitled, in a process called "apportionment ". The 2022 elections were the first to be based on the congressional districts which were defined based on the 2020 United States census . [ 3]
Each state is responsible for the redistricting of districts within their state, while several states have one "at-large" division (Alaska , Delaware , North Dakota , South Dakota , Vermont , and Wyoming ). Redistricting must take place if the number of members changes following a re-apportionment, or may take place at any other time if demographics represented in a district have changed substantially. Setting the boundaries of states' congressional districts is the responsibility of state governments, who often gerrymander districts for various reasons. Districts may sometimes retain the same boundaries, while changing their district numbers.
Each congressional district is expected to be equal in population to all other congressional districts in a state. [ 4] The boundaries and numbers shown for the congressional districts are established by their respective state's constitution or court orders in the apportionment and redistricting cycle. [ 5]
Delimitation Many other nations assign independent bodies to oversee and mandate the delimitation of boundaries; however, in some nations the legislature manages this process. In the United States, legislatures play a commanding role in the redistricting (as delimitation is referred to in the United States) of congressional districts. The redrawing of boundaries occurs after the decennial census ; single-member constituencies are responsible for the election of the legislators that govern this process. [ 6] In 25 states the state legislature is responsible for creating the redistricting plan, but six states (Alaska, Delaware, North Dakota, South Dakota, Vermont and Wyoming) do not require redistricting for the House of Representatives and instead elect a single representative for the entire state. [ 7] Each state has its own constitution and laws surrounding the redistricting process, and most of the modern criteria applied federally have come about through rulings by the U.S. Supreme Court. [ 8]
Prior to 1962, there was limited federal and state government regulation on redistricting, and these were rarely enforced. However, after the Baker v. Carr (1962) decision redistricting became justiciable and courts became an active participant in the redistricting process of congressional districts as the decision allowed voters to challenge redistricting plans. [ 9] Since Shaw v. Reno (1993) and Abrams v. Johnson (1997), the courts have invalidated numerous congressional redistricting plans upon the basis of traditional districting principles. These decisions have been surrounded in controversy as the Supreme Court has not identified these 'traditional' criteria explicitly, resulting in the major political parties attempting to abuse the lack of legislation and definition to advantage their respective parties. [ 10] According to the database of redistricting laws in all fifty states and previous court decisions, the de facto principles are: compactness, contiguity, equal population, and preserving county and city boundaries. [ 11]
Extremes Population Average population: 761,169 people based on 2020 U.S. census. [ 1] It was 708,377 in 2010. State with the most people in the average district: Delaware (989,948). [ 1] In 2010, Montana: 994,416. State with the fewest people in the average district: Montana (542,113). [ 1] In 2010, Rhode Island : 527,624. District with the most people: Delaware at-large (989,948). [ 1] In 2010, Montana at-large : 994,416. District with the fewest people: Rhode Island's 1st (545,085). [ 12] In 2010, also Rhode Island's 1st : 526,283. Cook Partisan Voting Index List of districts by area and population The following is a complete list of the 435 current congressional districts for the House of Representatives, and over 200[ specify ] 119th United States Congress , effective from 2025 to 2027. [ 13]
Rank District Land area2 ) Land area2 ) Populationestimate [ 14]
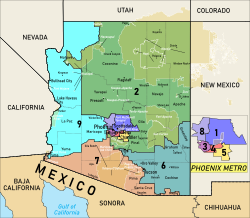
1 Alaska at-large 571,241.61 1,479,508.97 740,133 2 Montana 2 105,382.55 272,939.56 558,158 3 Wyoming at-large 97,088.55 251,458.19 587,618 4 South Dakota at-large 75,807.94 196,341.67 924,669 5 Oregon 2 72,158.83 186,890.52 704,768 6 Nebraska 3 69,613.74 180,298.76 649,934 7 North Dakota at-large 68,994.26 178,694.32 796,568 8 Nevada 2 65,065.49 168,518.85 802,677 9 Texas 23 58,788.47 152,261.44 806,011 10 Arizona 2 58,353.74 151,135.50 853,923 11 New Mexico 3 52,316.48 135,499.06 708,684 12 New Mexico 2 51,426.16 133,193.13 710,491 13 Colorado 3 49,950.41 129,370.97 742,698 14 Kansas 1 49,634.61 128,553.04 731,386 15 Idaho 2 43,245.56 112,005.50 967,957 16 Nevada 4 41,790.41 108,236.67 833,125 17 Montana 1 40,167.69 104,033.84 579,075 18 Idaho 1 39,399.80 102,045.01 1,033,662 19 Utah 2 39,218.27 101,574.85 880,783 20 Texas 13 35,104.57 90,920.42 799,858 21 Oklahoma 3 32,613.10 84,467.53 797,016 22 Colorado 4 32,138.01 83,237.06 789,599 23 Minnesota 8 31,239.65 80,910.32 727,411 24 Minnesota 7 31,039.41 80,391.69 722,392 25 Texas 19 30,169.59 78,138.89 787,118 26 Utah 3 28,715.22 74,372.07 830,117 27 Maine 2 27,548.04 71,349.09 697,280 28 Michigan 1 26,920.07 69,722.66 787,617 29 California 1 26,393.41 68,358.62 759,259 30 Arizona 9 23,229.33 60,163.69 915,903 31 Wisconsin 7 23,110.54 59,856.02 754,076 32 Arkansas 4 22,676.60 58,732.14 744,382 33 California 3 21,666.74 56,116.60 807,351 34 Oklahoma 2 21,630.58 56,022.95 815,354 35 Iowa 4 21,433.05 55,511.35 801,546 36 Missouri 6 20,254.59 52,459.15 788,896 37 Arkansas 1 19,849.09 51,408.90 754,656 38 Texas 11 19,205.73 49,742.61 802,030 39 Washington 5 18,711.90 48,463.59 801,690 40 Missouri 8 18,315.28 47,436.36 776,269 41 Mississippi 2 17,996.03 46,609.52 694,703 42 California 23 17,966.66 46,533.43 758,179 43 Washington 4 17,885.49 46,323.19 794,949 44 New Mexico 1 17,570.09 45,506.33 711,081 45 Illinois 15 16,752.80 43,389.55 739,197 46 New York 21 16,288.85 42,187.94 767,674 47 Arizona 7 15,417.65 39,931.54 813,289 48 Kansas 2 15,298.46 39,622.83 739,248 49 Louisiana 4 14,603.32 37,822.42 767,466 50 Kansas 4 14,563.96 37,720.49 745,885 51 Missouri 4 14,355.14 37,179.63 784,156 52 West Virginia 1 14,340.14 37,140.79 861,893 53 Illinois 12 14,015.96 36,301.17 745,901 54 Arizona 6 13,691.88 35,461.79 833,838 55 California 2 13,038.54 33,769.65 752,654 56 Pennsylvania 15 12,982.18 33,623.68 758,111 57 Iowa 2 12,902.70 33,417.83 797,329 58 Minnesota 1 12,238.15 31,696.67 718,116 59 California 25 11,955.87 30,965.57 792,416 60 Kentucky 5 11,748.97 30,429.69 736,508 61 Mississippi 3 11,722.42 30,360.94 734,735 62 Oregon 4 11,613.07 30,077.72 712,690 63 Kentucky 1 11,499.40 29,783.31 759,138 64 Colorado 2 11,445.07 29,642.60 728,333 65 Texas 28 11,357.29 29,415.25 825,116 66 Wisconsin 3 11,227.74 29,079.72 740,873 67 Georgia 8 10,928.22 28,303.96 787,897 68 Iowa 1 10,844.57 28,087.31 804,704 69 Iowa 3 10,673.35 27,643.86 837,909 70 Louisiana 5 10,456.54 27,082.31 763,961 71 Texas 17 10,437.15 27,032.09 798,340 72 Texas 27 10,428.06 27,008.56 793,985 73 Alabama 7 10,274.64 26,611.19 718,912 74 Utah 1 10,271.32 26,602.61 871,848 75 Virginia 9 10,070.55 26,082.60 782,270 76 Georgia 2 9,953.18 25,778.63 757,227 77 Mississippi 1 9,942.04 25,749.77 753,783 78 Florida 2 9,853.83 25,521.31 819,004 79 Washington 8 9,827.75 25,453.76 794,910 80 California 5 9,807.72 25,401.89 772,810 81 Oklahoma 4 9,733.71 25,210.18 819,271 82 Michigan 2 9,704.77 25,135.24 788,872 83 West Virginia 2 9,701.10 25,125.73 908,086 84 California 20 9,672.81 25,052.46 816,324 85 Georgia 12 9,632.95 24,949.22 786,415 86 Alabama 2 9,465.03 24,514.32 703,362 87 Texas 1 9,464.63 24,513.29 795,955 88 Virginia 5 9,464.11 24,511.93 805,334 89 Tennessee 8 9,226.41 23,896.29 774,995 90 Vermont at-large 9,217.26 23,872.59 648,493 91 Texas 25 8,994.96 23,296.84 826,421 92 Illinois 16 8,914.43 23,088.27 752,764 93 Alabama 4 8,630.11 22,351.89 735,310 94 North Carolina 1 8,342.08 21,605.90 753,478 95 New York 19 8,225.38 21,303.64 776,282 96 Indiana 8 8,096.08 20,968.75 758,402 97 Texas 10 7,667.75 19,859.38 832,921 98 Louisiana 3 7,625.36 19,749.60 777,847 99 Missouri 3 7,584.79 19,644.52 799,877 100 Ohio 2 7,383.46 19,123.06 790,454 101 Georgia 1 7,360.10 19,062.57 806,580 102 Florida 3 7,321.91 18,963.66 845,635 103 Washington 3 7,309.49 18,931.50 802,855 104 Kentucky 2 7,291.99 18,886.16 775,395 105 Mississippi 4 7,264.08 18,813.89 759,824 106 Alabama 1 7,240.75 18,753.46 760,389 107 Colorado 7 7,161.21 18,547.45 728,241 108 New York 24 7,088.57 18,359.31 772,889 109 Washington 6 6,956.61 18,017.54 799,758 110 South Carolina 6 6,926.08 17,938.45 762,934 111 North Carolina 3 6,850.07 17,741.59 775,182 112 New Hampshire 2 6,810.15 17,638.22 700,189 113 Alabama 3 6,690.22 17,327.58 737,665 114 Wisconsin 8 6,680.87 17,303.37 747,225 115 Tennessee 4 6,473.25 16,765.63 826,508 116 New York 23 6,458.25 16,726.78 773,707 117 Florida 18 6,449.60 16,704.38 875,428 118 Pennsylvania 13 6,362.38 16,478.49 769,505 119 Texas 21 6,297.31 16,309.95 846,025 120 California 13 6,292.60 16,297.75 790,923 121 Virginia 6 6,264.60 16,225.23 797,837 122 North Carolina 11 6,242.65 16,168.40 770,851 123 Texas 15 6,230.46 16,136.81 812,527 124 Hawaii 2 6,219.49 16,108.40 727,086 125 Indiana 4 6,096.60 15,790.13 789,018 126 Pennsylvania 9 6,073.27 15,729.69 770,915 127 Indiana 9 6,037.01 15,635.78 764,291 128 Nebraska 1 5,982.30 15,494.09 672,915 129 Texas 36 5,944.78 15,396.91 816,162 130 Tennessee 6 5,919.07 15,330.32 803,181 131 Tennessee 7 5,891.32 15,258.45 816,216 132 Texas 6 5,858.52 15,173.49 848,575 133 Missouri 7 5,775.52 14,958.52 803,037 134 South Carolina 3 5,633.91 14,591.76 766,747 135 Texas 31 5,612.90 14,537.36 901,458 136 Oregon 5 5,591.62 14,482.23 717,312 137 Ohio 12 5,580.81 14,454.22 812,727 138 Ohio 5 5,528.22 14,318.02 796,997 139 South Carolina 7 5,407.67 14,005.81 794,163 140 Arkansas 2 5,301.54 13,730.93 773,214 141 Michigan 5 5,233.18 13,553.87 775,260 142 Georgia 10 5,204.81 13,480.39 835,755 143 Texas 4 5,201.82 13,472.66 874,662 144 South Carolina 5 5,160.49 13,365.62 782,718 145 Wisconsin 6 5,030.60 13,029.20 743,039 146 California 24 4,886.14 12,655.03 756,496 147 Ohio 4 4,879.90 12,638.89 810,105 148 Louisiana 6 4,869.79 12,612.70 753,643 149 Kentucky 4 4,844.51 12,547.21 776,082 150 North Carolina 7 4,841.79 12,540.17 805,748 151 Ohio 6 4,779.15 12,377.95 775,304 152 Pennsylvania 14 4,774.73 12,366.50 752,379 153 Michigan 9 4,638.21 12,012.91 782,471 154 California 18 4,572.91 11,843.79 766,286 155 Illinois 17 4,481.92 11,608.12 743,507 156 Alabama 6 4,448.50 11,521.57 728,184 157 Washington 2 4,404.09 11,406.54 789,531 158 Utah 4 4,390.89 11,372.35 920,865 159 Indiana 3 4,390.44 11,371.18 774,688 160 Tennessee 1 4,354.28 11,277.53 797,902 161 Indiana 2 4,349.54 11,265.25 751,821 162 California 22 4,313.07 11,170.80 770,684 163 Wisconsin 2 4,300.90 11,139.29 763,361 164 North Carolina 5 4,201.04 10,880.63 755,224 165 Georgia 3 4,166.22 10,790.46 799,818 166 Arkansas 3 4,164.71 10,786.55 816,102 167 Texas 34 4,121.86 10,675.56 796,178 168 Tennessee 3 3,956.32 10,246.81 809,872 169 Illinois 2 3,916.79 10,144.45 732,352 170 Alabama 5 3,901.77 10,105.55 773,877 171 Maryland 1 3,866.41 10,013.95 791,864 172 Pennsylvania 16 3,840.90 9,947.90 758,988 173 Kentucky 6 3,792.81 9,823.32 777,299 174 California 4 3,780.05 9,790.27 760,875 175 North Carolina 8 3,725.02 9,647.75 788,892 176 North Carolina 13 3,715.91 9,624.17 835,054 177 Louisiana 1 3,652.62 9,460.24 798,569 178 California 48 3,614.69 9,362.01 768,439 179 Texas 5 3,597.13 9,316.51 856,312 180 Oklahoma 5 3,540.68 9,170.31 836,356 181 Virginia 4 3,427.39 8,876.91 810,465 182 Florida 6 3,410.11 8,832.15 834,806 183 Georgia 9 3,405.52 8,820.25 828,902 184 Oregon 1 3,351.98 8,681.58 716,626 185 Maine 1 3,297.05 8,539.31 707,732 186 Indiana 6 3,282.32 8,501.18 777,157 187 North Carolina 9 3,254.05 8,427.95 790,294 188 Florida 1 3,197.64 8,281.85 817,541 189 Texas 22 3,156.50 8,175.31 894,683 190 South Carolina 2 3,113.05 8,062.76 764,414 191 Virginia 1 3,039.12 7,871.28 823,798 192 Georgia 14 2,942.34 7,620.62 795,580 193 Texas 8 2,848.23 7,376.88 946,825 194 California 19 2,816.56 7,294.86 741,135 195 Pennsylvania 8 2,769.36 7,172.61 773,187 196 Michigan 7 2,766.00 7,163.91 792,585 197 Virginia 7 2,723.77 7,054.54 825,445 198 South Carolina 1 2,589.15 6,705.86 797,468 199 Ohio 9 2,588.55 6,704.30 776,236 200 Tennessee 2 2,576.12 6,672.13 813,928 201 Minnesota 6 2,484.44 6,434.68 755,084 202 Texas 14 2,450.81 6,347.56 787,873 203 Ohio 14 2,432.65 6,300.55 785,649 204 New York 22 2,421.90 6,272.69 765,288 205 Maryland 6 2,395.10 6,203.29 821,685 206 Michigan 4 2,386.19 6,180.21 785,367 207 Florida 26 2,300.65 5,958.66 851,047 208 Illinois 13 2,264.31 5,864.53 741,808 209 Kansas 3 2,261.58 5,857.46 754,087 210 Massachusetts 1 2,233.36 5,784.38 779,993 211 Michigan 8 2,230.81 5,777.78 769,318 212 Indiana 5 2,194.78 5,684.44 791,265 213 North Carolina 14 2,192.36 5,678.18 792,862 214 Florida 28 2,184.62 5,658.15 791,591 215 Florida 20 2,151.66 5,572.78 818,131 216 Virginia 2 2,150.83 5,570.62 788,048 217 New Hampshire 1 2,143.64 5,551.99 708,843 218 Wisconsin 5 2,143.50 5,551.64 750,363 219 Tennessee 5 2,059.04 5,332.90 835,216 220 Connecticut 2 2,021.15 5,234.75 731,305 221 Louisiana 2 2,005.26 5,193.59 736,254 222 Nevada 3 2,004.83 5,192.50 839,433 223 New Jersey 2 1,994.30 5,165.22 794,193 224 Illinois 14 1,974.93 5,115.05 766,577 225 Texas 26 1,965.74 5,091.24 884,703 226 Delaware at-large 1,948.54 5,046.69 1,051,917 227 Ohio 15 1,925.67 4,987.47 823,011 228 Oregon 6 1,895.03 4,908.11 720,968 229 North Carolina 10 1,871.94 4,848.30 787,565 230 New York 18 1,862.87 4,824.80 791,202 231 Ohio 8 1,792.67 4,642.98 791,238 232 Missouri 2 1,790.83 4,638.24 773,921 233 Massachusetts 2 1,783.82 4,620.06 801,772 234 Florida 4 1,782.00 4,615.36 842,213 235 Minnesota 2 1,727.80 4,474.97 746,020 236 California 26 1,714.89 4,441.53 751,974 237 Virginia 10 1,690.49 4,378.36 821,178 238 North Carolina 6 1,652.02 4,278.70 794,243 239 Florida 12 1,650.67 4,275.21 871,072 240 Florida 9 1,650.42 4,274.56 909,540 241 Florida 8 1,640.02 4,247.63 831,434 242 Florida 11 1,600.09 4,144.21 893,440 243 Arizona 1 1,597.51 4,137.52 819,479 244 Wisconsin 1 1,533.90 3,972.78 739,693 245 Maryland 5 1,516.81 3,928.53 805,367 246 California 27 1,516.11 3,926.71 748,971 247 Florida 21 1,506.29 3,901.27 859,087 248 Pennsylvania 11 1,501.23 3,888.18 781,923 249 Georgia 11 1,475.93 3,822.63 811,695 250 Colorado 5 1,471.80 3,811.94 745,409 251 Florida 17 1,453.66 3,764.95 877,095 252 Texas 3 1,435.72 3,718.50 920,628 253 Oregon 3 1,386.21 3,590.26 700,007 254 New York 20 1,366.03 3,538.01 790,733 255 New Jersey 7 1,347.62 3,490.31 789,429 256 California 9 1,346.85 3,488.34 784,710 257 California 41 1,327.17 3,437.35 824,187 258 Ohio 7 1,320.78 3,420.81 789,433 259 Massachusetts 9 1,255.16 3,250.84 797,381 260 Pennsylvania 10 1,254.75 3,249.79 792,599 261 Connecticut 5 1,246.13 3,227.45 728,034 262 South Carolina 4 1,233.75 3,195.40 810,387 263 Nebraska 2 1,218.96 3,157.10 682,617 264 Pennsylvania 7 1,167.73 3,024.40 788,445 265 Florida 16 1,154.48 2,990.09 882,786 266 Indiana 1 1,102.37 2,855.12 760,512 267 Georgia 7 1,101.44 2,852.73 815,698 268 New Jersey 3 1,080.77 2,799.19 795,627 269 Oklahoma 1 1,078.63 2,793.65 827,396 270 North Carolina 4 1,052.90 2,726.99 804,357 271 Colorado 8 1,010.07 2,616.08 757,119 272 Nevada 1 999.63 2,589.03 792,232 273 Ohio 10 990.48 2,565.33 791,001 274 Michigan 6 978.11 2,533.30 768,949 275 Texas 12 964.72 2,498.62 852,259 276 Pennsylvania 6 925.01 2,395.76 796,009 277 Illinois 11 918.71 2,379.45 766,584 278 Pennsylvania 17 893.14 2,313.23 753,416 279 California 21 891.31 2,308.48 775,200 280 Florida 7 834.48 2,161.28 813,213 281 New York 17 824.68 2,135.92 783,152 282 Maryland 2 811.19 2,100.96 783,097 283 Michigan 3 804.84 2,084.53 791,175 284 California 28 787.85 2,040.52 750,492 285 Tennessee 9 768.53 1,990.48 749,932 286 Rhode Island 2 766.01 1,983.96 556,563 287 Massachusetts 3 750.36 1,943.43 792,213 288 Pennsylvania 4 725.88 1,880.03 786,204 289 Washington 10 707.98 1,833.65 776,532 290 New York 25 707.68 1,832.89 768,525 291 Pennsylvania 1 699.56 1,811.85 768,164 292 California 7 680.45 1,762.37 764,481 293 Florida 19 679.40 1,759.64 826,915 294 Massachusetts 4 672.20 1,740.99 802,402 295 New York 1 663.47 1,718.38 782,097 296 Connecticut 1 656.44 1,700.16 734,950 297 Florida 15 654.30 1,694.62 835,404 298 New Jersey 4 651.25 1,686.73 795,125 299 New Jersey 5 649.45 1,682.06 794,119 300 Texas 2 628.51 1,627.83 882,070 301 Ohio 13 621.80 1,610.47 785,020 302 Illinois 1 611.55 1,583.92 735,259 303 Ohio 1 601.39 1,557.59 809,863 304 Florida 5 592.02 1,533.33 852,413 305 California 14 580.46 1,503.39 728,854 306 Arizona 8 575.29 1,489.99 815,902 307 California 10 537.41 1,391.89 773,816 308 Georgia 13 534.20 1,383.58 820,432 309 Massachusetts 6 532.67 1,379.62 796,651 310 California 16 529.07 1,370.28 751,938 311 Texas 35 520.74 1,348.70 873,155 312 Georgia 6 517.34 1,339.90 803,570 313 Illinois 10 510.14 1,321.25 749,775 314 Maryland 3 500.61 1,296.56 782,840 315 California 49 495.94 1,284.48 748,243 316 California 8 481.18 1,246.25 748,589 317 Connecticut 3 473.93 1,227.48 741,529 318 Minnesota 3 468.11 1,212.39 710,658 319 Connecticut 4 444.85 1,152.16 739,251 320 New Jersey 12 438.34 1,135.30 808,427 321 Pennsylvania 12 425.68 1,102.51 754,530 322 Missouri 5 422.31 1,093.78 776,496 323 North Carolina 2 408.99 1,059.28 790,747 324 Arizona 5 405.28 1,049.67 902,036 325 New Jersey 11 394.49 1,021.72 800,060 326 California 40 391.18 1,013.15 744,076 327 New Jersey 1 368.05 953.23 784,146 328 Texas 30 355.20 919.97 788,414 329 Washington 1 332.09 860.12 810,553 330 Texas 16 315.48 817.10 784,072 331 Michigan 11 315.15 816.24 787,210 332 Kentucky 3 307.75 797.07 763,950 333 Texas 38 307.68 796.89 810,804 334 Colorado 6 306.67 794.28 730,108 335 Minnesota 4 303.19 785.26 708,464 336 California 32 296.24 767.25 763,344 337 Massachusetts 8 293.39 759.88 784,982 338 Illinois 8 285.45 739.32 752,591 339 California 39 284.12 735.86 780,819 340 Indiana 7 276.01 714.86 757,121 341 Maryland 8 273.44 708.20 773,463 342 North Carolina 12 273.35 707.96 801,527 343 Texas 24 270.75 701.24 772,892 344 Georgia 4 269.42 697.81 759,754 345 Florida 14 269.11 696.99 826,751 346 Rhode Island 1 267.88 693.81 555,745 347 New York 26 261.43 677.11 760,693 348 Florida 10 256.79 665.07 802,532 349 California 50 256.53 664.41 759,815 350 Virginia 3 252.37 653.64 775,248 351 California 6 251.52 651.43 761,692 352 Virginia 11 250.95 649.96 792,747 353 Florida 22 250.75 649.43 804,159 354 Missouri 1 247.95 642.19 742,814 355 New York 2 238.59 617.94 777,625 356 Texas 18 230.76 597.66 825,192 357 Pennsylvania 5 229.20 593.63 768,273 358 Florida 13 227.70 589.75 762,930 359 Michigan 10 227.27 588.62 775,317 360 Illinois 6 225.22 583.31 764,465 361 Georgia 5 225.10 583.01 771,555 362 Texas 37 223.50 578.85 775,784 363 Massachusetts 5 219.31 568.01 790,877 364 Texas 33 218.79 566.66 790,618 365 Ohio 3 217.80 564.10 787,191 366 Texas 9 217.55 563.45 822,791 367 Maryland 4 217.17 562.46 763,420 368 Ohio 11 215.59 558.38 759,075 369 Michigan 13 215.30 557.63 784,609 370 California 42 212.29 549.84 722,218 371 California 31 207.67 537.87 724,696 372 Arizona 3 205.87 533.20 834,750 373 Texas 29 205.63 532.58 755,796 374 Hawaii 1 203.10 526.03 719,060 375 Florida 25 198.76 514.78 807,029 376 New York 3 192.83 499.44 775,796 377 New Jersey 6 191.78 496.70 786,792 378 Michigan 12 191.05 494.82 751,709 379 California 51 189.93 491.91 766,304 380 California 33 189.19 490.00 783,103 381 Washington 9 182.64 473.03 775,676 382 Texas 20 179.50 464.90 766,778 383 California 17 179.32 464.45 762,984 384 California 30 179.30 464.38 741,397 385 Arizona 4 178.85 463.21 793,264 386 California 35 177.22 459.01 764,929 387 California 47 173.09 448.29 756,257 388 Illinois 9 167.73 434.43 740,435 389 Florida 23 165.04 427.46 802,266 390 Illinois 5 155.10 401.72 773,710 391 Colorado 1 153.90 398.60 735,987 392 Illinois 3 153.85 398.46 732,771 393 California 38 149.33 386.77 722,610 394 Texas 32 149.12 386.22 765,626 395 Virginia 8 147.21 381.28 788,825 396 Wisconsin 4 139.97 362.53 722,345 397 Washington 7 137.41 355.88 811,726 398 California 52 135.29 350.39 756,396 399 Minnesota 5 130.81 338.81 705,006 400 Texas 7 130.71 338.55 770,214 401 Maryland 7 130.22 337.28 741,484 402 California 29 128.97 334.03 724,033 403 New York 16 124.04 321.27 773,517 404 Florida 27 119.23 308.81 788,713 405 California 15 116.24 301.07 723,474 406 New York 4 114.05 295.40 777,491 407 New Jersey 9 110.74 286.82 772,342 408 California 45 103.62 268.38 741,928 409 Florida 24 99.61 257.98 830,040 410 California 36 97.11 251.52 754,490 411 Illinois 4 95.76 248.01 712,078 412 California 12 92.66 239.98 756,336 413 California 44 91.14 236.04 742,823 414 New Jersey 10 77.54 200.83 800,200 415 California 46 74.78 193.68 763,396 416 California 43 72.18 186.94 719,690 417 Illinois 7 68.43 177.22 760,384 418 New York 11 64.23 166.35 759,734 419 Pennsylvania 2 64.02 165.81 738,540 420 Massachusetts 7 60.69 157.19 789,900 421 Pennsylvania 3 53.06 137.44 767,563 422 California 37 52.77 136.66 744,775 423 New Jersey 8 50.63 131.12 780,391 424 California 34 49.68 128.66 754,617 425 New York 5 47.10 121.99 766,680 426 California 11 41.37 107.15 729,775 427 New York 14 29.33 75.97 737,491 428 New York 8 26.68 69.10 739,447 429 New York 6 25.80 66.83 726,418 430 New York 7 21.95 56.84 777,946 431 New York 15 18.60 48.17 754,448 432 New York 10 15.33 39.71 757,254 433 New York 9 15.21 39.38 711,601 434 New York 13 11.01 28.51 747,542 435 New York 12 9.57 24.78 752,016
Alabama Territory : 1818–1819 (obsolete since statehood) At-large : 1819–1823, 1841–1843, 1873–1877, 1913–1917, 1963–1965 (obsolete) 1st district : 1823–1841, 1843–1963, 1965–present 2nd district : 1823–1841, 1843–1963, 1965–present 3rd district : 1823–1841, 1843–1963, 1965–present 4th district : 1833–1841, 1843–1963, 1965–present 5th district : 1833–1841, 1843–1963, 1965–present 6th district : 1843–1963, 1965–present 7th district : 1843–1863, 1877–1963, 1965–present 8th district : 1877–1963, 1965–1973 (obsolete since the 1970 census ) 9th district : 1893–1963 (obsolete since the 1960 census ) 10th district : 1917–1933 (obsolete since the 1930 census )
Alaska Alaska's at-large district since 1959
Arkansas
Delaware Delaware's at-large district since 1789 The oldest district in the country, it has never changed its shape or size. From 1813 to 1823, Delaware had two representatives — both chosen at-large on a general ticket from the same statewide district.
Georgia Georgia's congressional districts since 2025Interactive map version At-large : 1793–1827, 1829–1845, 1883–1885 (obsolete) 1st district : 1789–1793, 1827–1829, 1845–present 2nd district : 1789–1793, 1827–1829, 1845–present 3rd district : 1789–1793, 1827–1829, 1845–present 4th district : 1827–1829, 1845–present 5th district : 1827–1829, 1845–present 6th district : 1827–1829, 1845–present 7th district : 1827–1829, 1845–present 8th district : 1845–1863, 1873–present 9th district : 1873–present 10th district : 1885–present 11th district : 1893–1933, 1993–present 12th district : 1913–1933, 2003–present 13th district : 2003–present 14th district : 2013–present
Hawaii
Kentucky Kentucky's congressional districts since 2023Interactive map version At-large : 1933–1935 (obsolete) 1st district : 1792–1933, 1935–present 2nd district : 1792–1933, 1935–present 3rd district : 1803–1933, 1935–present 4th district : 1803–1933, 1935–present 5th district : 1803–1933, 1935–present 6th district : 1803–1933, 1935–present 7th district : 1813–1933, 1935–1993 (obsolete since the 1990 census ) 8th district : 1813–1933, 1935–1963 (obsolete since the 1960 census ) 9th district : 1813–1933, 1935–1953 (obsolete since the 1950 census ) 10th district : 1813–1863, 1873–1933 (obsolete since the 1930 census ) 11th district : 1823–1843, 1883–1933 (obsolete since the 1930 census ) 12th district : 1823–1843 (obsolete since the 1840 census ) 13th district : 1833–1843 (obsolete since the 1840 census )
Louisiana
Maine Maine's congressional districts since 2023Interactive map version Until 1820, Maine was part of Massachusetts. After the 1810 census , Massachusetts was allocated 20 districts. Seven Massachusetts districts (then numbered 14 through 20 ) were credited to Maine soon after it became a state in 1820. See District of Maine .
Massachusetts Massachusetts's congressional districts since 2023Interactive map version At-large : 1793–1795 (obsolete) 1st district : 1789–present 2nd district : 1789–present 3rd district : 1789–present 4th district : 1789–present 5th district : 1789–1793, 1795–present 6th district : 1789–1793, 1795–present 7th district : 1789–1793, 1795–present 8th district : 1789–1793, 1795–present 9th district : 1795–present 10th district : 1795–2013 (obsolete since the 2010 census ) 11th district : 1795–1843, 1853–1863, 1873–1993 (obsolete since the 1990 census ) 12th district : 1795–1843, 1883–1983 (obsolete since the 1980 census ) 13th district : 1795–1833, 1893–1963 (obsolete since the 1960 census ) 14th district : 1795–1820 (moved to Maine), 1903–1963 (obsolete since the 1960 census ) 15th district : 1803–1820 (moved to Maine), 1913–1943 (obsolete since the 1940 census ) 16th district : 1803–1820 (moved to Maine), 1913–1933 (obsolete since the 1930 census ) 17th district : 1803–1820 (obsolete since 1820 move to Maine [ notes 1] ) 18th district : 1813–1820 (obsolete since 1820 move to Maine [ notes 1] ) 19th district : 1813–1820 (obsolete since 1820 move to Maine [ notes 1] ) 20th district : 1813–1820 (obsolete since 1820 move to Maine [ notes 1] )
Minnesota Minnesota's congressional districts since 2023Interactive map version Territory : 1849–1858 (obsolete since statehood) At-large : 1858–1863, 1913–1915, 1933–1935 (obsolete) 1st district : 1863–1933, 1935–present 2nd district : 1863–1933, 1935–present 3rd district : 1873–1933, 1935–present 4th district : 1883–1933, 1935–present 5th district : 1883–1933, 1935–present 6th district : 1893–1933, 1935–present 7th district : 1893–1933, 1935–present 8th district : 1903–1933, 1935–present 9th district : 1903–1933, 1935–1963 (obsolete since the 1960 census ) 10th district : 1915–1933 (obsolete since the 1930 census )
Mississippi
Missouri Territory : 1812–1821 (obsolete since statehood) At-large : 1821–1847, 1933–1935 (obsolete) 1st district : 1847–1933, 1935–present 2nd district : 1847–1933, 1935–present 3rd district : 1847–1933, 1935–present 4th district : 1847–1933, 1935–present 5th district : 1847–1933, 1935–present 6th district : 1853–1933, 1935–present 7th district : 1853–1933, 1935–present 8th district : 1863–1933, 1935–present 9th district : 1863–1933, 1935–2013 (obsolete since the 2010 census ) 10th district : 1873–1933, 1935–1983 (obsolete since the 1980 census ) 11th district : 1873–1933, 1935–1963 (obsolete since the 1960 census ) 12th district : 1873–1933, 1935–1953 (obsolete since the 1950 census ) 13th district : 1873–1933, 1935–1953 (obsolete since the 1950 census ) 14th district : 1883–1933 (obsolete since the 1930 census ) 15th district : 1893–1933 (obsolete since the 1930 census ) 16th district : 1903–1933 (obsolete since the 1930 census )
New Jersey New Jersey's congressional districts since 2023Interactive map version At-large : 1789–1799, 1801–1813, 1815–1843 (obsolete) 1st district : 1799–1801, 1813–1815, 1843–present 2nd district : 1799–1801, 1813–1815, 1843–present 3rd district : 1799–1801, 1813–1815, 1843–present 4th district : 1799–1801, 1843–present 5th district : 1799–1801, 1843–present 6th district : 1873–present 7th district : 1873–present 8th district : 1893–present 9th district : 1903–present 10th district : 1903–present 11th district : 1913–present 12th district : 1913–present 13th district : 1933–2013 (obsolete since the 2010 census ) 14th district : 1933–1993 (obsolete since the 1990 census ) 15th district : 1963–1983 (obsolete since the 1980 census )
North Dakota North Dakota's at-large district since 1973
Pennsylvania Pennsylvania's congressional districts since 2023Interactive map version At-large : 1789–1791, 1793–1795, 1873–1875, 1883–1889, 1893–1903, 1913–1923, 1943–1945 (obsolete) 1st district : 1791–1793, 1795–present 2nd district : 1791–1793, 1795–present 3rd district : 1791–1793, 1795–present 4th district : 1791–1793, 1795–present 5th district : 1791–1793, 1795–present 6th district : 1791–1793, 1795–present 7th district : 1791–1793, 1795–present 8th district : 1791–1793, 1795–present 9th district : 1795–present 10th district : 1795–present 11th district : 1795–present 12th district : 1795–1803, 1813–present 13th district : 1813–present 14th district : 1813–present 15th district : 1813–present 16th district : 1823–present 17th district : 1823–present 18th district : 1823–2023 (obsolete since the 2020 census ) 19th district : 1833–2013 (obsolete since the 2010 census ) 20th district : 1833–2003 (obsolete since the 2000 census ) 21st district : 1833–2003 (obsolete since the 2000 census ) 22nd district : 1833–1993 (obsolete since the 1990 census ) 23rd district : 1833–1993 (obsolete since the 1990 census ) 24th district : 1833–1983 (obsolete since the 1980 census ) 25th district : 1833–1843, 1853–1863, 1875–1983 (obsolete since the 1980 census ) 26th district : 1875–1973 (obsolete since the 1970 census ) 27th district : 1875–1973 (obsolete since the 1970 census ) 28th district : 1889–1963 (obsolete since the 1960 census ) 29th district : 1903–1963 (obsolete since the 1960 census ) 30th district : 1903–1963 (obsolete since the 1960 census ) 31st district : 1903–1953 (obsolete since the 1950 census ) 32nd district : 1903–1953 (obsolete since the 1950 census ) 33rd district : 1923–1953 (obsolete since the 1950 census ) 34th district : 1923–1943 (obsolete since the 1940 census ) 35th district : 1923–1933 (obsolete since the 1930 census ) 36th district : 1923–1933 (obsolete since the 1930 census )
South Dakota South Dakota's at-large district since 1983
Vermont Vermont's at-large district since 1933 At-large : 1813–1821, 1823–1825, 1933–present 1st district : 1791–1813, 1821–1823, 1825–1933 (obsolete since the 1930 census ) 2nd district : 1791–1813, 1821–1823, 1825–1933 (obsolete since the 1930 census ) 3rd district : 1803–1813, 1821–1823, 1825–1883 (obsolete since the 1880 census ) 4th district : 1803–1813, 1821–1823, 1825–1853 (obsolete since the 1850 census ) 5th district : 1821–1823, 1825–1843 (obsolete since the 1840 census ) 6th district : 1821–1823 (obsolete since the 1820 census )
Virginia Virginia's congressional districts since 2023Interactive map version At-large : 1883–1885, 1933–1935 (obsolete) 1st district : 1789–1933, 1935–present 2nd district : 1789–1933, 1935–present 3rd district : 1789–1933, 1935–present 4th district : 1789–1933, 1935–present 5th district : 1789–1933, 1935–present 6th district : 1789–1933, 1935–present 7th district : 1789–1933, 1935–present 8th district : 1789–1933, 1935–present 9th district : 1789–1863, 1873–1933, 1935–present 10th district : 1789–1863, 1885–1933, 1953–present 11th district : 1793–1863, 1993–present 12th district : 1793–1863 (obsolete since the 1863 move to West Virginia ) 13th district : 1793–1863 (obsolete since the 1863 move to West Virginia ) 14th district : 1793–1853 (obsolete since the 1850 census ) 15th district : 1793–1853 (obsolete since the 1850 census ) 16th district : 1793–1843 (obsolete since the 1840 census ) 17th district : 1793–1843 (obsolete since the 1840 census ) 18th district : 1793–1843 (obsolete since the 1840 census ) 19th district : 1793–1843 (obsolete since the 1840 census ) 20th district : 1803–1843 (obsolete since the 1840 census ) 21st district : 1803–1843 (obsolete since the 1840 census ) 22nd district : 1803–1833 (obsolete since the 1830 census ) 23rd district : 1813–1823 (obsolete since the 1820 census )
Wyoming Wyoming's at-large district since 1869
Notes 1 2 3 4 Maine used to be part of Massachusetts. After the 1810 census , Massachusetts was allocated 20 districts. Seven districts (numbers 14 through 20) were credited to Maine soon after it became a state in 1820. References 1 2 3 4 5 "2020 Census Apportionment Results Delivered to the President" . US Census Bureau. April 26, 2021. Retrieved October 3, 2017 . ↑ Public Law 62-5 of 1911, though Congress has the authority to change that number. ↑ Thompson, Don (October 12, 2022). "Census, term limit change means big turnover for lawmakers" . APNews.com . Associated Press. ↑ "Redistricting Criteria" . www.ncsl.org . Retrieved December 19, 2023 . ↑ "About Congressional Districts" . Census.gov . Retrieved December 19, 2023 . ↑ Gelman, A., King, G. (1994). Enhancing democracy through legislative redistricting. The American Political Science Review, 88, 541–559. ↑ Whitaker, L. (2015). Congressional Redistricting and the Voting Rights Act: A Legal Overview [Ebook] (1st ed., pp. 3–12). Congressional Research Service. ↑ "Redistricting and the Supreme Court: The Most Significant Cases", 2020 ↑ Altman, Micah; McDonald, Michael (January 1, 2012). "Redistricting Principles for the Twenty-First Century" . Case Western Reserve Law Review . 62 (4): 1179. ISSN 0008-7262 . ↑ Bowen, D. (2014). Boundaries, redistricting criteria and representation in the U.S. House of Representatives. American Politics Research, 42(5), 856–895. ↑ "About Congressional Apportionment" . Census.gov . Retrieved December 19, 2023 . ↑ "Rhode Island's 1st congressional district" . United States Census Bureau. Retrieved February 25, 2023 . ↑ Files downloaded from the U.S. Census Bureau's TIGER/Line Shapefiles for congressional districts . Areas derived from the "ALAND" field in the shapefiles, given in square meters. ↑ Center for New Media & Promotion (CNMP), US Census Bureau. "My Congressional District" . www.census.gov . External links
Membership
Leaders
Districts Groups
Related
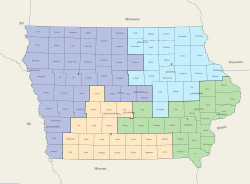
Powers, privileges, procedure, committees, history, media
Regions Native areas Metropolitan State-level County-level Local History
This page is based on this
Wikipedia article Text is available under the
CC BY-SA 4.0 license; additional terms may apply.
Images, videos and audio are available under their respective licenses.