List of U.S. states by employment rate

Last updated

This is a list of U.S. states and the District of Columbia by Employment-to-population ratio (population 16 and over).

Contents

List

U.S. states by net employment rate (% of population 16 and over) 2022 [1]
National
rank
StateEmployment rate in %
(total population)
Annual change (%)
(Increase2.svg=rise in employment)
1Flag of Nebraska.svg  Nebraska 68.1Increase2.svg 0.5
2Flag of North Dakota.svg  North Dakota 67.8Increase2.svg 1.3
Flag of the District of Columbia.svg  District of Columbia 67.4Increase2.svg 3.0
3Flag of Utah.svg  Utah 67.1Increase2.svg 1.1
4Flag of South Dakota.svg  South Dakota 66.8Steady2.svg 0.0
5Flag of Colorado.svg  Colorado 66.3Increase2.svg 1.9
Flag of Iowa.svg  Iowa 66.3Increase2.svg 1.5
Flag of Minnesota.svg  Minnesota 66.3Increase2.svg 1.4
8Flag of Kansas.svg  Kansas 64.6Increase2.svg 0.4
9Flag of New Hampshire.svg  New Hampshire 64.5Increase2.svg 0.9
10Flag of Wisconsin.svg  Wisconsin 63.1Decrease2.svg 0.1
Flag of Michigan.svg  Michigan 63.1Increase2.svg 1.5
12Flag of Virginia.svg  Virginia 63.0Increase2.svg 1.8
13Flag of Massachusetts.svg  Massachusetts 62.7Increase2.svg 1.2
14Flag of Connecticut.svg  Connecticut 62.8Increase2.svg 3.6
Flag of Maryland.svg  Maryland 62.8Increase2.svg 1.3
16Flag of Alaska.svg  Alaska 61.6Increase2.svg 2.0
Flag of Indiana.svg  Indiana 61.6Increase2.svg 1.1
18Flag of Illinois.svg  Illinois 61.5Increase2.svg 2.2
Flag of New Jersey.svg  New Jersey 61.5Increase2.svg 2.7
Flag of Vermont.svg  Vermont 61.5Increase2.svg 1.6
21Flag of Idaho.svg  Idaho 61.4Increase2.svg 0.7
Flag of Montana.svg  Montana 61.4Increase2.svg 1.2
Flag of Texas.svg  Texas 61.4Increase2.svg 1.5
Flag of Washington.svg  Washington 61.4Increase2.svg 1.5
Flag of Wyoming.svg  Wyoming 61.4Increase2.svg 0.7
26Flag of Rhode Island.svg  Rhode Island 61.3Increase2.svg 1.2
27Flag of Missouri.svg  Missouri 61.1Increase2.svg 0.9
28Flag of Oregon.svg  Oregon 60.2Increase2.svg 1.4
Flag of the United States.svg  United States 60.0Increase2.svg 1.4
29Flag of Georgia (U.S. state).svg  Georgia 59.6Increase2.svg 0.3
30Flag of Arizona.svg  Arizona 59.3Increase2.svg 1.1
Flag of California.svg  California 59.3Increase2.svg 2.7
32Flag of Pennsylvania.svg  Pennsylvania 59.1Increase2.svg 1.4
Flag of Oklahoma.svg  Oklahoma 59.1Increase2.svg 0.8
34Flag of Ohio.svg  Ohio 59.0Increase2.svg 0.8
35Flag of North Carolina.svg  North Carolina 58.7Increase2.svg 2.2
36Flag of Hawaii.svg  Hawaii 58.1Increase2.svg 2.1
37Flag of Nevada.svg  Nevada 57.9Increase2.svg 2.0
Flag of Tennessee.svg  Tennessee 57.9Increase2.svg 0.4
39Flag of Delaware.svg  Delaware 57.7Steady2.svg 0.0
Flag of New York.svg  New York 57.7Increase2.svg 2.4
41Flag of Florida.svg  Florida 57.6Increase2.svg 2.1
42Flag of Maine.svg  Maine 56.8Decrease2.svg 0.4
43Flag of Louisiana.svg  Louisiana 56.5Increase2.svg 1.8
44Flag of Kentucky.svg  Kentucky 55.6Increase2.svg 0.8
45Flag of Arkansas.svg  Arkansas 55.6Increase2.svg 1.2
46Flag of Alabama.svg  Alabama 55.5Increase2.svg 0.8
47Flag of South Carolina.svg  South Carolina 54.7Decrease2.svg 0.1
48Flag of New Mexico.svg  New Mexico 54.2Increase2.svg 1.7
49Flag of Mississippi.svg  Mississippi 52.7Increase2.svg 0.6
50Flag of West Virginia.svg  West Virginia 52.5Increase2.svg 1.3

See also

Related Research Articles

<span class="mw-page-title-main">United States Census Bureau</span> U.S. agency responsible for the census and related statistics

The United States Census Bureau (USCB), officially the Bureau of the Census, is a principal agency of the U.S. Federal Statistical System, responsible for producing data about the American people and economy. The Census Bureau is part of the U.S. Department of Commerce and its director is appointed by the President of the United States.

<span class="mw-page-title-main">Demographics of the United States</span>

The United States had an official estimated resident population of 333,287,557 on July 1, 2022, according to the U.S. Census Bureau. This figure includes the 50 states and the District of Columbia but excludes the population of five unincorporated U.S. territories as well as several minor island possessions. The United States is the third most populous country in the world. The Census Bureau showed a population increase of 0.4% for the twelve-month period ending in July 2022, below the world average annual rate of 0.9%. The total fertility rate in the United States estimated for 2022 is 1.665 children per woman, which is below the replacement fertility rate of approximately 2.1.

<span class="mw-page-title-main">Metropolitan statistical area</span> Type of geographical region in the United States

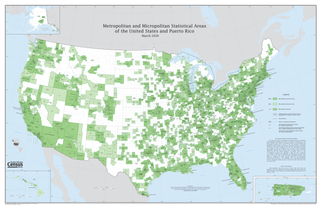
In the United States, a metropolitan statistical area (MSA) is a geographical region with a relatively high population density at its core and close economic ties throughout the area. Such regions are not legally incorporated as a city or town would be and are not legal administrative divisions like counties or separate entities such as states. That makes the precise definition of any given metropolitan area vary with the source. The statistical criteria for a standard metropolitan area were defined in 1949 and redefined as a metropolitan statistical area in 1983.

<span class="mw-page-title-main">Micropolitan statistical area</span> Statistical area of the United States

United States micropolitan statistical areas, as defined by the Office of Management and Budget (OMB), are labor market and statistical areas in the United States centered on an urban cluster with a population of at least 10,000 but fewer than 50,000 people. The micropolitan area designation was created in 2003. Like the better-known metropolitan statistical areas, a micropolitan area is a geographic entity used for statistical purposes based on counties and county equivalents. The OMB has identified 543 micropolitan areas in the United States.

Combined statistical area (CSA) is a United States Office of Management and Budget (OMB) term for a combination of adjacent metropolitan (MSA) and micropolitan statistical areas (µSA) across the 50 U.S. states and the territory of Puerto Rico that can demonstrate economic or social linkage. CSAs were first designated in 2003. The OMB defines a CSA as consisting of various combinations of adjacent metropolitan and micropolitan areas with economic ties measured by commuting patterns. These areas that combine retain their own designations as metropolitan or micropolitan statistical areas within the larger combined statistical area.

<span class="mw-page-title-main">1970 United States census</span> 19th United States national census

The United States census of 1970, conducted by the Census Bureau, determined the resident population of the United States to be 203,392,031, an increase of 13.4 percent over the 179,323,175 persons enumerated during the 1960 census.

The following are Wikipedia lists related to the United States of America.

References

  1. "Nebraska had the highest proportion of employed people in 2022 : The Economics Daily: U.S. Bureau of Labor Statistics". www.bls.gov. Retrieved 2023-07-05.