This article is missing information about LGBT demographics in the U.S. territories.(September 2019) |
The demographics of sexual orientation and gender identity in the United States have been studied in the social sciences in recent decades. A 2022 Gallup poll concluded that 7.1% of adult Americans identified as LGBT. [1] A different survey in 2016, from the Williams Institute, estimated that 0.6% of U.S. adults identify as transgender. [2] As of 2022, estimates for the total percentage of U.S. adults that are transgender or nonbinary range from 0.5% to 1.6%. [3] [4] Additionally, a Pew Research survey from 2022 found that approximately 5% of young adults in the U.S. say their gender is different from their sex assigned at birth. [5]
Studies from several nations, including the U.S., conducted at varying time periods, have produced a statistical range of 1.2 [6] to 6.8 [7] percent of the adult population identifying as LGBT. Online surveys tend to yield higher figures than other methods, [7] a likely result of the higher degree of anonymity of Internet surveys, and demographic of those utilizing online platforms which elicit reduced levels of socially desirable responding. [8] As of 2010 [update] the U.S. Census Bureau did not ask singles about sexual orientation in the United States Census. [9] In the 2020 United States census, same-sex married couples accounted for 0.5% of all U.S. households and unmarried same-sex couples accounted for 0.4% of all U.S. households. [10]
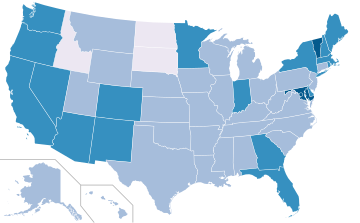
Pop. rank | % rank | State or territory | 2015–2016 LGBT adult percentage estimate [11] | 2012 state total population estimate [12] | 2012 LGBT adult population estimate | 2000 same-sex couple households [13] | 2010 same-sex couple households [14] | 2000 to 2010 couple households growth [13] | 2016 transgender adult percentage estimate [2] |
---|---|---|---|---|---|---|---|---|---|
1 | 4 | California | 4.9% | 38,041,430 | 1,338,164 | 92,138 | 98,153 | 6.53% | 0.76% |
2 | 26 | Texas | 3.6% | 26,084,481 | 579,968 | 42,912 | 46,401 | 8.13% | 0.66% |
3 | 10 | New York | 4.5% | 19,570,261 | 570,388 | 46,490 | 48,932 | 4.05% | 0.51% |
4 | 13 | Florida | 4.2% | 19,317,568 | 513,849 | 41,048 | 48,496 | 18.15% | 0.66% |
5 | 20 | Illinois | 3.9% | 12,875,255 | 362,048 | 22,887 | 23,049 | 0.07% | 0.51% |
6 | 27 | Pennsylvania | 3.6% | 12,763,536 | 262,308 | 21,166 | 22,336 | 5.50% | 0.44% |
7 | 24 | Ohio | 3.8% | 11,544,225 | 315,592 | 18,937 | 19,684 | 3.95% | 0.45% |
8 | 19 | Georgia | 4.0% | 9,919,945 | 263,870 | 19,288 | 21,318 | 10.52% | 0.75% |
9 | 23 | Michigan | 3.8% | 9,883,360 | 285,431 | 15,368 | 14,598 | -5.0% | 0.43% |
10 | 32 | North Carolina | 3.5% | 9,752,073 | 244,582 | 16,198 | 18,309 | 11.36% | 0.60% |
11 | 28 | New Jersey | 3.6% | 8,864,590 | 249,273 | 16,604 | 16,875 | 1.60% | 0.44% |
12 | 34 | Virginia | 3.4% | 8,185,867 | 180,416 | 13,802 | 14,243 | 3.20% | 0.55% |
13 | 9 | Washington | 4.6% | 6,897,012 | 209,670 | 15,900 | 19,003 | 19.51% | 0.62% |
14 | 3 | Massachusetts | 4.9% | 6,646,144 | 247,247 | 17,099 | 20,256 | 18.46% | 0.57% |
15 | 17 | Arizona | 4.0% | 6,553,255 | 194,238 | 12,332 | 15,817 | 28.25% | 0.62% |
16 | 15 | Indiana | 4.1% | 6,537,334 | 183,829 | 10,219 | 11,074 | 8.37% | 0.56% |
17 | 42 | Tennessee | 3.1% | 6,456,243 | 127,526 | 10,189 | 10,898 | 6.95% | 0.63% |
18 | 36 | Missouri | 3.4% | 6,021,988 | 151,032 | 9,428 | 10,557 | 10.70% | 0.54% |
19 | 21 | Maryland | 3.9% | 5,884,563 | 147,584 | 11,243 | 12,538 | 11.52% | 0.49% |
20 | 35 | Wisconsin | 3.4% | 5,726,398 | 121,858 | 8,232 | 9,179 | 10.32% | 0.43% |
21 | 18 | Minnesota | 4.0% | 5,379,139 | 118,556 | 9,147 | 10,207 | 11.60% | 0.59% |
22 | 12 | Colorado | 4.3% | 5,187,582 | 126,162 | 10,045 | 12,424 | 23.70% | 0.53% |
23 | 45 | Alabama | 3.0% | 4,822,023 | 102,613 | 8,109 | 6,582 | -18.80% | 0.61% |
24 | 48 | South Carolina | 3.0% | 4,723,723 | 104,111 | 7,609 | 7,214 | 5.20% | 0.58% |
25 | 25 | Louisiana | 3.7% | 4,601,893 | 111,918 | 8,808 | 8,076 | -8.31% | 0.60% |
26 | 39 | Kentucky | 3.3% | 4,380,415 | 129,836 | 7,114 | 7,195 | 1.13% | 0.53% |
27 | 5 | Oregon | 4.9% | 3,899,353 | 145,212 | 8,932 | 11,773 | 31.80% | 0.65% |
28 | 31 | Oklahoma | 3.5% | 3,814,820 | 98,575 | 5,763 | 6,134 | 6.44% | 0.64% |
29 | 33 | Connecticut | 3.5% | 3,590,347 | 92,775 | 7,386 | 7,852 | 6.30% | 0.44% |
30 | 40 | Iowa | 3.2% | 3,074,186 | 65,419 | 3,698 | 4,093 | 10.70% | 0.31% |
31 | 41 | Mississippi | 3.2% | 2,984,926 | 58,982 | 4,774 | 3,484 | -27.00% | 0.61% |
32 | 46 | Arkansas | 3.0% | 2,949,131 | 78,441 | 4,423 | 4,226 | -4.45% | 0.60% |
33 | 43 | Kansas | 3.1% | 2,885,905 | 81,152 | 3,973 | 4,009 | 0.09% | 0.43% |
34 | 38 | Utah | 3.3% | 2,855,287 | 58,591 | 3,360 | 5,814 | 73.03% | 0.36% |
35 | 6 | Nevada | 4.8% | 2,758,931 | 88,065 | 4,973 | 7,140 | 43.60% | 0.61% |
36 | 14 | New Mexico | 4.2% | 2,085,538 | 45,965 | 4,496 | 5,825 | 25.56% | 0.75% |
37 | 29 | Nebraska | 3.6% | 1,855,525 | 38,075 | 2,332 | 2,356 | 0.01% | 0.39% |
38 | 37 | West Virginia | 3.4% | 1,855,413 | 43,713 | 2,916 | 2,848 | -2.33% | 0.42% |
39 | 49 | Idaho | 2.8% | 1,595,728 | 32,744 | 1,873 | 2,042 | 9.02% | 0.41% |
40 | 22 | Hawaii | 3.8% | 1,392,313 | 53,966 | 2,389 | 3,239 | 35.45% | 0.78% |
41 | 11 | Maine | 4.5% | 1,329,192 | 48,489 | 3,394 | 3,958 | 16.61% | 0.50% |
42 | 8 | New Hampshire | 4.6% | 1,320,718 | 31,138 | 2,703 | 3,260 | 20.60% | 0.43% |
43 | 16 | Rhode Island | 4.0% | 1,050,292 | 35,920 | 2,471 | 2,785 | 12.71% | 0.51% |
44 | 47 | Montana | 3.0% | 1,005,141 | 19,862 | 1,218 | 1,848 | 10.70% | 0.34% |
45 | 7 | Delaware | 4.7% | 917,092 | 23,698 | 1,868 | 2,646 | 41.65% | 0.64% |
46 | 51 | South Dakota | 2.0% | 833,354 | 27,867 | 826 | 714 | -13.36% | 0.34% |
47 | 44 | Alaska | 3.0% | 731,449 | 24,869 | 1,180 | 1,228 | 4.06% | 0.49% |
48 | 50 | North Dakota | 2.7% | 699,628 | 9,040 | 703 | 559 | -20.50% | 0.30% |
49 | 1 | District of Columbia | 8.6% | 632,323 | 63,232 | 3,678 | 4,822 | 31.10% | 2.77% |
50 | 2 | Vermont | 5.3% | 626,011 | 23,313 | 1,933 | 2,143 | 10.61% | 0.59% |
51 | 30 | Wyoming | 3.5% | 576,412 | 16,716 | 807 | 657 | -18.60% | 0.32% |
— | — | Total | 3.8% | Total population: 313,914,039 Adult population: 238,574,670 | 9,083,558 | 594,391 | 646,464 | 8.76% | 0.58% |
Parts of this article (those related to documentation) need to be updated.(September 2015) |
The American cities with the highest gay populations are New York City with 272,493, Los Angeles with 154,270, Chicago with 114,449, and San Francisco with 94,234, as estimated by the Williams Institute in 2006. [15] However, gay residents are much more likely to be encountered in San Francisco, Seattle, Atlanta, Minneapolis, and Boston because a higher percentage of those cities' residents are gay or lesbian.
The U.S. metropolitan areas with the most gay residents are the New York metro with 568,903; followed by Los Angeles metro with 442,211; and the Chicago metro with 288,748. [lower-alpha 1]
The charts list the top U.S. cities (in alphabetical order), metropolitan areas, and states with the highest population of gay residents and the highest percentage of gay residents (GLB population as a percentage of total residents based on available census data). [15] The numbers given are estimates based on American Community Survey data for the year 2006. [16]
% Rank | City | 2005 LGB percentage estimate [17] | 2005 LGB population estimate [17] |
---|---|---|---|
1 | San Francisco | 15.4% | 94,234 |
2 | Seattle | 12.9% | 57,993 |
3 | Atlanta | 12.8% | 39,805 |
4 | Minneapolis | 12.5% | 34,295 |
5 | Boston | 12.3% | 50,450 |
6 | Sacramento | 9.8% | 32,108 |
7 | Portland, OR | 8.8% | 35,413 |
8 | Denver | 8.2% | 33,698 |
9 | Washington, D.C. | 8.1% | 32,599 |
10 | Orlando | 7.7% | 12,508 |
11 | Salt Lake City | 7.6% | 10,726 |
13 | Baltimore | 6.9% | 30,779 |
14 | Hartford | 6.8% | 5,292 |
15 | Rochester | 6.8% | 9,371 |
16 | San Diego | 6.8% | 61,945 |
17 | St. Louis | 6.8% | 16,868 |
18 | Columbus | 6.7% | 34,952 |
19 | Kansas City | 6.7% | 22,360 |
20 | Phoenix | 6.4% | 63,222 |
21 | Tampa | 6.1% | 14,119 |
22 | San Jose | 5.8% | 37,260 |
23 | Chicago | 5.7% | 114,449 |
24 | Birmingham | 5.6% | 9,263 |
25 | Los Angeles | 5.6% | 154,270 |
26 | Miami | 5.5% | 15,227 |
27 | Nashville-Davidson | 5.1% | 20,313 |
28 | New Orleans | 5.1% | 16,554 |
29 | Austin | 4.8% | 24,615 |
30 | Indianapolis | 4.8% | 26,712 |
31 | Providence | 4.8% | 5,564 |
32 | Las Vegas | 4.6% | 17,925 |
33 | Milwaukee | 4.6% | 18,243 |
34 | New York City | 4.5% | 272,493 |
35 | Houston | 4.4% | 61,976 |
Metropolitan Area | 2005 % LGB Est. [15] | 2005 LGB Pop. Est. [15] | 2012–2014 % LGBT Est. [18] | 2021 % LGBT Est. [19] | 2021 LGBT Pop. Est. [19] | 2005-2021 Change in LGBT Pop. Est. [18] |
---|---|---|---|---|---|---|
San Francisco-Oakland-Berkeley, CA MSA | 8.2% | 256,313 | 6.2% | 6.7% | 247,000 | -9,313 |
Portland-Vancouver-Hillsboro, OR-WA MSA | 6.1% | 94,027 | 5.4% | 6.0% | 112,000 | 17,973 |
Austin-Round Rock-Georgetown, TX MSA | 5.9% | 61,732 | 5.3% | 5.9% | 90,000 | 28,268 |
Seattle-Tacoma, WA CSA | 6.5% | 154,835 | 4.8% | 5.2% | 152,000 | -2,835 |
Los Angeles-Long Beach-Anaheim, CA MSA | 4.8% | 442,211 | 4.6% | 5.1% | 523,000 | 80,789 |
Las Vegas-Henderson-Paradise, NV MSA | 3.9% | 48,532 | 4.3% | 5.1% | 82,000 | 33,468 |
Orlando-Kissimmee-Sanford, FL MSA | 5.7% | 81,272 | 4.1% | 5.0% | 93,000 | 11,728 |
Boston-Cambridge-Newton, MA-NH MSA | 6.2% | 201,344 | 4.8% | 4.9% | 186,000 | -15,344 |
Denver-Aurora-Lakewood, CO MSA | 5.8% | 99,027 | 4.6% | 4.8% | 103,000 | 3,973 |
Tampa-St. Petersburg-Clearwater, FL MSA | 5.9% | 119,044 | 4.1% | 4.8% | 113,000 | -6,044 |
Tucson, AZ MSA | 4.7% | 37,000 | N/A | |||
New Orleans-Metairie, LA MSA | 3.7% | 35,230 | 5.1% | 4.7% | 46,000 | 10,770 |
Salt Lake City, UT MSA | 3.7% | 26,761 | 4.7% | 4.7% | 39,000 | 12,239 |
Hartford-East Hartford-Middletown, CT MSA | 5.6% | 49,000 | 4.6% | 4.6% | 44,000 | -5,000 |
Atlanta-Sandy Springs-Alpharetta, GA MSA | 5.1% | 180,168 | 4.2% | 4.6% | 194,000 | 13,832 |
Indianapolis-Carmel-Anderson, IN MSA | 4.5% | 52,963 | 4.2% | 4.5% | 68,000 | 15,037 |
San Diego-Chula Vista-Carlsbad, CA MSA | 4.9% | 102,016 | 3.9% | 4.5% | 115,000 | 12,984 |
Washington-Arlington-Alexandria, DC-VA-MD-WV MSA | 5.0% | 191,959 | 4.0% | 4.5% | 209,000 | 17,041 |
Miami-Fort Lauderdale-Pompano Beach, FL MSA | 4.5% | 183,346 | 4.2% | 4.5% | 214,000 | 30,654 |
Worcester, MA-CT MSA | 4.5% | 33,000 | N/A | |||
New York-Newark-Jersey City, NY-NJ-PA MSA | 4.1% | 568,903 | 4.0% | 4.5% | 706,000 | 137,097 |
Providence-Warwick, RI-MA MSA | 3.6% | 43,417 | 4.4% | 4.5% | 58,000 | 14,583 |
Sacramento-Roseville-Folsom, CA MSA | 5.5% | 81,759 | 3.9% | 4.4% | 77,000 | -4,759 |
Albuquerque, NM MSA | 4.4% | 31,000 | N/A | |||
Columbus, OH MSA | 5.5% | 68,300 | 4.3% | 4.4% | 67,000 | -1,300 |
San Antonio-New Braunfels, TX MSA | 3.5% | 46,188 | 4.0% | 4.4% | 78,000 | 31,812 |
Phoenix-Mesa-Chandler, AZ MSA | 4.8% | 132,960 | 4.1% | 4.3% | 146,000 | 13,040 |
Rochester, NY MSA | 4.3% | 37,000 | N/A | |||
Jacksonville, FL MSA | 4.0% | 36,422 | 4.3% | 4.2% | 47,000 | 10,578 |
Louisville/Jefferson County, KY-IN MSA | 4.2% | 17,102 | 4.5% | 4.2% | 42,000 | 24,898 |
Minneapolis-St. Paul-Bloomington, MN-WI MSA | 5.7% | 130,472 | 3.6% | 4.2% | 112,000 | -18,472 |
Philadelphia-Camden-Wilmington, PA-NJ-DE-MD MSA | 4.2% | 179,459 | 3.9% | 4.2% | 198,000 | 18,541 |
Chicago-Naperville-Elgin, IL-IN-WI MSA | 4.3% | 288,748 | 3.8% | 4.1% | 298,000 | 9,252 |
Baltimore-Columbia-Towson, MD MSA | 5.2% | 100,032 | 3.9% | 4.1% | 89,000 | -11,032 |
Buffalo-Cheektowaga, NY MSA | 3.3% | 28,193 | 3.9% | 4.1% | 37,000 | 8,807 |
Tulsa, OK MSA | 4.1% | 30,000 | N/A | |||
Richmond, VA MSA | 3.4% | 28,750 | 3.5% | 4.1% | 40,000 | 11,250 |
Virginia Beach-Norfolk-Newport News, VA-NC MSA | 3.9% | 44,689 | 4.4% | 4.1% | 55,000 | 10,311 |
Riverside-San Bernardino-Ontario, CA MSA | 4.9% | 131,555 | 4.0% | 4.0% | 133,000 | 1,445 |
Albany-Schenectady-Troy, NY MSA | 4.0% | 28,000 | N/A | |||
Charlotte-Concord-Gastonia, NC-SC MSA | 3.3% | 36,464 | 3.8% | 4.0% | 74,000 | 37,536 |
Dallas-Fort Worth-Arlington, TX MSA | 4.5% | 183,718 | 3.8% | 4.0% | 211,000 | 27,282 |
Detroit–Warren–Dearborn, MI MSA | 3.0% | 98,402 | 3.9% | 3.8% | 131,000 | 32,598 |
San Jose-Sunnyvale-Santa Clara, CA MSA | 5.0% | 63,941 | 3.2% | 3.8% | 58,000 | -5,941 |
Kansas City, MO-KS MSA | 5.1% | 72,080 | 3.6% | 3.8% | 60,000 | -12,080 |
Cleveland-Elyria, OH MSA | 4.3% | 66,943 | 3.7% | 3.8% | 62,000 | -4,943 |
Oklahoma City, OK MSA | 3.3% | 28,288 | 3.5% | 3.8% | 39,000 | 10,712 |
St. Louis, MO-IL MSA | 4.1% | 83,769 | 3.6% | 3.7% | 79,000 | -4,769 |
Nashville-Davidson–Murfreesboro–Franklin, TN MSA | 3.8% | 57,027 | 3.5% | 3.7% | 52,000 | -5,027 |
Cincinnati, OH-KY-IN MSA | 3.8% | 57,027 | 3.2% | 3.6% | 60,000 | 2,973 |
Houston-The Woodlands-Sugar Land, TX MSA | 4.1% | 152,288 | 3.3% | 3.5% | 169,000 | 16,712 |
Milwaukee-Waukesha, WI MSA | 3.7% | 40,407 | 3.5% | 3.5% | 42,000 | 1,593 |
Omaha-Council Bluffs, NE-IA MSA | 3.4% | 23,000 | N/A | |||
Raleigh-Cary, NC MSA | 3.2% | 3.3% | 32,000 | N/A | ||
Pittsburgh, PA MSA | 2.8% | 50,994 | 3.0% | 3.3% | 63,000 | 12,006 |
Gay/lesbian | Bisexual | Something else | Heterosexual | Did not report | |
---|---|---|---|---|---|
2002 [43] | 1.3% | 2.8% | 3.8% | 90.3% | 1.8% |
2006–2010 [44] | 1.2% | 3.9% | 0.4% | 93.6% | 0.8% |
2011–2013 [45] | 1.3% | 5.5% | — | 92.3% | 0.9% |
Gay/lesbian | Bisexual | Something else | Heterosexual | Did not report | |
---|---|---|---|---|---|
2002 | 2.3% | 1.8% | 3.9% | 90.2% | 1.8% |
2006–2010 | 1.8% | 1.2% | 0.2% | 95.6% | 1.2% |
2011–2013 | 1.9% | 2.0% | — | 95.1% | 1.0% |
[54] | Gay/lesbian | Bisexual | Total |
---|---|---|---|
2008 | 5.6% | 1.1% | 6.7% |
2010 | 4.2% | 1.4% | 5.6% |
2012 | 3.5% | 1.2% | 4.7% |
2014 | 3.7% | 2.6% | 6.3% |
2016 [55] | 2.4% | 3.0% | 5.4% |
The poll was unable to gather sufficient data from nonbinary Americans (constituting 1% of American adults) for 2023 alone, but combined data from 2022 and 2023 suggested that about 80% of nonbinary adults identified as LGBTQ+, with one-third identifying as transgender and one-third bisexual. [8]
Heterosexuality is romantic attraction, sexual attraction or sexual behavior between people of the opposite sex or gender. As a sexual orientation, heterosexuality is "an enduring pattern of emotional, romantic, and/or sexual attractions" to people of the opposite sex. It "also refers to a person's sense of identity based on those attractions, related behaviors, and membership in a community of others who share those attractions." Someone who is heterosexual is commonly referred to as straight.
Sexual orientation is an enduring personal pattern of romantic attraction or sexual attraction to persons of the opposite sex or gender, the same sex or gender, or to both sexes or more than one gender. Patterns are generally categorized under heterosexuality, homosexuality, and bisexuality, while asexuality is sometimes identified as the fourth category.
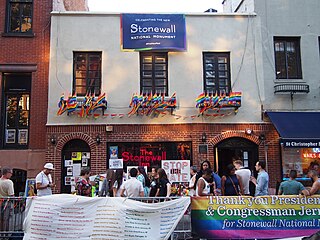
The LGBTQ community is a loosely defined grouping of lesbian, gay, bisexual, transgender, and queer or questioning individuals united by a common culture and social movements. These communities generally celebrate pride, diversity, individuality, and sexuality. LGBTQ activists and sociologists see LGBTQ community-building as a counterweight to heterosexism, homophobia, biphobia, transphobia, sexualism, and conformist pressures that exist in the larger society. The term pride or sometimes gay pride expresses the LGBTQ community's identity and collective strength; pride parades provide both a prime example of the use and a demonstration of the general meaning of the term. The LGBTQ community is diverse in political affiliation. Not all people who are lesbian, gay, bisexual, or transgender consider themselves part of the LGBTQ community.
The Kinsey scale, also called the Heterosexual–Homosexual Rating Scale, is used in research to describe a person's sexual orientation based on one's experience or response at a given time. The scale typically ranges from 0, meaning exclusively heterosexual, to a 6, meaning exclusively homosexual. In both the male and female volumes of the Kinsey Reports, an additional grade, listed as "X", indicated "no socio-sexual contacts or reactions" (asexuality). The reports were first published in Sexual Behavior in the Human Male (1948) by Alfred Kinsey, Wardell Pomeroy, and others, and were also prominent in the complementary work Sexual Behavior in the Human Female (1953).
Biphobia is aversion toward bisexuality or people who are identified or perceived as being bisexual. Similarly to homophobia, it refers to hatred and prejudice specifically against those identified or perceived as being in the bisexual community. It can take the form of denial that bisexuality is a genuine sexual orientation, or of negative stereotypes about people who are bisexual. Other forms of biphobia include bisexual erasure. Biphobia may also avert towards other sexualities attracted to multiple genders such as pansexuality or polysexuality, as the idea of being attracted to multiple genders is generally the cause of stigma towards bisexuality.
The field of psychology has extensively studied homosexuality as a human sexual orientation. The American Psychiatric Association listed homosexuality in the DSM-I in 1952 as a "sociopathic personality disturbance," but that classification came under scrutiny in research funded by the National Institute of Mental Health. That research and subsequent studies consistently failed to produce any empirical or scientific basis for regarding homosexuality as anything other than a natural and normal sexual orientation that is a healthy and positive expression of human sexuality. As a result of this scientific research, the American Psychiatric Association removed homosexuality from the DSM-II in 1973. Upon a thorough review of the scientific data, the American Psychological Association followed in 1975 and also called on all mental health professionals to take the lead in "removing the stigma of mental illness that has long been associated" with homosexuality. In 1993, the National Association of Social Workers adopted the same position as the American Psychiatric Association and the American Psychological Association, in recognition of scientific evidence. The World Health Organization, which listed homosexuality in the ICD-9 in 1977, removed homosexuality from the ICD-10 which was endorsed by the 43rd World Health Assembly on 17 May 1990.
Societal attitudes toward homosexuality vary greatly across different cultures and historical periods, as do attitudes toward sexual desire, activity and relationships in general. All cultures have their own values regarding appropriate and inappropriate sexuality; some sanction same-sex love and sexuality, while others may disapprove of such activities in part. As with heterosexual behaviour, different sets of prescriptions and proscriptions may be given to individuals according to their gender, age, social status or social class.
Obtaining precise numbers on the demographics of sexual orientation is difficult for a variety of reasons, including the nature of the research questions. Most of the studies on sexual orientation rely on self-reported data, which may pose challenges to researchers because of the subject matter's sensitivity. The studies tend to pose two sets of questions. One set examines self-report data of same-sex sexual experiences and attractions, while the other set examines self-report data of personal identification as homosexual or bisexual. Overall, fewer research subjects identify as homosexual or bisexual than report having had sexual experiences or attraction to a person of the same sex. Survey type, questions and survey setting may affect the respondents' answers.
A sexual minority is a demographic whose sexual identity, orientation or practices differ from the majority of the surrounding society. Primarily used to refer to lesbian, gay, bisexual, or non-heterosexual individuals, it can also refer to transgender, non-binary or intersex individuals.
LGBTQ stereotypes are stereotypes about lesbian, gay, bisexual, transgender, and queer (LGBTQ) people based on their sexual orientations, gender identities, or gender expressions. Stereotypical perceptions may be acquired through interactions with parents, teachers, peers and mass media, or, more generally, through a lack of firsthand familiarity, resulting in an increased reliance on generalizations.
Homosexuality is sexual attraction, romantic attraction, or sexual behavior between members of the same sex or gender. As a sexual orientation, homosexuality is "an enduring pattern of emotional, romantic, and/or sexual attractions" exclusively to people of the same sex or gender. It "also refers to a person's sense of identity based on those attractions, related behaviors, and membership in a community of others who share those attractions."
Bisexual erasure, also called bisexual invisibility, is the tendency to ignore, remove, falsify, or re-explain evidence of bisexuality in history, academia, the news media, and other primary sources.
Same-sex parenting is the parenting of children by same-sex couples generally consisting of gays or lesbians who are often in civil partnerships, domestic partnerships, civil unions, or same-sex marriages.
The questioning of one's sexual orientation, sexual identity, gender, or all three is a process of exploration by people who may be unsure, still exploring, or concerned about applying a social label to themselves for various reasons. The letter "Q" is sometimes added to the end of the acronym LGBT ; the "Q" can refer to either queer or questioning.
A same-sex relationship is a romantic or sexual relationship between people of the same sex. Same-sex marriage refers to the institutionalized recognition of such relationships in the form of a marriage; civil unions may exist in countries where same-sex marriage does not.
Various issues in medicine relate to lesbian, gay, bisexual, transgender and queer (LGBTQ) people. According to the US Gay and Lesbian Medical Association (GLMA), besides HIV/AIDS, issues related to LGBTQ health include breast and cervical cancer, hepatitis, mental health, substance use disorders, alcohol use, tobacco use, depression, access to care for transgender persons, issues surrounding marriage and family recognition, conversion therapy, refusal clause legislation, and laws that are intended to "immunize health care professionals from liability for discriminating against persons of whom they disapprove."
Bisexuality is a romantic or sexual attraction or behavior toward both males and females, to more than one gender, or to both people of the same gender and different genders. It may also be defined to include romantic or sexual attraction to people regardless of their sex or gender identity, which is also known as pansexuality.
Sexual fluidity is one or more changes in sexuality or sexual identity. Sexual orientation is stable for the vast majority of people, but some research indicates that some people may experience change in their sexual orientation, and this is slightly more likely for women than for men. There is no scientific evidence that sexual orientation can be changed through psychotherapy. Sexual identity can change throughout an individual's life, and does not have to align with biological sex, sexual behavior, or actual sexual orientation.
The following outline offers an overview and guide to LGBTQ topics:
While LGBT people are often defined by society for their lack of heterosexual relationships, heterosexual relationships among them are fairly common.
{{cite book}}
: |author1=
has generic name (help)The Ellison and Gunstone online survey (2009) for the Commission of over 5,000 people indicates that all methods involving interviewing in a person's home, whether face-to-face or by telephone, may incur misreporting, especially when another person is present. Respondents report that they would be least likely to conceal their sexual orientation (by switching to another sexual orientation category) when self-completion online surveys are used.
{{cite web}}
: |last=
has generic name (help){{cite web}}
: |last=
has generic name (help)