Based on 2020 American Community Survey estimates, 1,934,397 individuals identified as having British ancestry, while a further 25,213,619 identified as having English ancestry, 5,298,861 Scottish ancestry and 1,851,256 Welsh ancestry. The total of these groups, at 34,298,133, was 10.5% of the total population. A further 31,518,129 individuals identified as having Irish ancestry, but this is not differentiated between modern Northern Ireland (part of the United Kingdom) and the Republic of Ireland, which was part of the United Kingdom during the greatest phase of Irish immigration. Figures for Manx and Cornish ancestries are not separately reported, although Manx was reported prior to 1990, numbering 9,220 on the 1980 census, and some estimates put Cornish ancestry as high as 2 million. This figure also does not include people reporting ancestries in countries with majority or plurality British ancestries, such as Canadian, South African, New Zealander (21,575) or Australian (105,152).[4] There has been a significant drop overall, especially from the 1980 census where 49.59 million people reported English ancestry and larger numbers reported Scottish, Welsh and Northern Irish ancestry also.
Demographers regard current figures as a "serious under-count", as a large proportion of Americans of British descent have a tendency to simply identify as 'American' since 1980 where over 13.3 million or 5.9% of the total U.S. population self-identified as "American" or "United States", this was counted under "not specified".[5] This response is highly overrepresented in the Upland South, a region settled historically by the British.[6][7][8][9][10][11] Those of mixed European ancestry may identify with a more recent and differentiated ethnic group.[12] Of the top ten family names in the United States (2010), seven have English origins or having possible mixed British Isles heritage (such as Welsh, Scottish or Cornish), the other three being of Spanish origin.[13]
Not to be confused are cases when the term is also used in an entirely different (although possibly overlapping) sense to refer to people who are dual citizens of both the United Kingdom and the United States.[citation needed]
Americans of British heritage are often seen, and identify, as simply "American" due to the many historic, linguistic and cultural ties between Great Britain and the U.S. and their influence on the country's population. A leading specialist, Charlotte Erickson, found them to be ethnically "invisible".[14] This may be due to the early establishment of British settlements; as well as to non-English groups having emigrated in order to establish significant communities.[15]
Number of British Americans
Table below shows census results between 1980 (when data on ancestry was first collected) and the 2020 census. Response rates for the question on ancestry was 83.1% (1980) 90.4% (1990) and 80.1% (2000) for the total population of the United States.[16][17]
According to estimates by Thomas L. Purvis (1984), published in the European ancestry of the United States, gives the ethnic composition of the American colonies from 1700 to 1755. British ancestry in 1755 was estimated to be 63%, comprising 52% English and Welsh, 7.0% Scots-Irish, and 4% Scottish.[23]
The ancestry of the 3,929,214 population in 1790 has been estimated by various sources by sampling last names in the very first United States official census and assigning them a country of origin.[15] There is debate over the accuracy between the studies with individual scholars and the Federal Government using different techniques and conclusion for the ethnic composition.[27][15] A study published in 1909 titled A Century of Population Growth by the Census Bureau estimated the British origin combined were around 90% of the white population.[28][29][30]
Another source by Thomas L. Purvis in 1984[31] estimated that people of British ancestry made up about 62% of the total population or 74% of the white or European American population.[31] Some 81% of the total United States population was of European heritage.[32] Around 757,208 were of African descent with 697,624 being slaves.[33]
The 1909 Century of Population Growth report came under intense scrutiny in the 1920s; its methodology was subject to criticism over fundamental flaws that cast doubt on the accuracy of its conclusions. The catalyst for controversy had been passage of the Immigration Act of 1924, which imposed numerical quotas on each country of Europe limiting the number of immigrants to be admitted out of a finite total annual pool. The size of each national quota was determined by the National Origins Formula, in part computed by estimating the origins of the colonial stock population descended from White Americans enumerated in the 1790 Census. The undercount of other colonial stocks like German Americans and Irish Americans would thus have contemporary policy consequences. When CPG was produced in 1909, the concept of independent Ireland did not even exist. CPG made no attempt to further classify its estimated 1.9% Irish population to distinguish CelticIrish Catholics of Gaelic Ireland, who in 1922 formed the independent Irish Free State, from the Scotch-Irish descendants of Ulster Scots and Anglo-Irish of the Plantation of Ulster, which became Northern Ireland and remained part of the United Kingdom. In 1927, proposed immigration quotas based on CPG figures were rejected by the President's Committee chaired by the Secretaries of State, Commerce, and Labor, with the President reporting to Congress "the statistical and historical information available raises grave doubts as to the whole value of these computations as the basis for the purposes intended."[26] Among the criticisms of A Century of Population Growth:
CPG failed to account for Anglicization of names, assuming any surname that could be English was actually English
CPG failed to consider first names even when obviously foreign, assuming anyone with a surname that could be English was actually English
CPG failed to consider regional variation in ethnic settlement e.g. surname Root could be assumed English in Vermont (less than 1% German), but more commonly a variant of German Roth in states with large German American populations like populous Pennsylvania (home to more Germans than the entire population of Vermont)
CPG started by classifying all names as Scotch, Irish, Dutch, French, German, Hebrew, or other. All remaining names which could not be classed with one of the 6 other listed nationalities, nor identified by the Census clerk as too exotic to be English, were assumed to be English
CPG classification was an unscientific process by Census clerks with no training in history, genealogy, or linguistics, nor were scholars in those fields consulted
CPG estimates were produced by a linear process with no checks on potential errors nor opportunity for peer review or scholarly revision once an individual clerk had assigned a name to a nationality
Concluding that CPG "had not been accepted by scholars as better than a first approximation of the truth", the Census Bureau commissioned a study to produce new scientific estimates of the colonial American population, in collaboration with the American Council of Learned Societies, in time to be adopted as basis for legal immigration quotas in 1929, and later published in the journal of the American Historical Association, reproduced in the table below. Note: as in the original CPG report, the "English" category encompassed England and Wales, grouping together all names classified as either "Anglican" (from England) or "Cambrian" (from Wales).[26]
The 1980 census was the first that asked people's ancestry.[34] The 1980 United States Census reported 61,327,867 individuals or 31.67% of the total U.S. population self-identified as having British descent. In 1980, 16,418 Americans reported "Northern Islander". No Scots-Irish (descendants of Ulster-Scots) ancestry was recorded, although over ten million people identified as Scottish.[34] This figure fell to over 5 million each in the following census when the Scotch-Irish were first counted.[20]
1990
Over 90.4% of the United States population reported at least one ancestry, 9.6% (23,921,371) individuals as "not stated" with a total of 11.0% being "not specified".[35] Additional responses were Cornish (3,991), Northern Irish 4,009 and Manx 6,317.[35]
2000
Most of the population who stated their ancestry as "American" (20,625,093 or 7.3%) are said to be of old colonial British ancestry.[36]
British AmericansBritish, Irish, and White Americans not identifying ancestry
Geographical distribution
Following are the top 10 highest percentage of people of English, Scottish and Welsh ancestry, in U.S. communities with 500 or more total inhabitants (for the total list of the 101 communities, see references)[38][39][40]
As of 2020, the distribution of British Americans (combined English, Welsh, Scottish, Scotch-Irish, and British ancestry self-identification) across the 50 states and DC is as presented in the following table:
Estimated British American population by state[41][42]
After the Age of Discovery, the British were one of the earliest and largest communities to emigrate out of Europe, and the British Empire's expansion during the latter half of the 18th century, throughout the 19th century and first quarter of the 20th century saw an "extraordinary dispersion of the British people", with particular concentrations "in Australasia and North America", and to some degree into Africa and South Asia.[45]
The British Empire was "built on waves of migration overseas by British people",[46] who left the United Kingdom and "reached across the globe and permanently affected population structures in three continents".[45] As a result of the British colonization of the Americas, what became the United States was "easily the greatest single destination of emigrant British".[45]
An English presence in North America began with the Roanoke Colony and Colony of Virginia in the late-16th century during the reign of Tudor queen Elizabeth I, but the first successful English settlement was established in 1607, on the James River at Jamestown. By the 1610s, an estimated 1,300 English people had travelled to North America, the "first of many millions from the British Isles".[47] In 1620, the Pilgrims established the English imperial venture of Plymouth Colony, beginning "a remarkable acceleration of permanent emigration from England" with over 60% of trans-Atlantic English migrants settling in the New England Colonies.[47] During the 17th century, an estimated 350,000 English, Welsh and Cornish migrants arrived in North America, which in the century after the Acts of Union 1707 was surpassed in rate and number by Scottish and Irish migrants.[48]
The British policy of salutary neglect for its North American colonies intended to minimize trade restrictions as a way of ensuring they stayed loyal to British interests.[49] This permitted the development of the American Dream, a cultural spirit distinct from that of its British founders.[49] The Thirteen Colonies of British America began an armed rebellion with French support against British rule in 1775 when they rejected the right of the Parliament of Great Britain to govern them without representation; they proclaimed their independence in 1776, and subsequently constituted the first thirteen states of the United States of America, which became a sovereign state in 1781 with the ratification of the Articles of Confederation. The 1783 Treaty of Paris represented Great Britain's formal acknowledgment of the United States' sovereignty at the end of the American Revolutionary War.[50]
The vast majority of the Founding Fathers of the United States were of mixed British extraction. Most of them were of English descent, with smaller numbers of those of Scottish, Irish Protestant or Scots-Irish, and Welsh ancestry. A minority were of high social status and can be classified as White Anglo-Saxon Protestant (WASP). Many of the prewar WASP elite were Loyalists who left the new nation, some moving north to the Canadian colonies which remained under British rule.[51]
Nevertheless, longstanding cultural and historical ties have, in more modern times, resulted in the Special Relationship, the exceptionally close political, diplomatic and military co-operation of United Kingdom – United States relations.[56]Linda Colley, a professor of history at Princeton University and specialist in Britishness, suggested that because of their strong colonial influence on the United States, the British find Americans a "mysterious and paradoxical people, physically distant but culturally close, engagingly similar yet irritatingly different".[57]
For over two centuries (1789–2009) of early U.S. history, all Presidents with the exception of two (Van Buren and Kennedy) were descended from the varied colonial British stock, from the Pilgrims and Puritans to the Scotch-Irish and English who settled Appalachia, with more recent presidents such as Joe Biden and Donald Trump having partial British ancestry.[58]
Cultural contributions
Much of American culture shows influences from nation states of British culture. Colonial ties to Great Britain spread the English language, legal system and other cultural attributes.[59] Historian David Hackett Fischer has posited that four major streams of immigration from the British Isles in the colonial era contributed to the formation of a new American culture, summarized as follows:
Fischer's theory acknowledges the presence of other groups of immigrants during the colonial period, both from the British Isles (the Welsh and the Highland Scots) and not (Germans, Dutch, and French Huguenots), but believes that these did not culturally contribute as substantially to the United States as his main four.
Historical influence
Apple pie – New England was the first region to experience large-scale English colonization in the early 17th century, beginning in 1620, and it was dominated by East Anglian Calvinists, better known as the Puritans. Baking was a particular favorite of the New Englanders and was the origin of dishes seen today as quintessentially "American", such as apple pie and the oven-roasted Thanksgiving turkey.[64] "As American as apple pie" is a well-known phrase used to suggest that something is all-American.
Baseball – The earliest recorded game of base-ball for which the original source survives, involved the family of George II of Great Britain, played indoors in London in November 1748. The Prince is reported as playing "Bass-Ball" again in September 1749 in Walton-on-Thames, Surrey, against Lord Middlesex.[66] The English lawyer William Bray wrote in his diary that he had played a game of baseball on Easter Monday 1755 in Guildford, also in Surrey.[67][68] English lawyer William Bray recorded a game of baseball on Easter Monday 1755 in Guildford, Surrey; Bray's diary was verified as authentic in September 2008.[69][70] This early form of the game was apparently brought to North America by British immigrants. The first appearance of the term that exists in print was in "A Little Pretty Pocket-Book" in 1744, where it is called Base-Ball. Today, rounders, which has been played in England since Tudor times, holds a similarity to baseball. Although, literary references to early forms of "base-ball" in the United Kingdom pre-date use of the term "rounders".[71]
In addition to baseball, American football is a sport that developed from soccer and Rugby, which are both sports that originated in the British Isles.[72]
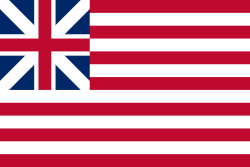
The Continental Union Flag is considered to be the first national flag of the United States.[73] The design consisted of 13 stripes, red and white, representing the original Thirteen Colonies, the canton on the upper left-hand corner bearing the British Union Flag, the red cross of St. George of England with the white cross of St. Andrew of Scotland. The flag was first flown on December 2, 1775, by John Paul Jones (then a Continental Navy lieutenant) on the ship Alfred in Philadelphia).[73]
↑Reynolds Farley, 'The New Census Question about Ancestry: What Did It Tell Us?', Demography, Vol. 28, No. 3 (August 1991), pp. 414, 421.
↑Stanley Lieberson and Lawrence Santi, 'The Use of Nativity Data to Estimate Ethnic Characteristics and Patterns', Social Science Research, Vol. 14, No. 1 (1985), pp. 44–6.
↑Stanley Lieberson and Mary C. Waters, 'Ethnic Groups in Flux: The Changing Ethnic Responses of American Whites', Annals of the American Academy of Political and Social Science, Vol. 487, No. 79 (September 1986), pp. 82–86.
↑Mary C. Waters, Ethnic Options: Choosing Identities in America (Berkeley: University of California Press, 1990), p. 36.
↑Szucs, Loretto Dennis; Luebking, Sandra Hargreaves (2006). The Source. Ancestry Publishing. p.361. ISBN9781593312770. Retrieved March 17, 2015. English US census 1790.
↑Richard D. Brown, "The Founding Fathers of 1776 and 1787: A collective view." William and Mary Quarterly (1976) 33#3: 465–480, especially pp 466, 478–79. online
↑James, Wither (March 2006), "An Endangered Partnership: The Anglo-American Defence Relationship in the Early Twenty-first Century", European Security, 15 (1): 47–65, doi:10.1080/09662830600776694, ISSN0966-2839, S2CID154879821
↑In 1584 Sir Walter Raleigh sent Philip Amadas and Arthur Barlowe to lead an exploration of what is now the North Carolina coast, and they returned with word of a regional "king" named "Wingina." This was modified later that year by Raleigh and the Queen to "Virginia", perhaps in part noting her status as the "Virgin Queen." Stewart, George (1945). Names on the Land: A Historical Account of Place-Naming in the United States. New York: Random House. p.22.
Furer, Howard B., ed. The British in America: 1578–1970 (1972).
Handlin, Oscar (1980). Orlov, Ann; Thernstrom, Stephan (eds.). Harvard Encyclopedia of American Ethnic Groups. the standard reference source for all ethnic groups.
McGill, David W., and John K. Pearce. "American families with English ancestors from the colonial era: Anglo Americans." in Ethnicity and family therapy (1996): 451–466; reviews modern social psychology of family types.
Marshall, Peter James (2001). The Cambridge Illustrated History of the British Empire. Cambridge University Press. ISBN978-0-521-00254-7.
Shepperson, Wilbur S. British emigration to North America: projects and opinions in the early Victorian period (1957), examines opinion in Britain. online
Tennenhouse, Leonard. The Importance of Feeling English: American Literature and the British Diaspora, 1750–1850 (2007).
Van Vugt, William E. "British (English, Scottish, Scots Irish, and Welsh) and British Americans, 1870–1940’." in Elliott Barkan, ed., Immigrants in American History: Arrival, Adaptation, and Integration (2013): 4:237+.
Van Vugt, William E. British Buckeyes: The English, Scots, and Welsh in Ohio, 1700–1900 (2006).
This page is based on this Wikipedia article Text is available under the CC BY-SA 4.0 license; additional terms may apply. Images, videos and audio are available under their respective licenses.