National Origins Formula

Last updated

The National Origins Formula is an umbrella term for a series of qualitative immigration quotas in America used from 1921 to 1965, which restricted immigration from the Eastern Hemisphere on the basis of national origin. These restrictions included legislation and federal acts. Since there is no one formula that can account for each law or restriction across the decades, as the scale, variables, and demographic characteristics change per law, the concept of National Origins Formula is best described as a collection of quantitative data considerations in immigration and migration laws in the United States. [1]

Contents

History

Temporary measures establishing quota limits per country based on the makeup of the foreign-born population residing in the U.S. were introduced in 1921 (Emergency Quota Act) and 1924 (Immigration Act of 1924); these were replaced by a permanent quota system based on each nationality's share of the total U.S. population as of 1920, which took effect on July 1, 1929 and governed American immigration law until December 1, 1965 (when the Immigration and Nationality Act of 1965 abolished it). The National Origins Formula aimed to preserve the existing ethnic proportions of the population as calculated according to data from the 1920 Census of Population. [2] [3] [4]

The 1921 Emergency Quota Act restricted immigration to 3% of foreign-born persons of each nationality that resided in the United States in 1910.[ citation needed ]

The Immigration Act of 1924, also called the National Origins Act, provided that for three years the formula would change from 3% to 2% and the basis for the calculation would be the census of 1890 instead of that of 1910. After June 30, 1927, total immigration from all countries will be limited to 150,000, with allocations by country based upon national origins of inhabitants according to the census of 1920. The quota system applied only to non-Asian immigrants. It aimed to reduce the overall number of unskilled immigrants, to allow families to re-unite, and to prevent immigration from changing the ethnic distribution of the population. The 1924 Act also included the Asian Exclusion Act, which limited immigration to persons eligible for naturalization. As a result, East Asians and South Asians were effectively banned from immigrating. Africans were also subjected to severe restrictions. [5] Immigration from North and South America was not restricted.[ citation needed ]

National origins computation

National Origins Formula quota calculation process under the Immigration Act of 1924.png
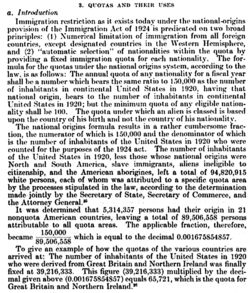
Introduction to the process of National Origins Formula quota computation as prescribed by subsections (b), (c), (d) of §11 of the Immigration Act of 1924, in a 1950 report by a Senate Committee chaired by Pat McCarran. Describing the formula in effect since 1929 as “cumbersome”, the consequent 1952 McCarran–Walter Act adopted a simplified formula intended to arrive at roughly-equivalent results. [6]
National Origins of the White Population of the USA, 1920.png
National origins of the white population of the United States in 1920, computed for apportionment of annual immigration quotas according to National Origins Formula, as prescribed by §11(c) of the Immigration Act of 1924. About 45% of white Americans were deemed of colonial stock, 21.6% were grandchildren and later generations of post-colonial immigrants, and 1/3 were immigrants or children of immigrants in 1920. [7]
White Americans by National Origin in the 1790 Census (1909 CPG and 1929 ACLS estimates).png
National origins of European Americans in 1790, according to a preliminary government estimate in 1909 Census Bureau report A Century of Population Growth (top half) and revised scholarly estimates produced in collaboration with the American Council of Learned Societies in time for fiscal year 1929 (bottom half). [8] The 1909 figures were first accepted for quota calculation in 1926, but the accuracy came under scrutiny for using an unscientific methodology that significantly overestimated the English share of the population—the primary reason the quota formula due to take effect in 1927 pursuant to §11(b) was delayed for two years until more precise revised estimates were available, given their importance as basis for calculating the origins of the total national stock. [9]

Under the Immigration Act of 1924, the Bureau of the Census and Department of Commerce were tasked with estimating the National Origins of the White Population of the United States in 1920 in numbers, then calculating the percentage share each nationality made up as a fraction of the total. The National Origins Formula derived quotas by calculating the equivalent proportion of each nationality out of a total pool of 150,000 annual quota immigrants. This formula was used until the Immigration and Nationality Act of 1952 adopted a simplified formula limiting each country to a quota of one-sixth of one percent of that nationality's 1920 population count, with a minimum quota of 100. [10] [3] [4]

The formula required classification of the national origins by birth or ancestry of all white Americans, except those having origins in the nonquota countries of the Western Hemisphere. The total white American population in 1920 was estimated at 94,820,915. White Americans with origins in the Western Hemisphere were estimated at 5,314,357—approximately 4,085,000 from Canada and Newfoundland; 1,126,000 from Mexico; 66,000 from the West Indies; and 37,000 from Central and South America. This left the total relevant population for the quota calculation formula at 89,506,558.[ citation needed ]

To compute the proportions of blood each national origin had contributed to the American population as of 1920, demographers divided the population into four more easily classifiable groups by generation. The process was complicated due to the more limited set of data recorded in the country's earlier decades compared to the increasingly detailed information published in later versions of the United States census. 49,182,158 were deemed to be of immigrant stock, accounting for 55% of the total, subdivided into three categories. The easiest to classify were the two most recently-arrived generations of immigrants, accounting for 1/3 of the 1920 total: [11]

Colonial stock estimation

Calculation of the colonial stock proved challenging, and delayed formula implementation from 1927 to 1929. The 1790 Census recorded a total of 3,172,444 European Americans; their 40,324,400 colonial stock descendants in 1920 were allocated into national origin blocs proportional to the ratio of nationalities that had existed in the 1790 population, adjusted to account for natural growth as of 1920.

The national origins of the colonial stock had to be estimated by careful analysis of the limited information recorded in the first U.S. Census: scholarly classification of the approximately 30,000 unique names of white heads of families recorded in the 1790 Census into their respective national stocks. [9]

In 1924, the only Census Bureau estimate of colonial stock makeup had been published more than a decade prior in 1909 report A Century of Population Growth, which put the 1790 population at 82.1% English (incl. Welsh), 7.0% Scotch, 1.9% Irish, 2.5% Dutch, 0.6% French and 5.6% German. [8] When CPG was produced in 1909, the concept of independent Ireland did not even exist. CPG made no attempt to further classify its estimated 1.9% Irish population to distinguish Celtic Irish Catholics of Gaelic Ireland, who in 1922 formed the independent Irish Free State, from the Scotch-Irish descendants of Ulster Scots and Anglo-Irish of the Plantation of Ulster, which became Northern Ireland and remained part of the United Kingdom. Unlike in 1909, the undercount of other colonial stock populations like German Americans and Irish Americans would now have real contemporary policy consequences. In 1927, proposed immigration quotas based on CPG figures were rejected by the President's Committee chaired by the Secretaries of State, Commerce, and Labor, with the President reporting to Congress "the statistical and historical information available raises grave doubts as to the whole value of these computations as the basis for the purposes intended." [9]

Among further criticisms of A Century of Population Growth figures:

Concluding that CPG "had not been accepted by scholars as better than a first approximation of the truth", the Census Bureau commissioned a more accurate academic analysis, collaborating with the American Council of Learned Societies, and later published in the journal of the American Historical Association. The revised figures of the Report of the Committee on Linguistic and National Stocks in the Population of the United States put the 1790 population at 60.1% English (incl. Welsh), 8.1% Scotch, 5.9% Scotch Irish (Ulster), 3.6% Irish (Free State), 8.6% German, 3.1% Dutch, 2.3% French, 0.7% Swedish (incl. Finnish), 0.8% Spanish, and 6.8% unassigned, later distributed to fit the reshaped political geography of 1920s Europe. The proportional national divisions of European Americans of colonial people in 1790 was applied to the descendent population of 1920 to complete computations in time for the national origins formula quotas to take effect in 1929. [9] [11]

White Americans by national origin in 1920

The National Origins Formula was a unique computation (not comparable with e.g. self-reported ancestries in the decennial U.S. Census or annual American Community Survey), which sought to determine the degree of 'blood' each national origin had contributed to the total white American population (in scientific terms, the genetic contribution of each nation), acknowledging the reality of centuries of intermarriage among European Americans of different ethnicities from all corners of Europe since the earliest settlements of the New World. The numbers do not purport to represent 'pure' discrete individuals of monoethnic backgrounds. Rather the figures reflect how the population would have naturally grown if each succeeding generation from the 1790 colonial stock had only mated endogamously among their own co-ethnics in the subsequent 130 years, estimating the diffusion of 'blood' among white Americans as a collective whole. In reality, exogamy was common with many white Americans being of mixed European ancestries (measuring 'blood' in modern parlance akin to DNA test results measuring an individual's ancestral makeup, applied to a population. [lower-alpha 1] ) [11]

Country of originTotalColonial stockPostcolonial stock
TotalImmigrantsChildren ofGrandchildren of
#%#%#%#%#%#%
Flag of Austria.svg  Austria 843,0510.89%14,1100.03%828,9511.55%305,6572.23%414,7942.16%108,5000.53%
Flag of Belgium (civil).svg  Belgium 778,3280.82%602,3001.46%176,0280.33%62,6860.46%62,0420.32%51,3000.25%
Flag of the Czech Republic.svg  Czechoslovakia 1,715,1281.81%54,7000.13%1,660,4283.10%559,8954.08%903,9334.71%196,6000.95%
Flag of Denmark.svg  Denmark 704,7830.74%93,2000.23%611,5831.14%189,9341.39%277,1491.44%144,5000.70%
Flag of Estonia.svg  Estonia 69,0130.07%-69,0130.13%33,6120.25%28,0010.15%7,4000.04%
Flag of Finland.svg  Finland 339,4360.36%4,3000.01%335,1360.63%149,8241.09%146,6120.76%38,7000.19%
Flag of France.svg  France 1,841,6891.94%767,1001.86%1,074,5892.01%155,0191.13%325,2701.69%594,3002.88%
Flag of Germany.svg  Germany 15,488,61516.33%3,036,8007.36%12,451,81523.26%1,672,37512.20%4,051,24021.11%6,728,20032.61%
State flag of Greece (1863-1924;1935-73).svg  Greece 182,9360.19%-182,9360.34%135,1460.99%46,8900.24%9000.00%
Flag of Hungary (1915-1918, 1919-1946).svg  Hungary 518,7500.55%-518,7500.97%318,9772.33%183,7730.96%16,0000.08%
Flag of Ireland.svg  Ireland 10,653,33411.24%1,821,5004.41%8,831,83416.50%820,9705.99%2,097,66410.93%5,913,20028.66%
Flag of Italy (1861-1946).svg  Italy 3,462,2713.65%-3,462,2716.47%1,612,28111.76%1,671,4908.71%178,5000.87%
Flag of Latvia.svg  Latvia 140,7770.15%-140,7770.26%69,2770.51%56,0000.29%15,5000.08%
Flag of Lithuania.svg  Lithuania 230,4450.24%-230,4450.43%117,0000.85%88,6450.46%24,8000.12%
Flag of the Netherlands.svg  Netherlands 1,881,3591.98%1,366,8003.31%514,5590.96%133,4780.97%205,3811.07%175,7000.85%
Flag of Norway.svg  Norway 1,418,5921.50%75,2000.18%1,343,3922.51%363,8622.65%597,1303.11%382,4001.85%
Flag of Poland.svg  Poland 3,892,7964.11%8,6000.02%3,884,1967.26%1,814,42613.23%1,779,5709.27%290,2001.41%
Flag of Portugal.svg  Portugal 262,8040.28%23,7000.06%239,1040.45%104,0880.76%105,4160.55%29,6000.14%
Flag of Romania.svg  Romania 175,6970.19%-175,6970.33%88,9420.65%83,7550.44%3,0000.02%
Flag of Russian Empire (1914-1917).svg  Russia 1,660,9541.75%4,3000.01%1,656,6543.09%767,3245.60%762,1303.97%127,2000.62%
Flag of Spain.svg  Spain 150,2580.16%38,4000.09%111,8580.21%50,0270.36%24,5310.13%37,3000.18%
Flag of Sweden.svg  Sweden 1,977,2342.09%217,1000.53%1,760,1343.29%625,5804.56%774,8544.04%359,7001.74%
Flag of Switzerland (Pantone).svg   Switzerland 1,018,7061.07%388,9000.94%629,8061.18%118,6590.87%203,5471.06%307,6001.49%
Flag of Syria French mandate.svg  Syria & Lebanese French flag.svg Lebanon 73,4420.08%-73,4420.14%42,0390.31%31,4030.16%-
Flag of Turkey.svg  Turkey 134,7560.14%-134,7560.25%102,6690.75%31,4870.16%6000.00%
Flag of the United Kingdom.svg  United Kingdom 39,216,33341.36%31,803,90077.02%7,412,43313.85%1,365,3149.96%2,308,41912.03%3,738,70018.12%
Flag of Yugoslavia (1918-1943).svg  Yugoslavia 504,2030.53%-504,2030.94%220,6681.61%265,7351.38%17,8000.09%
Other Countries170,8680.18%3,5000.01%167,3680.31%71,5530.52%93,8150.49%2,0000.01%
All Quota Countries89,506,558100.00%40,324,40045.05%49,182,15854.95%12,071,28213.49%17,620,67619.69%19,490,20021.78%
Nonquota Countries5,314,3575.60%964,1702.34%4,350,1878.13%1,641,47211.97%1,569,6968.18%1,139,0195.52%
1920 Flag of the United States (1912-1959).svg  USA Total94,820,915100.00%41,288,57043.54%53,532,34556.46%13,712,75414.46%19,190,37220.24%20,629,21921.76%
  1. For example, 1 'person' in the count of British colonial stock descent in 1920 could in actuality be 4 White Americans who each shared 1 grandparent descended purely from 1790 British colonial stock, thus making each of the 4 individuals ¼ British colonial stock by genetic ancestry; the 'blood' did not disappear from the population but was dispersed at the individual level. The numbers presented could therefore be better understood as units of 'blood' inherited from the different national stocks flowing through the veins of the White American population.

Quota calculation formula

The national origins formula prescribed by the Immigration Act of 1924, effective 1929, capped total annual quota immigration from outside the Western Hemisphere at 150,000. The quota for each country was to be computed as a fraction of 150,000 in a ratio proportional to the number of U.S. inhabitants of each national origin as a share of total inhabitants in 1920, with a minimum quota of 100. Due to the minimum rounding up the quotas for all countries that would not have otherwise reached 100, in practice the annual global quota total was slightly more than 150,000 (in 1930 totaling 153,714), but the formula calculation still used the fixed number 150,000. [ citation needed ]

The total number of U.S. inhabitants in 1920 with national origins in quota countries was 89,506,558 so the national origins formula f expressed mathematically as f = n/89,506,558 = q/150,000, where n is the number of inhabitants of any given national origin and q is the quota, hence to convert n into q required multiplication of n by 150,000/89,506,558 = 0.001675854857.

For example, the number of U.S. inhabitants in 1920 who were derived from the United Kingdom was fixed at 39,216,333 so the formula f = 39,216,333/89,506,558 = q/150,000. The formula could thus be solved for q as:

Or the formula could be solved to compute the quota by converting the fraction for the national origin into decimal form, then multiplying to take the equivalent percentage share of 150,000:

The table below lists the number of U.S. inhabitants of each national origin in 1920, and their fractional share of the total quota population expressed in percentage form to three decimal points.

The revised national origins formula prescribed by the Immigration and Nationality Act of 1952, effective 1953, was simplified to multiply n by 1/6 of 1% (equivalent to decimal 0.00166666666̅) to arrive at roughly equivalent (but slightly reduced) quotas by a much streamlined process e.g.

Country of originPopulation countPercentage share
Flag of Austria.svg  Austria 843,0510.942%
Flag of Belgium (civil).svg  Belgium 778,3280.869%
Flag of the Czech Republic.svg  Czechoslovakia 1,715,1281.916%
Flag of Denmark.svg  Denmark 704,7830.788%
Flag of Estonia.svg  Estonia 69,0130.077%
Flag of Finland.svg  Finland 339,4360.379%
Flag of France.svg  France 1,841,6892.058%
Flag of Germany.svg  Germany 15,488,61517.305%
State flag of Greece (1863-1924;1935-73).svg  Greece 182,9360.204%
Flag of Hungary (1915-1918, 1919-1946).svg  Hungary 518,7500.580%
Flag of Ireland.svg  Ireland 10,653,33411.902%
Flag of Italy (1861-1946).svg  Italy 3,462,2713.868%
Flag of Latvia.svg  Latvia 140,7770.158%
Flag of Lithuania.svg  Lithuania 230,4450.257%
Flag of the Netherlands.svg  Netherlands 1,881,3592.102%
Flag of Norway.svg  Norway 1,418,5921.585%
Flag of Poland.svg  Poland 3,892,7964.349%
Flag of Portugal.svg  Portugal 262,8040.294%
Flag of Romania.svg  Romania 175,6970.197%
Flag of Russian Empire (1914-1917).svg  Russia 1,660,9541.856%
Flag of Spain.svg  Spain 150,2580.168%
Flag of Sweden.svg  Sweden 1,977,2342.209%
Flag of Switzerland (Pantone).svg   Switzerland 1,018,7061.138%
Flag of Syria French mandate.svg  Syria / Lebanese French flag.svg  Lebanon 73,4420.082%
Flag of Turkey.svg  Turkey 134,7560.151%
Flag of the United Kingdom.svg  United Kingdom 39,216,33343.814%
Flag of Yugoslavia (1918-1943).svg  Yugoslavia 504,2030.563%
1920 Flag of the United States (1912-1959).svg  USA Total89,506,558100.000%

Under the Immigration and Nationality Act of 1965, quotas were temporarily retained, but all unused quota spots each year were pooled and made available to other countries effective December 1, 1965. The National Origins Formula fully ended on July 1, 1968, replaced by simple broad numerical limitations of 120,000 from the Western Hemisphere and 170,000 from the Eastern Hemisphere, with no more than 20,000 from any one country, limits in place until the Immigration Act of 1990. [4] [12]

Quotas by country under successive laws

Listed below are historical quotas on immigration from the Eastern Hemisphere, by country, as applied in given fiscal years ending June 30, calculated according to successive immigration laws and revisions from the Emergency Quota Act of 1921 to the final quota year of 1965. The 1922 and 1925 systems based on dated census records of the foreign-born population were intended as temporary measures; the full National Origins Formula based on the 1920 Census of the U.S. population took effect on July 1, 1929. [13] [14] [10] [3] [4] [2]

Annual National Quota Act of 1921 Act of 1924 Act of 1952
1922 [lower-alpha 1] %1925 [lower-alpha 2] %1930 [lower-alpha 3] %1965 [lower-alpha 4] %
Flag of Albania (1920-1926).svg  Albania 2880.08%1000.06%1000.07%1000.06%
Flag of Armenia.svg  Armenia 2300.06%1240.08%1000.07%1000.06%
Flag of Austria.svg  Austria 7,4512.08%7850.48%1,4130.92%1,4050.89%
Flag of Belgium (civil).svg  Belgium 1,5630.44%5120.31%1,3040.85%1,2970.82%
Flag of Bulgaria.svg  Bulgaria 3020.08%1000.06%1000.07%1000.06%
Flag of the Czech Republic.svg  Czechoslovakia 14,3574.01%3,0731.87%2,8741.87%2,8591.80%
Flag of the Free City of Danzig.svg  Danzig 3010.08%2280.14%1000.07%
Flag of Denmark.svg  Denmark 5,6191.57%2,7891.69%1,1810.77%1,1750.74%
Flag of Estonia.svg  Estonia 1,3480.38%1240.08%1160.08%1150.07%
Flag of Finland.svg  Finland 3,9211.10%4710.29%5690.37%5660.36%
Flag of the Free State of Fiume.svg  Fiume 710.02%
Flag of France.svg  France 5,7291.60%3,9542.40%3,0862.01%3,0691.94%
Flag of Germany.svg  Germany 67,60718.90%51,22731.11%25,95716.89%25,81416.28%
Flag of Greece (1822-1978).svg  Greece 3,2940.92%1000.06%3070.20%3080.19%
Flag of Hungary (1915-1918, 1919-1946).svg  Hungary 5,6381.58%4730.29%8690.57%8650.55%
Flag of Iceland (1918-1944).svg  Iceland 750.02%1000.06%1000.07%1000.06%
Flag of Ireland.svg  Ireland [lower-alpha 5] 28,56717.35%17,85311.61%17,75611.20%
Flag of Italy (1861-1946).svg  Italy 42,05711.75%3,8542.34%5,8023.77%5,6663.57%
Flag of Latvia.svg  Latvia 1,5400.43%1420.09%2360.15%2350.15%
Flag of Lithuania.svg  Lithuania 2,4600.69%3440.21%3860.25%3840.24%
Flag of Luxembourg.svg  Luxembourg 920.03%1000.06%1000.07%1000.06%
Flag of the Netherlands.svg  Netherlands 3,6071.01%1,6481.00%3,1532.05%3,1361.98%
Flag of Norway.svg  Norway 12,2023.41%6,4533.92%2,3771.55%2,3641.49%
Flag of Poland.svg  Poland 31,1468.70%5,9823.63%6,5244.24%6,4884.09%
Flag of Portugal.svg  Portugal 2,4650.69%5030.31%4400.29%4380.28%
Flag of Romania.svg  Romania 7,4192.07%6030.37%2950.19%2890.18%
Flag of the Russian SFSR.svg  Russia / Flag of the USSR (1936-1955).svg  Soviet Union [lower-alpha 6] 24,4056.82%2,2481.37%2,7841.81%2,6971.70%
Flag of Spain.svg  Spain 9120.25%1310.08%2520.16%2500.16%
Flag of Sweden.svg  Sweden 20,0425.60%9,5615.81%3,3142.16%3,2952.08%
Flag of Switzerland (Pantone).svg   Switzerland 3,7521.05%2,0811.26%1,7071.11%1,6981.07%
Flag of Turkey.svg  Turkey 2,3880.67%1000.06%2260.15%2250.14%
Flag of the United Kingdom.svg  United Kingdom [lower-alpha 5] 77,34221.62%34,00720.65%65,72142.76%65,36141.22%
Flag of Yugoslavia (1946-1992).svg  Yugoslavia 6,4261.80%6710.41%8450.55%9420.59%
Flag of Australia (converted).svg  Australia and Flag of New Zealand.svg  New Zealand 3590.10%2210.13%2000.13%7000.44%
Total from Europe 356,13599.53%161,54698.10%150,59197.97%149,69794.41%
Total from Asia 1,0660.30%1,3000.79%1,3230.86%3,6902.33%
Total from Africa 1220.03%1,2000.73%1,2000.78%4,2742.70%
Total from all Countries357,803100.00%164,667100.00%153,714100.00%158,561100.00%
  1. Quota per country limited to 3% of the number of foreign-born persons of that nationality residing in the U.S. in the 1910 census (FY 1922-1924)
  2. Quota per country limited to 2% of the number of foreign-born persons of that nationality residing in the U.S. in the 1890 census (FY 1925-1929)
  3. Quota per nationality limited to a percentage share of 150,000 in a ratio proportional to the number of U.S. inhabitants of that national origin as a share of all U.S. inhabitants in the 1920 census (FY 1930-1952)
  4. Quota per nationality limited to one-sixth of 1% of the number of U.S. inhabitants of that national origin in the 1920 census (FY 1953-1965)
  5. 1 2 From 1921 to 1924, quota for the United Kingdom of Great Britain and Ireland encompassed all of Ireland; after 1925, only Northern Ireland, with a separate quota created for the Irish Free State
  6. U.S.S.R. excluding regions falling under the Asiatic Barred Zone while in effect

Relaxation and abolition

The Immigration and Nationality Act of 1952 retained but relaxed the National Origins Formula. It modified the ratios to be based on the 1920 census and eliminated racial restrictions, but retained restrictions by national origin. President Harry Truman vetoed it because of its continued use of national quotas, but the Act was passed over his veto. The quotas were in addition to 600,000 refugees admitted from Europe after World War II. [15]

The National Origins Formula was abolished by the Immigration and Nationality Act of 1965, which introduced a system with one quota for the Western Hemisphere, and one for the Eastern Hemisphere. It marked a significant change in American immigration policy.[ citation needed ]

See also

Notes

  1. "Milestones: 1921–1936 - Office of the Historian". history.state.gov. Retrieved 2022-03-31.
  2. 1 2 Beaman, Middleton (July 1924). "CURRENT LEGISLATION: The Immigration Act of 1924". American Bar Association Journal. American Bar Association. 10 (7): 490–492. JSTOR   25709038 . Retrieved August 10, 2021.
  3. 1 2 3 "Statistical Abstract of the United States: 1931" (PDF) (53rd ed.). Washington, D.C.: U.S. Department of Commerce, Bureau of Foreign and Domestic Commerce. August 1931: 103–107. Archived from the original (PDF) on March 29, 2021. Retrieved August 10, 2021.{{cite journal}}: Cite journal requires |journal= (help)
  4. 1 2 3 4 "Statistical Abstract of the United States: 1966" (PDF). Statistical Abstract of the United States ...: Finance, Coinage, Commerce, Immigration, Shipping, the Postal Service, Population, Railroads, Agriculture, Coal and Iron (87th ed.). Washington, D.C.: U.S. Bureau of the Census: 89–93. July 1966. ISSN   0081-4741. LCCN   04-018089. OCLC   781377180. Archived from the original (PDF) on March 28, 2021. Retrieved August 9, 2021.
  5. "Who Was Shut Out?". Archived from the original on 2015-12-16. Retrieved 2014-10-05.
  6. U.S. Senate Committee on the Judiciary (April 20, 1950). Investigation of the Immigration and Naturalization Systems of the United States (PDF) (Report). Washington, D.C.: U.S. Government Printing Office. pp. 370–569. Senate Report № 81-1515. Archived from the original (PDF) on September 11, 2022. Retrieved September 16, 2022.
  7. U.S. Senate Committee on the Judiciary (April 20, 1950). Investigation of the Immigration and Naturalization Systems of the United States (PDF) (Report). Washington, D.C.: U.S. Government Printing Office. pp. 768–925. Senate Report № 81-1515. Archived from the original (PDF) on September 8, 2022. Retrieved September 16, 2022.
  8. 1 2 Rossiter, W. S. (1909). "Chapter XI. NATIONALITY AS INDICATED BY NAMES OF HEADS OF FAMILIES REPORTED AT THE FIRST CENSUS". A Century of Population Growth. From the First to the Twelfth Census of the United States: 1790-1900 (PDF). Washington, D.C.: U.S. Bureau of the Census. pp. 116–124. Archived from the original (PDF) on September 10, 2022. Retrieved September 16, 2022.
  9. 1 2 3 4 American Council of Learned Societies. Committee on Linguistic and National Stocks in the Population of the United States (1932). Report of the Committee on Linguistic and National Stocks in the Population of the United States. Washington, D.C.: U.S. Government Printing Office. OCLC   1086749050.
  10. 1 2 "Statistical Abstract of the United States: 1930" (PDF) (52nd ed.). Washington, D.C.: U.S. Department of Commerce, Bureau of Foreign and Domestic Commerce. July 1930: 102–105. Archived from the original (PDF) on March 26, 2021. Retrieved August 9, 2021.{{cite journal}}: Cite journal requires |journal= (help)
  11. McKee, Jesse O. (2000). Ethnicity in Contemporary America: A Geographical Appraisal. Lanham, MD: Rowman & Littlefield. pp. 19–37. ISBN   9780742500341. OCLC   42968100 . Retrieved September 22, 2022 via Google Books.
  12. "Statistical Abstract of the United States: 1922" (PDF) (45th ed.). Washington, D.C.: U.S. Department of Commerce, Bureau of Foreign and Domestic Commerce. July 1923: 100–101. Archived from the original (PDF) on March 29, 2021. Retrieved August 10, 2021.{{cite journal}}: Cite journal requires |journal= (help)
  13. "Statistical Abstract of the United States: 1924" (PDF) (47th ed.). Washington, D.C.: U.S. Department of Commerce, Bureau of Foreign and Domestic Commerce. July 1925: 83. Archived from the original (PDF) on March 28, 2021. Retrieved August 10, 2021.{{cite journal}}: Cite journal requires |journal= (help)
  14. David M. Reimers, Unwelcome Strangers (1998), 26

Further reading

Related Research Articles

<span class="mw-page-title-main">Immigration to the United States</span> Overview of immigration to the United States of America

Immigration to the United States has been a major source of population growth and cultural change throughout much of its history. In absolute numbers, the United States has by far the highest number of immigrant population in the world, with 50,661,149 people as of 2019. This represents 19.1% of the 244 million international migrants worldwide, and 14.4% of the United States' population. In 2018, there were almost 90 million immigrants and U.S.-born children of immigrants in the United States, accounting for 28% of the overall U.S. population.

<span class="mw-page-title-main">Demographics of Puerto Rico</span> Demographic features of the population of Puerto Rico

The population of Puerto Rico has been shaped by native American settlement, European colonization especially under the Spanish Empire, slavery and economic migration. Demographic features of the population of Puerto Rico include population density, ethnicity, education of the populace, health of the populace, economic status, religious affiliations and other aspects of the population.

<span class="mw-page-title-main">Emergency Quota Act</span> Immigration-related US Congress Act of 1921

The Emergency Quota Act, also known as the Emergency Immigration Act of 1921, the Immigration Restriction Act of 1921, the Per Centum Law, and the Johnson Quota Act, was formulated mainly in response to the large influx of Southern and Eastern Europeans and restricted their immigration to the United States. Although intended as temporary legislation, it "proved, in the long run, the most important turning-point in American immigration policy" because it added two new features to American immigration law: numerical limits on immigration and the use of a quota system for establishing those limits, which came to be known as the National Origins Formula.

<span class="mw-page-title-main">Demographic history of the United States</span>

The United States is a country primarily located in North America. Demographics of the United States concern matters of population density, ethnicity, education level, health of the populace, economic status, religious affiliations, and other aspects regarding the population.

<span class="mw-page-title-main">Immigration and Nationality Act of 1965</span> American immigration law

The Immigration and Nationality Act of 1965, also known as the Hart–Celler Act and more recently as the 1965 Immigration Act, is a landmark federal law passed by the 89th United States Congress and signed into law by President Lyndon B. Johnson. The law abolished the National Origins Formula, which had been the basis of U.S. immigration policy since the 1920s. The act formally removed de facto discrimination against Southern and Eastern Europeans as well as Asians, in addition to other non-Western and Northern European ethnicities from the immigration policy of the United States.

<span class="mw-page-title-main">European Americans</span> Americans of European ancestry

European Americans are Americans of native European ancestry. This term includes people who are descended from the first European settlers in the United States as well as people who are descended from more recent European arrivals. European Americans have been the largest panethnic group in the United States since about the 17th century.

<span class="mw-page-title-main">Immigration Act of 1924</span> 1924 United States anti-immigration law

The Immigration Act of 1924, or Johnson–Reed Act, including the Asian Exclusion Act and National Origins Act, was a federal law that prevented immigration from Asia and set quotas on the number of immigrants from Eastern and Southern Europe. It also authorized the creation of the country's first formal border control service, the U.S. Border Patrol, and established a "consular control system" that allowed entry only to those who first obtained a visa from a U.S. consulate abroad.

British Americans usually refers to Americans whose ancestral origin originates wholly or partly in the United Kingdom. It is primarily a demographic or historical research category for people who have at least partial descent from peoples of Great Britain and the modern United Kingdom, i.e. English, Scottish, Irish, Welsh, Scotch-Irish, Orcadian, Manx, Cornish Americans, White Americans, and European Americans.

<span class="mw-page-title-main">Magnuson Act</span> 1943 US immigration law which repealed the Chinese Exclusion Act of 1882

The Chinese Exclusion Repeal Act of 1943, also known as the Magnuson Act, was an immigration law proposed by U.S. Representative Warren G. Magnuson of Washington and signed into law on December 17, 1943, in the United States. It allowed Chinese immigration for the first time since the Chinese Exclusion Act of 1882, and permitted some Chinese immigrants already residing in the country to become naturalized citizens. However, in many states, Chinese Americans were denied property-ownership rights either by law or de facto until the Magnuson Act itself was fully repealed in 1965.

<span class="mw-page-title-main">Immigration and Nationality Act of 1952</span> American immigration law

The Immigration and Nationality Act of 1952, also known as the McCarran–Walter Act, codified under Title 8 of the United States Code, governs immigration to and citizenship in the United States. It came into effect on June 27, 1952. The legislation consolidated various immigration laws into a single text. Officially titled the Immigration and Nationality Act, it is often referred to as the 1952 law to distinguish it from the 1965 legislation. This law increased the quota for Europeans outside Northern and Western Europe, gave the Department of State authority to reject entries affecting native wages, eliminated 1880s bans on contract labor, set a minimum quota of one hundred visas per country, and promoted family reunification by exempting citizens' children and spouses from numerical caps.

Asian immigration to the United States refers to immigration to the United States from part of the continent of Asia, which includes East Asia, South Asia, and Southeast Asia. Asian-origin populations have historically been in the territory that would eventually become the United States since the 16th century. The first major wave of Asian immigration occurred in the late 19th century, primarily in Hawaii and the West Coast. Asian Americans experienced exclusion, and limitations to immigration, by the United States law between 1875 and 1965, and were largely prohibited from naturalization until the 1940s. Since the elimination of Asian exclusion laws and the reform of the immigration system in the Immigration and Nationality Act of 1965, there has been a large increase in the number of immigrants to the United States from Asia.

<span class="mw-page-title-main">Race and ethnicity in the United States</span>

The United States has a racially and ethnically diverse population. At the federal level, race and ethnicity have been categorized separately. The most recent United States census recognized five racial categories, as well as people who belong to two or more of the racial categories. The United States also recognizes the broader notion of ethnicity. The 2000 census and 2010 American Community Survey inquired about the "ancestry" of residents, while the 2020 census allowed people to enter their "origins". The Census Bureau also classified respondents as either Hispanic or Latino, identifying as an ethnicity, which comprises the minority group in the nation.

The War Brides Act was enacted to allow alien spouses, natural children, and adopted children of members of the United States Armed Forces, "if admissible," to enter the U.S. as non-quota immigrants after World War II. More than 100,000 entered the United States under this Act and its extensions and amendments until it expired in December 1948. The War Brides Act was a part of new approach to immigration law that focused on family reunification over racial exclusion. There were still racial limits that existed particularly against Asian populations, and Chinese spouses were the only Asian nationality that qualified to be brought to the United States under the act. Additionally, the War Brides Act was well supported and easily passed because family members of servicemen were the recipients, but there were concerns over marital fraud which caused some tensions.

<span class="mw-page-title-main">Judicial aspects of race in the United States</span> Aspect of history

Legislation seeking to direct relations between racial or ethnic groups in the United States has had several historical phases, developing from the European colonization of the Americas, the triangular slave trade, and the American Indian Wars. The 1776 Declaration of Independence included the statement that "all men are created equal", which has ultimately inspired actions and legislation against slavery and racial discrimination. Such actions have led to passage of the 13th, 14th, and 15th Amendments to the Constitution of the United States.

<span class="mw-page-title-main">History of immigration to the United States</span>

The history of immigration to the United States details the movement of people to the United States from the colonial era to the present. Throughout U.S. history, the country experienced successive waves of immigration, particularly from Europe and later on from Asia and Latin America. Colonial-era immigrants often repaid the cost of transoceanic transportation by becoming indentured servants in which the new employer paid the ship's captain. In the late 19th century, immigration became restricted from China and Japan. In the 1920s, restrictive immigration quotas were imposed although political refugees had special status. Numerical restrictions ended in 1965. In recent years, the largest numbers have come from Asia and Central America.

During the 18th and most of the 19th centuries, the United States had limited regulation of immigration and naturalization at a national level. Under a mostly prevailing "open border" policy, immigration was generally welcomed, although citizenship was limited to “white persons” as of 1790, and naturalization subject to five year residency requirement as of 1802. Passports and visas were not required for entry to America, rules and procedures for arriving immigrants were determined by local ports of entry or state laws, and processes for naturalization were determined by local county courts.

The English diaspora consists of English people and their descendants who emigrated from England. The diaspora is concentrated in the English-speaking world in countries such as the United States, Canada, Australia, New Zealand, Scotland, Ireland, Wales, South Africa, India and to a lesser extent, Zimbabwe, Zambia and continental Europe.

<span class="mw-page-title-main">Americans</span> Citizens and nationals of the United States

Americans are the citizens and nationals of the United States. The United States is home to people of many racial and ethnic origins; consequently, American law does not equate nationality with race or ethnicity, but with citizenship and an oath of permanent allegiance.

<span class="mw-page-title-main">English Americans</span> Americans of English birth or descent

English Americans are Americans whose ancestry originates wholly or partly in England. In the 2020 United States census, English Americans were the largest group in the United States with 46.5 million Americans self-identifying as having some English origins representing (19.8%) of the White American population. This includes 25,536,410 (12.5%) who were "English alone". Despite being the largest self-identified ancestral origin in the United States, demographers still regard the number of English Americans as an undercount. As most English Americans are the descendants of settlers who first arrived during the English Colonial period which began over 400 years ago, many Americans are either unaware of this heritage or choose to elect a more recent known ancestral group even if English is their primary ancestry.

American ancestry refers to people in the United States who self-identify their ancestral origin or descent as "American", rather than the more common officially recognized racial and ethnic groups that make up the bulk of the American people. The majority of these respondents are visibly White Americans, who are far removed from and no longer self-identify with their original ethnic ancestral origins. The latter response is attributed to a multitude of generational distance from ancestral lineages, and these tend be Anglo-Americans of English, Scotch-Irish, Welsh, Scottish or other British ancestries, as demographers have observed that those ancestries tend to be recently undercounted in U.S. Census Bureau American Community Survey ancestry self-reporting estimates.