Immigration has been a major source of population growth and cultural change in the United States throughout much of its history. As of January 2025, the United States has the largest immigrant population in the world in absolute terms, with 53.3 million foreign-born residents, representing 15.8% of the total U.S. population—both record highs.[1] While the United States represented about 4% of the total global population in 2024, 17% of all international migrants resided in the United States.[2] In March 2025, the Federation for American Immigration Reform (FAIR) estimated that approximately 18.6 million illegal immigrants resided in the United States.[3] In 2024, immigrants and their U.S.-born children number more than 93 million people, or 28% of the total U.S. population.[2] According to the 2016 Yearbook of Immigration Statistics, the United States admitted a total of 1.18million legal immigrants (618k new arrivals, 565k status adjustments) in 2016.[4] Of these, 48% were the immediate relatives of United States citizens, 20% were family-sponsored, 13% were refugees or asylum seekers, 12% were employment-based preferences, 4.2% were part of the Diversity Immigrant Visa program, 1.4% were victims of a crime (U1) or their family members were (U2 to U5),[5] and 1.0% who were granted the Special Immigrant Visa (SIV) for Iraqis and Afghans employed by the United States Government.[4] The remaining 0.4% included small numbers from several other categories, including 0.2% who were granted suspension of deportation as an immediate relative of a citizen (Z13);[6] persons admitted under the Nicaraguan and Central American Relief Act; children born after the issuance of a parent's visa; and certain parolees from the former Soviet Union, Cambodia, Laos, and Vietnam who were denied refugee status.[4]
Between 1921 and 1965 policies such as the National Origins Formula limited immigration and naturalization opportunities for people from areas outside Northwestern Europe. Exclusion laws enacted as early as the 1880s generally prohibited or severely restricted immigration from Asia, and quota laws enacted in the 1920s curtailed Southern and Eastern European immigration. The civil rights movement led to the replacement[7] of these ethnic quotas with per-country limits for family-sponsored and employment-based preference visas.[8] Between 1970 and 2007, the number of first-generation immigrants living in the United States quadrupled from 9.6million to 38.1million residents.[9][10] Census estimates show 45.3million foreign born residents in the United States as of March 2018 and 45.4million in September 2021, the lowest three-year increase in decades.[11]
In 2017, out of the U.S. foreign-born population, some 45% (20.7million) were naturalized citizens, 27% (12.3million) were lawful permanent residents, 6% (2.2million) were temporary lawful residents, and 23% (10.5million) were unauthorized immigrants.[12] The United States led the world in refugee resettlement for decades, admitting more refugees than the rest of the world combined.[13]
Some research suggests that immigration is beneficial to the United States economy. With few exceptions, the evidence suggests that on average, immigration has positive economic effects on the native population, but it is mixed as to whether low-skilled immigration adversely affects low-skilled natives. Studies also show that immigrants have lower crime rates than natives in the United States.[17][18][19] The economic, social, and political aspects of immigration have caused controversy regarding such issues as maintaining ethnic homogeneity, workers for employers versus jobs for non-immigrants, settlement patterns, impact on upward social mobility, crime, and voting behavior.
Due to its history the United States can be described as an immigration country. American immigration history can be viewed in four epochs: the colonial period, the mid-19th century, the start of the 20th century, and post-1965. Each period brought distinct national groups, races, and ethnicities to the United States.
Colonial period
During the 17th century, more than 170,000 English people migrated to the modern United States.[20] They comprised 83.5% of the white population at the time of the first census in 1790.[21] From 1700 to 1775, between 350,000 and 500,000 Europeans immigrated: estimates vary in sources. Regarding English settlers of the 18th century, one source says 52,000 English migrated during the period of 1701 to 1775, although this figure is likely too low.[22][23] 400,000–450,000 of the 18th-century migrants were Scots, Scots-Irish from Ulster, Germans, Swiss, and French Huguenots.[24] Over half of all European immigrants to Colonial America during the 17th and 18th centuries arrived as indentured servants.[25] They numbered 350,000.[26] From 1770 to 1775 (the latter year being when the American Revolutionary War began), 7,000 English, 15,000 Scots, 13,200 Scots-Irish, 5,200 Germans, and 3,900 Irish Catholics migrated to the Thirteen Colonies.[27] According to Butler (2000), up to half of English migrants in the 18th century may have been young, single men who were well-skilled, trained artisans, like the Huguenots.[28] Based on scholarly analysis, English was the largest single ancestry in all U.S. states at the time of the first census in 1790, ranging from a high of 82% in Massachusetts to a low of 35.3% in Pennsylvania, where Germans accounted for 33.3%.
Origins of immigrant stock in 1790
The Census Bureau published preliminary estimates of the origins of the colonial American population by scholarly classification of the names of all White heads of families recorded in the 1790 census in a 1909 report entitled A Century of Population Growth.[29] These initial estimates were scrutinized and rejected following passage of the Immigration Act of 1924, when the government required accurate official estimates of the origins of the colonial stock population as basis for computing National Origins Formula immigration quotas in the 1920s. In 1927, proposed quotas based on CPG figures were rejected by the President's Committee chaired by the Secretaries of State, Commerce, and Labor, with the President reporting to Congress "the statistical and historical information available raises grave doubts as to the whole value of these computations as the basis for the purposes intended".[30] Concluding that CPG "had not been accepted by scholars as better than a first approximation of the truth", an extensive scientific revision was produced, in collaboration with the American Council of Learned Societies (ACLS), as basis for computing contemporary legal immigration quotas.[31] For this task scholars estimated the proportion of names of unique derivation from each of the major national stocks present in the population as of the 1790 census. The final results, later also published in the journal of the American Historical Association, are presented below:[30]
Historians estimate that fewer than one million immigrants moved to the United States from Europe between 1600 and 1799.[33] By comparison, in the first federal census, in 1790, the population of the United States was enumerated to be 3,929,214.[34]
These statistics do not include the 17.8% of the population who were enslaved, according to the 1790 census.
The Naturalization Act of 1790 limited naturalization to "free white persons"; it was expanded to include black people in the 1860s and Asian people in the 1950s.[35] This made the United States an outlier, since laws that made racial distinctions were uncommon in the world in the 18th century.[36]
The 1794 Jay Treaty provided freedom of movement for Americans, British subjects, and Native Americans into British and American jurisdictions, Hudson's Bay Company land excepted. The treaty is still in effect to the degree that it allows Native Americans born in Canada (subject to a blood quantum test) to enter the United States freely.[37][38][39]
In the early years of the United States, immigration (not counting the enslaved, who were treated as merchandise rather than people) was fewer than 8,000 people a year,[40] including French refugees from the slave revolt in Haiti. Legal importation of enslaved African was prohibited after 1808, though many were smuggled in to sell. After 1820, immigration gradually increased. From 1836 to 1914, over 30 million Europeans migrated to the United States.[41]
First U.S. laws restricting immigration
After an initial wave of immigration from China following the California Gold Rush, racist attitudes toward the Chinese population of the West Coast led to Congress passing the very first U.S. law restricting immigration: The Page Act of 1875 banned Chinese women who, it was claimed, were arriving to engage in prostitution.[42] This was followed by the Chinese Exclusion Act of 1882, banning virtually all immigration from China until the law's repeal in 1943. In the late 1800s, immigration from other Asian countries, especially to the West Coast, became more common.
Exclusion Era
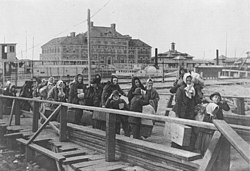
The peak year of European immigration was in 1907, when 1,285,349 persons entered the country.[43] By 1910, 13.5million immigrants were living in the United States.[44]
While the Chinese Exclusion Act of 1882 had already excluded immigrants from China, the immigration of people from Asian countries in addition to China was banned by the Immigration Act of 1917, also known as the Asiatic Barred Zone Act, which also banned homosexuals, people with intellectual disability, and people with an anarchist worldview.[45] The Emergency Quota Act was enacted in 1921, limiting immigration from the Eastern Hemisphere by national quotas equal to 3 percent of the number of foreign-born from each nation in the 1910 census. The Act aimed to further restrict immigrants from Southern and Eastern Europe, particularly Italian, Slavic, and Jewish people, who had begun to enter the country in large numbers beginning in the 1890s.[46] The temporary quota system was superseded by the National Origins Formula of the Immigration Act of 1924, which computed national quotas as a fraction of 150,000 in proportion to the national origins of the entire White American population as of the 1920 census, except those having origins in the nonquota countries of the Western Hemisphere (which remained unrestricted).[47][48]
Origins of immigrant stock in 1920
The National Origins Formula was a unique computation which attempted to measure the total contributions of "blood" from each national origin as a share of the total stock of White Americans in 1920, counting immigrants, children of immigrants, and the grandchildren of immigrants (and later generations), in addition to estimating the colonial stock descended from the population who had immigrated in the colonial period and were enumerated in the 1790 census. European Americans remained predominant, although there were shifts toward Southern, Central, and Eastern Europe from immigration in the period 1790 to 1920. The formula determined that ancestry derived from Great Britain accounted for over 40% of the American gene pool, followed by German ancestry at 16%, then Irish ancestry at 11%. The restrictive immigration quota system established by the Immigration Act of 1924, revised and re-affirmed by the Immigration and Nationality Act of 1952, sought to preserve this demographic makeup of America by allotting quotas in proportion to how much blood each national origin had contributed to the total stock of the population in 1920, as presented below:[31]
The White Population of the United States in 1920, apportioned according to the National Origins Formula prescribed by §11(c) of the Immigration Act of 1924. About 56.5% of White Americans were deemed to be of postcolonial immigrant stock as of 1920, while 43.5% were deemed colonial stock. Consequent immigration quotas in effect until 1965 were based upon these calculations.[49]
European Americans in 1790 by nationality, estimated by classification of family names, according to a 1909 preliminary estimate in Census Bureau report A Century of Population Growth (top half) and revised figures according to a scientific study by the Census Bureau in collaboration with the American Council of Learned Societies commissioned in the 1920s (bottom half)[29][30]
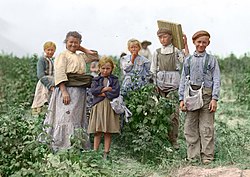
Polish immigrants working on a farm in 1909; the welfare system was practically non-existent before the 1930s and the economic pressures on the poor were giving rise to child labor.
Immigration patterns of the 1930s were affected by the Great Depression. In the final prosperous year, 1929, there were 279,678 immigrants recorded,[50] but in 1933, only 23,068 moved to the U.S.[33] In the early 1930s, more people emigrated from the United States than to it.[51] The U.S. government sponsored a Mexican Repatriation program which was intended to encourage people to voluntarily move to Mexico, but thousands were deported against their will.[52] Altogether, approximately 400,000 Mexicans were repatriated; half of them were US citizens.[53] Most of the Jewish refugees fleeing the Nazis and World War II were barred from coming to the United States.[54] In the post-war era, the Justice Department launched Operation Wetback, under which 1,075,168 Mexicans were deported in 1954.[55]
Since 1965
Immigrant trunks from Sweden in the late 19th century (on left) and from a refugee camp in Thailand in 1993 (on right)Boston's Chinatown in Boston in 2008In recent decades, immigration to nearly every Western country has risen sharply, with the U.S. growing from 9% (1990) to 15% (2020) of the population being born abroad. The slopes of the tops of the differently-colored columns show the rate of percent increase in foreign-born people living in the respective countries.As a portion of U.S. population, nationwide border encounters have varied substantially over the decades.
The Immigration and Nationality Act of 1965, also known as the Hart–Celler Act, abolished the system of national-origin quotas. By equalizing immigration policies, the act resulted in new immigration from non-European nations, which changed the ethnic demographics of the United States.[58] In 1970, 60% of immigrants were from Europe; this decreased to 15% by 2000.[59]
The U.S. Immigration and Naturalization Law of 1965 abolished the former quota system and gave preference to people with skills regarded as being "especially advantageous" to the United States, which resulted in an increase in immigration from Asia.[60] In the 1980s, this accelerated as the Federal government of the United States encouraged the immigration of engineers, mathematicians, and scientists from Asia, particularly India and China, to help support STEM-related endeavors in the country.[61] Skilled immigration from these countries was strengthened through the Immigration Act of 1990.[62] The National Academy of Sciences has supported U.S. policymakers to design legislation that attracts foreign mathematicians, engineers and scientists to emigrate to the United States.[63]
In 1986 president Ronald Reagan signed immigration reform that gave amnesty to 3 million undocumented immigrants in the country.[64]
In November 1994, California voters passed Proposition 187 amending the state constitution, denying state financial aid to illegal immigrants. The federal courts voided this change, ruling that it violated the federal constitution.[67]
Appointed by President Bill Clinton,[68] the U.S. Commission on Immigration Reform recommended reducing legal immigration from about 800,000 people per year to approximately 550,000.[69] While an influx of new residents from different cultures presents some challenges, "the United States has always been energized by its immigrant populations", said President Bill Clinton in 1998. "America has constantly drawn strength and spirit from wave after wave of immigrants... They have proved to be the most restless, the most adventurous, the most innovative, the most industrious of people."[70]
In 2001, President George W. Bush discussed an accord with Mexican President Vicente Fox. Due to the September 11 attacks, the possible accord did not occur. From 2005 to 2013, the US Congress discussed various ways of controlling immigration. The Senate and House were unable to reach an agreement.[67]
Nearly 8 million people immigrated to the United States from 2000 to 2005; 3.7million of them entered without papers.[71][72] Hispanic immigrants suffered job losses during the late-2000s recession,[73] but since the recession's end in June 2009, immigrants posted a net gain of 656,000 jobs.[74]
Nearly 14million immigrants entered the United States from 2000 to 2010,[75] and over one million persons were naturalized as U.S. citizens in 2008. The per-country limit[8] applies the same maximum on the number of visas to all countries regardless of their population and has therefore had the effect of significantly restricting immigration of persons born in populous nations such as Mexico, China, India, and the Philippines—the leading countries of origin for legally admitted immigrants to the United States in 2013;[76] nevertheless, China, India, and Mexico were the leading countries of origin for immigrants overall to the United States in 2013, regardless of legal status, according to a U.S. Census Bureau study.[77]
Over 1 million immigrants were granted legal residence in 2011.[78]
For those who enter the US illegally across the Mexico–United States border and elsewhere, migration is difficult, expensive and dangerous.[79] Virtually all undocumented immigrants have no avenues for legal entry to the United States due to the restrictive legal limits on green cards, and lack of immigrant visas for low-skilled workers.[80] Participants in debates on immigration in the early 21st century called for increasing enforcement of existing laws governing illegal immigration to the United States, building a barrier along some or all of the 2,000-mile (3,200km) Mexico-U.S. border, or creating a new guest worker program. Through much of 2006 the country and Congress was engaged in a debate about these proposals. As of April2010[update] few of these proposals had become law, though a partial border fence had been approved and subsequently canceled.[81]
Modern reform attempts
Beginning with Ronald Reagan in the 1980s, presidents from both political parties have steadily increased the number of border patrol agents and instituted harsher punitive measures for immigration violations. Examples of these policies include Ronald Reagan's Immigration Reform and Control Act of 1986 and the Clinton-era Prevention Through Deterrence strategy. The sociologist Douglas Massey has argued that these policies have succeeded at producing a perception of border enforcement but have largely failed at preventing emigration from Latin America. Notably, rather than curtailing illegal immigration, the increase in border patrol agents decreased circular migration across the U.S.–Mexico border, thus increasing the population of Hispanics in the U.S.[82]
Presidents from both parties have employed anti-immigrant rhetoric to appeal to their political base or to garner bi-partisan support for their policies. While Republicans like Reagan and Donald Trump have led the way in framing Hispanic immigrants as criminals, Douglas Massey points out that "the current moment of open racism and xenophobia could not have happened with Democratic acquiescence".[83] For example, while lobbying for his 1986 immigration bill, Reagan framed unauthorized immigration as a "national security" issue and warned that "terrorists and subversives are just two days' driving time" from the border.[83] Later presidents, including Democrats Bill Clinton and Barack Obama, used similar "security" rhetoric in their efforts to court Republican support for comprehensive immigration reform. In his 2013 State of the Union Address, Obama said "real reform means strong border security, and we can build on the progress my administration has already made–putting more boots on the southern border than at any time in our history".[84]
ICE reports that it removed 240,255 immigrants in fiscal year 2016, as well as 226,119 in FY2017 and 256,085 in FY2018. Citizens of Central American countries (including Mexico) made up over 90% of removals in FY2017 and over 80% in FY2018.[85]
In January 2017, U.S. President Donald Trump signed an executive order temporarily suspending entry to the United States by nationals of seven Muslim-majority countries. It was replaced by another executive order in March 2017 and by a presidential proclamation in September 2017, with various changes to the list of countries and exemptions.[86] The orders were temporarily suspended by federal courts but later allowed to proceed by the Supreme Court, pending a definite ruling on their legality.[87] Another executive order called for the immediate construction of a wall across the U.S.–Mexico border, the hiring of 5,000 new border patrol agents and 10,000 new immigration officers, and federal funding penalties for sanctuary cities.[88]
The "zero-tolerance" policy was put in place in 2018, which legally allows children to be separated from adults unlawfully entering the United States. This is justified by labeling all adults that enter unlawfully as criminals, thus subjecting them to criminal prosecution.[89] The Trump Administration also argued that its policy had precedent under the Obama Administration, which had opened family detention centers in response to migrants increasingly using children as a way to get adults into the country. However, the Obama Administration detained families together in administrative, rather than criminal, detention.[90][91]
Other policies focused on what it means for an asylum seeker to claim credible fear.[92] To further decrease the amount of asylum seekers into the United States, Attorney General Jeff Sessions released a decision that restricts those fleeing gang violence and domestic abuse as "private crime", therefore making their claims ineligible for asylum.[93] These new policies that had been put in place were controversial for putting the lives of the asylum seekers at risk, to the point that the ACLU sued Jeff Sessions along with other members of the Trump Administration. The ACLU claimed that the policies put in place by the Trump Administration undermined the fundamental human rights of those immigrating into the United States, specifically women. They also claimed that these policies violated decades of settle asylum law.[94]
In January 2023, regarding the Mexico–United States border crisis, Joe Biden announced a new immigration policy that would allow 30,000 migrants per month from Cuba, Haiti, Nicaragua and Venezuela[97] but will also expel the migrants from those countries who violate US laws of immigration.[98] The policy has faced criticism from "immigration reform advocates and lawyers who decry any expansion of Title 42."[97]
On October 31, 2023, Homeland Security Secretary Alejandro Mayorkas testified before the Senate Homeland Security Committee that more than 600,000 people illegally made their way into the United States without being apprehended by border agents during the 2023 fiscal year.[99][100]
Border Security and Asylum Reform in the Emergency National Security Supplemental Appropriations Act, 2024
The 2024 Emergency National Security Supplemental Appropriations Act represents a change in the immigration system with a focus on strengthening border security and improving asylum processes. This bill, backed by both Republican senators and endorsed by President Biden seeks to address the surge in border crossings in the U.S. Mexico border by revolutionizing how migrants and asylum seekers are processed by border authorities. More specifically, asylum officers to consider certain bars to asylum during screening interviews, which were previously only considered by immigration judges. The legislation aims to streamline provisions for effective management.
The proposed law introduces an asylum procedure in the U.S. Border, where asylum officers from the U.S. Citizenship and Immigration Services (USCIS) can review asylum applications at a more rapid pace. This new process, called removal proceedings, is detailed in a new section of the Immigration and Nationality Act (INA) specifically Section 235B.[103] The bill sets a bar for passing an asylum screening by requiring a "reasonable possibility" standard instead of the previous "credible fear" standard. Requiring more evidence at the preliminary screening stages at the same level needed for a full hearing. Notably excluded apprehended individuals between ports of entry from asylum eligibility except under narrow exceptions.[104] This adjustment makes it more difficult for asylum seekers to qualify for a hearing in front of an immigration judge and has raised questions in regards to potential violations against the right to seek asylum and due process.
Furthermore, the legislation establishes an emergency expulsion authority that empowers the branch to expel migrants and asylum seekers during times of " extraordinary migration circumstances." When the seven-day average of encounters between ports of entry exceeds 2,500, the restrictions come into effect.[105] The restrictions continue until the average falls below 1,500 for 14 consecutive days. If this occurs the DHS Secretary can promptly send migrants back to their home country unless they can prove they face a risk of persecution or torture.
The proposed legislation involves around $18.3billion in funding for the Department of Homeland Security (DHS) to carry out the border policies and changes in the asylum process. Moreover, it designates $2.3billion to support arrived refugees through the "Refugee and Entrant Assistance" program.[103] The program itself is designed to fund a broad range of social services to newly arrived refugees, both through states and direct service grants. The bill outlines provisions for granting status to allies safeguarding most "Documented Dreamers " and issuing an additional 250,000 immigrant visas.[106] It introduces a program for repatriation enabling asylum seekers to go to their home countries at any point during the proceedings. The proposed legislation also contains clauses that do not affect the humanitarian parole initiatives of the Biden administration, for individuals from Venezuela, Cuba, Haiti and Nicaragua.[107] These individuals are granted approval to travel and a temporary period of parole in the United States.
Origins of the U.S. immigrant population, 1960–2016
% of foreign-born population residing in the U.S. who were born in ...[108]
According to the Department of State, in the 2016 fiscal year 84,988 refugees were accepted into the US from around the world. In the fiscal year of 2017, 53,691 refugees were accepted to the US. There was a significant decrease after Trump took office; it continued in the fiscal year of 2018 when only 22,405 refugees were accepted into the US. This displays a massive drop in acceptance of refugees since the Trump Administration has been in place.[110][original research?]
On September 26, 2019, the Trump administration announced that it planned to allow only 18,000 refugees to resettle in the United States in the 2020 fiscal year, its lowest level since the modern program began in 1980.[111][112][113][114]
In 2020 the Trump administration announced that it planned to slash refugee admissions to U.S. for 2021 to a record low of 15,000 refugees down from a cap of 18,000 for 2020, making 2021 the fourth consecutive year of declining refugee admissions under the Trump term.[115][116][117]
The Biden administration pledged to welcome 125,000 refugees in 2024.[118]
As of 2018[update], approximately half of immigrants living in the United States are from Mexico and other Latin American countries.[121]
Until the 1930s most legal immigrants were male. By the 1990s women accounted for just over half of all legal immigrants.[122] Contemporary immigrants tend to be younger than the native population of the United States, with people between the ages of 15 and 34 substantially overrepresented.[123] Immigrants are also more likely to be married and less likely to be divorced than native-born Americans of the same age.[124]
Immigrants are likely to move to and live in areas populated by people with similar backgrounds. This phenomenon has remained true throughout the history of immigration to the United States.[125] Seven out of ten immigrants surveyed by Public Agenda in 2009 said they intended to make the U.S. their permanent home, and 71% said if they could do it over again they would still come to the US. In the same study, 76% of immigrants say the government has become stricter on enforcing immigration laws since the September 11 attacks ("9/11"), and 24% report that they personally have experienced some or a great deal of discrimination.[126]
Public attitudes about immigration in the U.S. were heavily influenced in the aftermath of the 9/11 attacks. After the attacks, 52% of Americans believed that immigration was a good thing overall for the U.S., down from 62% the year before, according to a 2009 Gallup poll.[127] A 2008 Public Agenda survey found that half of Americans said tighter controls on immigration would do "a great deal" to enhance U.S. national security.[128] Harvard political scientist and historian Samuel P. Huntington argued in his 2004 book Who Are We? The Challenges to America's National Identity that a potential future consequence of continuing massive immigration from Latin America, especially Mexico, could lead to the bifurcation of the United States.[129][130]
The estimated population of illegal Mexican immigrants in the US decreased from approximately 7 million in 2007 to 6.1million in 2011[131] Commentators link the reversal of the immigration trend to the economic downturn that started in 2008 and which meant fewer available jobs, and to the introduction of tough immigration laws in many states.[132][133][134][135] According to the Pew Hispanic Center, the net immigration of Mexican born persons had stagnated in 2010, and tended toward going into negative figures.[136]
The share of international job seekers looking to work in the U.S. declined sharply in 2025 as per a report from Indeed. The slowing labor market and stricter immigration policy beginning with the Biden administration and accelerating under President Trump has led to further cooling demand for American jobs.[137]
"The current debate... is almost totally about what to do about immigrants when they get here. But the 800-pound gorilla that's missing from the table is what we have been doing there that brings them here, that drives them here", according to Jeff Faux, an economist who is a distinguished fellow at the Economic Policy Institute.
Many Central Americans are fleeing because of desperate social and economic circumstances in their countries. Some believe that the large number of Central American refugees arriving in the United States can be explained as a "blowback" to policies such as United States military interventions and covert operations that installed or maintained in power authoritarian leaders allied with wealthy land owners and multinational corporations who stop family farming and democratic efforts, which have caused drastically sharp social inequality, wide-scale poverty and rampant crime.[14] Economic austerity dictated by neoliberal policies imposed by the International Monetary Fund and its ally, the U.S., has also been cited as a driver of the dire social and economic conditions, as has the U.S. "war on drugs", which has been understood as fueling murderous gang violence in the region.[15]
Another major migration driver from Central America (Guatemala, Honduras, and El Salvador) are crop failures, which are (partly) caused by climate change.[140][141][142][143]
Half of the people which are migrating from Latin America to the United States are from the Dry Corridor (El Corredor Seco) - a climatic zone that stretches through Guatemala, El Salvador, and Honduras suffering from different climate change impacts resulting in a flow of climate migrants to the United States. In 2007-2017 alone, immigration from the region to the US grew by a quart, and the trend is expected to continue, as far as climate change will continue to make the region drier and hotter. Climate change is crucial to understand migration from there as it have an impact on a variety of socioeconomic "push factors". Changes in climate patterns are part of the causes which make Mexicanes migrate as within so outside the country. In 2008–2021, 2.2 million Mexicans were displaced for reasons linked with climate change.[16]
The United States admitted more legal immigrants from 1991 to 2000, between ten and eleven million, than in any previous decade. In the most recent decade,[when?] the 10 million legal immigrants that settled in the U.S. represent roughly one third of the annual growth, as the U.S. population increased by 32million (from 249million to 281million). By comparison, the highest previous decade was the 1900s, when 8.8million people arrived, increasing the total U.S. population by one percent every year. Specifically, "nearly 15% of Americans were foreign-born in 1910, while in 1999, only about 10% were foreign-born".[162]
By 1970, immigrants accounted for 4.7 percent of the US population and rising to 6.2 percent in 1980, with an estimated 12.5 percent in 2009.[163]As of 2010[update], 25% of US residents under age 18 were first- or second-generation immigrants.[164] Eight percent of all babies born in the U.S. in 2008 belonged to illegal immigrant parents, according to a recent[when?] analysis of U.S. Census Bureau data by the Pew Hispanic Center.[165]
Legal immigration to the U.S. increased from 250,000 in the 1930s, to 2.5million in the 1950s, to 4.5million in the 1970s, and to 7.3million in the 1980s, before becoming stable at about 10 million in the 1990s.[166] Since 2000, legal immigrants to the United States number approximately 1,000,000 per year, of whom about 600,000 are Change of Status who already are in the U.S. Legal immigrants to the United States now[when?] are at their highest level ever, at just over 37,000,000 legal immigrants. In reports in 2005–2006, estimates of illegal immigration ranged from 700,000 to 1,500,000 per year.[167][168] Immigration led to a 57.4% increase in foreign-born population from 1990 to 2000.[169]
Foreign-born immigration has caused the U.S. population to continue its rapid increase with the foreign-born population doubling from almost 20 million in 1990 to over 47million in 2015.[170] In 2018, there were almost 90 million immigrants and U.S.-born children of immigrants (second-generation Americans) in the United States, accounting for 28% of the overall U.S. population.[171]
While immigration has increased drastically over the 20th century, the foreign-born share of the population is, at 13.4, only somewhat below what it was at its peak in 1910 at 14.7%. A number of factors may be attributed to the decrease in the representation of foreign-born residents in the United States. Most significant has been the change in the composition of immigrants; prior to 1890, 82% of immigrants came from North and Western Europe. From 1891 to 1920, that number decreased to 25%, with a rise in immigrants from East, Central, and South Europe, summing up to 64%. Animosity towards these ethnically different immigrants increased in the United States, resulting in much legislation to limit immigration in the 20th century.[172]
12345678910111213141516171819202122Data comes from 2006 US Census Bureau document which is cited. Numbers from this country are not listed in Census Bureau document from 1965.
In the 2023-2024 Religious Landscape Survey carried out by Pew Research Center among those born outside the United States 58% identified as Christian, 14% as being from other religions and 26% said they were unaffiliated.[181]
Immigration to the United States significantly increases the population. The Census Bureau estimates that the US population will increase from 317 million in 2014 to 417million in 2060 with immigration, when nearly 20% will be foreign-born.[182] In particular, the population of Hispanic and Asian Americans is significantly increased by immigration, with both populations expected to see major growth.[183][184] Overall, the Pew Report predicts the population of the United States will rise from 296 million in 2005 to 441million in 2065, but only to 338million with no immigration.[183] The prevalence of immigrant segregation has brought into question the accuracy of describing the United States as a melting pot.[185][186] Immigration to the United States has also increased religious diversity, with Islam, Hinduism, Buddhism, and Sikhism growing in the United States due to immigration.[187] Changing demographics as a result of immigration have affected political affiliations. Immigrants are more likely than natives to support the Democratic Party.[58][188][189] Interest groups that lobby for and against immigration play a role in immigration policy, with religious, ethnic, and business groups most likely to lobby on issues of immigration.[190][191]
Immigrants have not been found to increase crime in the United States, and immigrants overall are associated with lower crime rates than natives.[17][18][19][192] Some research even suggests that increases in immigration may partly explain the reduction in the U.S. crime rate.[193][194] According to one study, sanctuary cities—which adopt policies designed to not prosecute people solely for being an illegal immigrant—have no statistically meaningful effect on crime.[195] Research suggests that police practices, such as racial profiling, over-policing in areas populated by minorities and in-group bias may result in disproportionately high numbers of immigrants among crime suspects.[196][197][198][199] Research also suggests that there may be possible discrimination by the judicial system, which contributes to a higher number of convictions for immigrants.[200][201][202][203][204]Crimmigration has emerged as a field in which critical immigration scholars conceptualize the current immigration law enforcement system.[205]
Increased immigration to the United States has historically caused discrimination and racial unrest.[citation needed] Areas with higher minority populations may be subject to increased policing[196][197][206][199] and harsher sentencing.[200][201][202][203][204] Faculty in educational facilities have been found to be more responsive toward white students,[207] though affirmative action policies may cause colleges to favor minority applicants.[208] Evidence also shows the existence of racial discrimination in the housing market[209][210][211] and the labor market.[209][212][213] Discrimination also exists between different immigrant groups.[214][215] According to a 2018 study of longitudinal earnings, most immigrants economically assimilate into the United States within a span of 20 years, matching the economic situations of non-immigrants of similar race and ethnicity.[216]
Immigration has been found to have little impact on the health of natives.[217] Researchers have also found what is known as the "healthy immigrant effect", in which immigrants in general tend to be healthier than individuals born in the U.S.[218][219] However, some illnesses are believed to have been introduced to the United States or caused to increase by immigration.[220] Immigrants are more likely than native-born Americans to have a medical visit labeled uncompensated care.[221]
A significant proportion of American scientists and engineers are immigrants. Graduate students are more likely to be immigrants than undergraduate students, as immigrants often complete undergraduate training in their native country before immigrating.[222] 33% of all U.S. PhDs in science and engineering were awarded to foreign-born graduate students as of 2004.[223]
High-skilled immigration and low-skilled immigration have both been found to make economic conditions better for the average immigrant[224] and the average American.[225][226] The overall impact of immigration on the economy tends to be minimal.[227][228] Research suggests that diversity has a net positive effect on productivity[229][230] and economic prosperity.[231][232][233] A 2026 white paper by the Cato Institute found that from 1994 to 2023, contributions by immigrants through taxation and economic activity exceeded the cost of services used by immigrants on an annual and cumulative basis. The study further found that over the entire period, immigrants generated a $14.5 trillion fiscal surplus in 2024 dollars and saved the country $3.9 trillion in interest on the national debt. The paper concludes that immigrants have prevented a fiscal crisis, and that without their impact the national debt would be 205% of GDP, almost double its actual proportion.[234] Overall immigration has not had much effect on native wage inequality[235][236] but low-skill immigration has been linked to greater income inequality in the native population.[237] Labor unions have historically opposed immigration over economic concerns.[238]
Immigrants have also been found to raise economic productivity, as they are more likely to take jobs that natives are unwilling to do.[239] Research indicates that immigrants are more likely to work in risky jobs than U.S.-born workers, partly due to differences in average characteristics, such as immigrants' lower English language ability and educational attainment.[240] Refugees have been found to integrate more slowly into the labor market than other immigrants, but they have also been found to increase government revenue overall.[241][242][243] Immigration has also been correlated with increased innovation and entrepreneurship, and immigrants are more likely to start businesses than people born in The United States.[244][245][246]
Undocumented immigrants have also been found to have a positive effect on economic conditions in the United States.[247][248][249] According to NPR in 2005, about 3% of illegal immigrants were working in agriculture,[250] and the H-2A visa allows U.S. employers to bring foreign nationals to the United States to fill temporary agricultural jobs.[251] States that imposed harsher immigration laws were found to suffer significant economic losses.[252][253]
In May 2024, research conducted at Federal Reserve Bank of Kansas City suggested that immigration to the United States surged during 2022–2023 and the inflow of migrants to the country acted as a powerful catalyst in cooling overheatedlabor markets and tempering wage growth across industries and states. The study showed that from Dec 2021 to Dec 2023 there existed a negative correlation between an industry's migrant employment growth and wage growth: an increase in migrant employment growth of 1 percentage point lead to a 0.7 percentage point reduction in wage growth. It was found that an increase in employment growth, stemming from migrant workers, of 1 percentage point lead to a 0.5 percentage point reduction in job vacancy rates.[254]
Public opinion
History of immigration enforcement actions, raw numbers as reported by the U.S. Department of Homeland Security[255]
As a percent of US population, recent figures for enforcement actions are similar to those in several past decades.[256]
Apprehensions between ports of entry, annually by federal fiscal year since 2000
The largely ambivalent feeling of Americans toward immigrants is shown by a positive attitude toward groups that have been visible for a century or more, and much more negative attitude toward recent arrivals. For example, a 1982 national poll by the Roper Center at the University of Connecticut showed respondents a card listing a number of groups and asked, "Thinking both of what they have contributed to this country and have gotten from this country, for each one tell me whether you think, on balance, they've been a good or a bad thing for this country", which produced the results shown in the table. "By high margins, Americans are telling pollsters it was a very good thing that Poles, Italians, and Jews immigrated to America. Once again, it's the newcomers who are viewed with suspicion. This time, it's the Mexicans, the Filipinos, and the people from the Caribbean who make Americans nervous."[258][259]
In a 2002 study, which took place soon after the September 11 attacks, 55% of Americans favored decreasing legal immigration, 27% favored keeping it at the same level, and 15% favored increasing it.[260]
In 2006, the immigration-reduction advocacy think tank the Center for Immigration Studies released a poll that found that 68% of Americans think U.S. immigration levels are too high, and just 2% said they are too low. They also found that 70% said they are less likely to vote for candidates that favor increasing legal immigration.[261] In 2004, 55% of Americans believed legal immigration should remain at the current level or increased and 41% said it should be decreased.[262] The less contact a native-born American has with immigrants, the more likely they would have a negative view of immigrants.[262]
One of the most important factors regarding public opinion about immigration is the level of unemployment; anti-immigrant sentiment is where unemployment is highest, and vice versa.[263]
Surveys indicate that the U.S. public consistently makes a sharp distinction between legal and illegal immigration, and generally views those perceived as "playing by the rules" with more sympathy than immigrants who have entered the country illegally.[264]
According to a Gallup poll in July 2015, immigration is the fourth-most important problem facing the United States and seven percent of Americans said it was the most important problem facing America today.[265] In March 2015, another Gallup poll provided insight into American public opinion on immigration; the poll revealed that 39% of people worried about immigration "a great deal".[266] A January poll showed that only 33% of Americans were satisfied with the current state of immigration in America.[267]
Before 2012, a majority of Americans supported securing United States borders compared to dealing with illegal immigration in the United States. In 2013, that trend has reversed and 55% of people polled by Gallup revealed that they would choose "developing a plan to deal with immigrants who are currently in the U.S. illegally". Changes regarding border control are consistent across party lines, with the percentage of Republicans saying that "securing U.S. borders to halt flow of illegal immigrants" is extremely important decreasing from 68% in 2011 to 56% in 2014. Meanwhile, Democrats who chose extremely important shifted from 42% in 2011 to 31% in 2014.[268] In July 2013, 87% of Americans said they would vote in support of a law that would "allow immigrants already in the country to become U.S. citizens if they meet certain requirements including paying taxes, having a criminal background check and learning English". However, in the same survey, 83% also said they would support the tightening of U.S. border security.[269]
Donald Trump's campaign for presidency focused on a rhetoric of reducing illegal immigration and toughening border security. In July 2015, 48% of Americans thought that Donald Trump would do a poor job of handling immigration problems. In November 2016, 55% of Trump's voters thought that he would do the right thing regarding illegal immigration. In general, Trump supporters are not united upon how to handle immigration. In December 2016, Trump voters were polled and 60% said that "undocumented immigrants in the U.S. who meet certain requirements should be allowed to stay legally".[270] After Trump claimed during his 2024 presidential campaign that immigrants are "poisoning the blood of our country", a Public Religion Research Institute survey showed that 34% of Americans agreed, and 35% agreed that "immigrants are invading our country and replacing our cultural and ethnic background".[271]
American opinion regarding how immigrants affect the country and how the government should respond to illegal immigration have changed over time. In 2006, out of all U.S. adults surveyed, 28% declared that they believed the growing number of immigrants helped American workers and 55% believed that it hurt American workers. In 2016, those views had changed, with 42% believing that they helped and 45% believing that they hurt.[272] The PRRI 2015 American Values Atlas showed that between 46% and 53% of Americans believed that "the growing number of newcomers from other countries... strengthens American society". In the same year, between 57% and 66% of Americans chose that the U.S. should "allow [immigrants living in the U.S. illegally] a way to become citizens provided they meet certain requirements".[273]
In February 2017, the American Enterprise Institute released a report on recent surveys about immigration issues. In July 2016, 63% of Americans favored the temporary bans of immigrants from areas with high levels of terrorism and 53% said the U.S. should allow fewer refugees to enter the country. In November 2016, 55% of Americans were opposed to building a border wall with Mexico. Since 1994, Pew Research center has tracked a change from 63% of Americans saying that immigrants are a burden on the country to 27%.[274]
The Trump administration's zero-tolerance policy was reacted to negatively by the public. One of the main concerns was how detained children of illegal immigrants were treated. Due to very poor conditions, a campaign was begun called "Close the Camps".[275] Detainment facilities were compared to concentration and internment camps.[276][277]
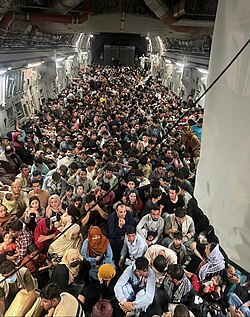
After the 2021 evacuation from Afghanistan in August 2021, an NPR/Ipsos poll (±4.6%) found 69% of Americans supported resettling in the United States Afghans who had worked with the U.S., with 65% support for Afghans who "fear repression or persecution from the Taliban".[278] There was lower support for other refugees: 59% for those "fleeing from civil strife and violence in Africa", 56% for those "fleeing from violence in Syria and Libya", and 56% for "Central Americans fleeing violence and poverty". 57% supported the Trump-era Remain in Mexico policy, and 55% supported legalizing the status of those illegally brought to the U.S. as children (as proposed in the DREAM Act).
Religious responses
Religious figures in the United States have stated their views on the topic of immigration as informed by their religious traditions.
Catholicism – Due to persecution abroad, Catholics comprised the largest group of migrants to the U.S. during the mid-19th and early-20th centuries.[279] As a result of the large immigrant population within the Church, as well as anti-Catholic sentiment within the U.S., the Catholic church organized resources to support recently arrived immigrants.[280] While the rate of Catholic migration has slowed, the Church has largely remained supportive of humanitarian migration due to biblical principals.[281] In 1988, the U.S. Conference of Catholic Bishops established the Catholic Legal Immigration Network (CLINIC) to help meet the increased demand for legal assistance following major immigration reform. CLINIC is now the largest nonprofit immigration law organization in the U.S.[282] In 2018, Catholic leaders stated that asylum-limiting laws proposed by the Trump administration were immoral. Some bishops considered imposing sanctions (known as "canonical penalties") on church members who have participated in enforcing such policies.[283]
Judaism – American Jewish rabbis from various denominations have stated that their understanding of Judaism is that immigrants and refugees should be welcomed, and even assisted. The exception would be if there is significant economic hardship or security issues faced by the host country or community, in which case immigration may be limited, discouraged or even prohibited altogether.[284] Some liberal denominations place more emphasis on the welcoming of immigrants, while Conservative, Orthodox and Independent rabbis also consider economic and security concerns.[285] Some provide moral arguments for both the right of country to enforce immigration standards as well as for providing some sort of amnesty for illegal migrants.[286]
A U.S. green card, a document confirming permanent resident status for eligible immigrants, including refugees, political asylum seekers, family-sponsored migrants, employment-based workers, and diversity immigrants
Refugees are able to gain legal status in the United States through asylum, and a specified number of legally defined refugees, who either apply for asylum overseas or after arriving in the U.S., are admitted annually.[quantify][citation needed] In 2014, the number of asylum seekers accepted into the U.S. was about 120,000. By comparison, about 31,000 were accepted in the UK and 13,500 in Canada.[289] Asylum offices in the United States receive more applications for asylum than they can process every month and every year, and these continuous applications cause a significant backlog.[290]
As of 2015, there are estimated to be 11 to 12 million unauthorized immigrants in the United States, making up about 5% of the civilian labor force.[298][299] Under the Deferred Action for Childhood Arrivals (DACA) program, unauthorized immigrants that arrived as children were granted exemptions to immigration law.[300] According to an August 2025 Pew Research Center report, the unauthorized immigrant population grew by 3.5 million between 2021 and 2023, reaching a record 14 million.[301]
In Department of State v. Muñoz, the U.S. Supreme court decided that U.S. citizens do not have a fundamental liberty to admit their foreign spouses.[303]
On January 14, 2026 the State Department announced it was suspending visa processing for 75 nations including Somalia, Russia, Iran, Afghanistan, Brazil, Nigeria, and Thailand.[304]
Immigration in popular culture
This 1888 cartoon in Puck magazine criticized businessmen for welcoming large numbers of low-paid immigrants, leaving the American men unemployed.
From the 1880s to the 1910s, vaudeville dominated the popular image of immigrants, with very popular caricature portrayals of ethnic groups. The specific features of these caricatures became widely accepted as accurate portrayals.[307]
In The Melting Pot (1908), playwright Israel Zangwill (1864–1926) explored issues that dominated Progressive Era debates about immigration policies. Zangwill's theme of the positive benefits of the American melting pot resonated widely in popular culture and literary and academic circles in the 20th century; his cultural symbolism–in which he situated immigration issues–likewise informed American cultural imagining of immigrants for decades, as exemplified by Hollywood films.[308][309]
The popular culture's image of ethnic celebrities often includes stereotypes about immigrant groups. For example, Frank Sinatra's public image as a superstar contained important elements of the American Dream while simultaneously incorporating stereotypes about Italian Americans that were based in nativist and Progressive responses to immigration.[310]
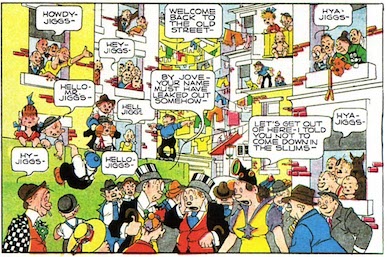
The process of assimilation has been a common theme of popular culture. For example, "lace-curtain Irish" refers to middle-class Irish Americans desiring assimilation into mainstream society in counterpoint to the older, more raffish "shanty Irish". The occasional malapropisms and social blunders of these upward mobiles were lampooned in vaudeville, popular song, and the comic strips of the day such as Bringing Up Father, starring Maggie and Jiggs, which ran in daily newspapers for 87 years (1913 to 2000).[311][312] In The Departed (2006), Staff Sergeant Dignam regularly points out the dichotomy between the lace-curtain Irish lifestyle Billy Costigan enjoyed with his mother, and the shanty Irish lifestyle of Costigan's father. Since the late 20th century popular culture has paid special attention to Mexican immigration;[313] the film Spanglish (2004) tells of a friendship of a Mexican housemaid (played by Paz Vega) and her boss (played by Adam Sandler).
Novelists and writers have captured much of the color and challenge in their immigrant lives through their writings.[314]
Regarding Irish women in the 19th century, there were numerous novels and short stories by Harvey O'Higgins, Peter McCorry, Bernard O'Reilly and Sarah Orne Jewett that emphasize emancipation from Old World controls, new opportunities and expansiveness of the immigrant experience.[315]
Fears of population decline have at times fueled anti-emigration sentiment in foreign countries. Hladnik studies three popular novels of the late 19th century that warned Slovenes not to migrate to the dangerous new world of the United States.[316] In India some politicians oppose emigration to the United States because of a supposed brain drain of highly qualified and educated Indian nationals.[317]
Jewish American writer Anzia Yezierska wrote her novel Bread Givers (1925) to explore such themes as Russian-Jewish immigration in the early 20th century, the tension between Old and New World Yiddish culture, and women's experience of immigration. A well established author Yezierska focused on the Jewish struggle to escape the ghetto and enter middle- and upper-class America. In the novel, the heroine, Sara Smolinsky, escapes from New York City's "down-town ghetto" by breaking tradition. She quits her job at the family store and soon becomes engaged to a rich real-estate magnate. She graduates college and takes a high-prestige job teaching public school. Finally Sara restores her broken links to family and religion.[318]
That film series premiered nearly a decade after the filmmakers' landmark documentary film Well-Founded Fear which provided a behind-the-scenes look at the process for seeking asylum in the United States. That film still marks the only time that a film crew was privy to the private proceedings at the U.S. Immigration and Naturalization Service (INS), where individual asylum officers ponder the often life-or-death fate of immigrants seeking asylum.
The documentary Trafficked with Mariana van Zeller argued that weapons smuggling from the United States contributed to insecurity in Latin America, itself triggering more migration to the United States.[324]
University of North Carolina School of Law professor Hiroshi Motomura has identified three approaches the United States has taken to the legal status of immigrants in his book Americans in Waiting: The Lost Story of Immigration and Citizenship in the United States. The first, dominant in the 19th century, treated immigrants as in transition; in other words, as prospective citizens. As soon as people declared their intention to become citizens, they received multiple low-cost benefits, including the eligibility for free homesteads in the Homestead Act of 1862,[325] and in many states, the right to vote. The goal was to make the country more attractive, so large numbers of farmers and skilled craftsmen would settle new lands.
By the 1880s, a second approach took over, treating newcomers as "immigrants by contract". An implicit deal existed where immigrants who were literate and could earn their own living were permitted in restricted numbers. Once in the United States, they would have limited legal rights, but were not allowed to vote until they became citizens, and would not be eligible for the New Deal government benefits available in the 1930s.
The third policy is "immigration by affiliation", originating in the later half of the 20th century, which Motomura argues is the treatment which depends on how deeply rooted people have become in the country. An immigrant who applies for citizenship as soon as permitted, has a long history of working in the United States, and has significant family ties, is more deeply affiliated and can expect better treatment.[326]
The American Dream is the belief that through hard work and determination, any American can achieve a better life, usually in terms of financial prosperity and enhanced personal freedom of choice.[327] According to historians, the rapid economic and industrial expansion of the U.S. is not simply a function of being a resource rich, hard working, and inventive country, but the belief that anybody could get a share of the country's wealth if he or she was willing to work hard.[328] This dream has been a major factor in attracting immigrants to the United States.[329]
12The Integration of Immigrants into American Society. National Academies of Sciences, Engineering, and Medicine. 2015. doi:10.17226/21746. ISBN978-0-309-37398-2. Archived from the original on April 2, 2020. Retrieved June 23, 2018. Americans have long believed that immigrants are more likely than natives to commit crimes and that rising immigration leads to rising crime ... This belief is remarkably resilient to the contrary evidence that immigrants are in fact much less likely than natives to commit crimes.
Martinez, Ramiro; Lee, Matthew T.; Nielsen, Amie L. (March 1, 2004). "Segmented Assimilation, Local Context and Determinants of Drug Violence in Miami and San Diego: Does Ethnicity and Immigration Matter?". International Migration Review. 38 (1): 131–57. doi:10.1111/j.1747-7379.2004.tb00191.x. ISSN1747-7379. S2CID144567229.
Kristin F. Butcher; Anne Morrison Piehl (Summer 1998). "Cross-city evidence on the relationship between immigration and crime". Journal of Policy Analysis and Management. 17 (3): 457–93. doi:10.1002/(SICI)1520-6688(199822)17:3<457::AID-PAM4>3.0.CO;2-F.
Wolff, Kevin T.; Baglivio, Michael T.; Intravia, Jonathan; Piquero, Alex R. (November 1, 2015). "The protective impact of immigrant concentration on juvenile recidivism: A statewide analysis of youth offenders". Journal of Criminal Justice. 43 (6): 522–31. doi:10.1016/j.jcrimjus.2015.05.004.
Reid, Lesley Williams; Weiss, Harald E.; Adelman, Robert M.; Jaret, Charles (December 1, 2005). "The immigration–crime relationship: Evidence across US metropolitan areas". Social Science Research. 34 (4): 757–80. doi:10.1016/j.ssresearch.2005.01.001.
Davies, Garth; Fagan, Jeffrey (May 1, 2012). "Crime and Enforcement in Immigrant Neighborhoods Evidence from New York City". The Annals of the American Academy of Political and Social Science. 641 (1): 99–124. doi:10.1177/0002716212438938. ISSN0002-7162. S2CID143497882.
Martinez, Ramiro Jr.; Stowell, Jacob I.; Iwama, Janice A. (March 21, 2016). "The Role of Immigration: Race/Ethnicity and San Diego Homicides Since 1970". Journal of Quantitative Criminology. 32 (3): 471–88. doi:10.1007/s10940-016-9294-9. ISSN0748-4518. S2CID147072245.
Light, Michael T.; Ulmer, Jeffery T. (April 1, 2016). "Explaining the Gaps in White, Black, and Hispanic Violence since 1990 Accounting for Immigration, Incarceration, and Inequality". American Sociological Review. 81 (2): 290–315. doi:10.1177/0003122416635667. ISSN0003-1224. S2CID53346960.
Adelman, Robert; Reid, Lesley Williams; Markle, Gail; Weiss, Saskia; Jaret, Charles (January 2, 2017). "Urban crime rates and the changing face of immigration: Evidence across four decades". Journal of Ethnicity in Criminal Justice. 15 (1): 52–77. doi:10.1080/15377938.2016.1261057. ISSN1537-7938. S2CID147588658.
Harris, Casey T.; Feldmeyer, Ben (January 2013). "Latino immigration and White, Black, and Latino violent crime: A comparison of traditional and non-traditional immigrant destinations". Social Science Research. 42 (1): 202–16. doi:10.1016/j.ssresearch.2012.08.014. PMID23146607.
↑Butler, Becoming America, The Revolution before 1776, 2000, pp.34–35 ISBN0-674-00091-9
↑The Oxford History of the British Empire, "The Eighteenth Century," Ed. P. J. Marshall, p.3 ISBN0-19-820563-5 the number given is at 80,000 less 29,000 Welsh which seems strange to the author, James Horn; Duncan also regards this as a "mystery"; it does not include the 50,000–120,000 convicts transported, most of whom were English
↑Encyclopedia of the Colonial and Revolutionary America, 1996 pp.200–02 ISBN0-306-80687-8; Jon Butler, Becoming America, The Revolution before 1776, 2000, pp.16–49 ISBN0-674-00091-9)
↑Whitman, James Q. (2017). Hitler's American Model: The United States and the Making of Nazi Race Law. Princeton: Princeton University Press. p.35. ISBN978-0-691-17242-2.
↑Hele, Karl S. (2008). Lines Drawn upon the Water: First Nations and the Great Lakes Borders and Borderlands. Wilfrid Laurier University Press. p.127. ISBN978-1-55458-004-0.
↑"Statistical Abstract of the United States: 1931"(PDF) (53rded.). Washington, D.C.: U.S. Department of Commerce, Bureau of Foreign and Domestic Commerce. August 1931. pp.103–107. Archived from the original(PDF) on March 29, 2021. Retrieved November 21, 2022.
↑Lazonick, William (2009). Sustainable Prosperity in the New Economy?: Business Organization and High-tech Employment in the United States. W.E. Upjohn Institute. p.157. ISBN978-0-88099-351-7.
↑Shah, Neil (May 3, 2015). "Immigrants to U.S. From China Top Those From Mexico". The Wall Street Journal. Archived from the original on May 5, 2015. Retrieved May 4, 2015. China was the country of origin for 147,000 recent U.S. immigrants in 2013, while Mexico sent just 125,000, according to a Census Bureau study by researcher Eric Jensen and others. India, with 129,000 immigrants, also topped Mexico, though the two countries' results weren't statistically different from each other.
↑Sullivan, Cheryl (January 15, 2011). "US Cancels "virtual fence"". Christian Science Monitor. Archived from the original on January 20, 2011. Retrieved January 19, 2011.
↑The New AmericansArchived December 20, 2008, at the Wayback Machine , Smith and Edmonston, The Academy Press. p. 58 ("Immigrants have always moved to relatively few places, settling where they have family or friends, or where there are people from their ancestral country or community.").
↑Hook, J.; Snyder, J. (2007). "Immigration, ethnicity, and the loss of white students from California public schools, 1990–2000". Population Research and Policy Review. 26 (3): 259–77. doi:10.1007/s11113-007-9035-8. S2CID153644027.
↑Charles H. Lippy, Faith in America: Organized religion today (2006) ch 6 pp. 107–27
↑Wadsworth, Tim (June 1, 2010). "Is Immigration Responsible for the Crime Drop? An Assessment of the Influence of Immigration on Changes in Violent Crime Between 1990 and 2000". Social Science Quarterly. 91 (2): 531–53. doi:10.1111/j.1540-6237.2010.00706.x. ISSN1540-6237.
Stowell, Jacob I.; Messner, Steven F.; Mcgeever, Kelly F.; Raffalovich, Lawrence E. (August 1, 2009). "Immigration and the Recent Violent Crime Drop in the United States: A Pooled, Cross-Sectional Time-Series Analysis of Metropolitan Areas". Criminology. 47 (3): 889–928. doi:10.1111/j.1745-9125.2009.00162.x. ISSN1745-9125.
Ferraro, Vincent (February 14, 2015). "Immigration and Crime in the New Destinations, 2000–2007: A Test of the Disorganizing Effect of Migration". Journal of Quantitative Criminology. 32 (1): 23–45. doi:10.1007/s10940-015-9252-y. ISSN0748-4518. S2CID144058620.
Stansfield, Richard (August 2014). "Safer Cities: A Macro-level analysis of Recent Immigration, Hispanic-owned Businesses, and Crime Rates in the United States". Journal of Urban Affairs. 36 (3): 503–18. doi:10.1111/juaf.12051. S2CID154982825.
12Warren, Patricia Y.; Tomaskovic-Devey, Donald (May 1, 2009). "Racial profiling and searches: Did the politics of racial profiling change police behavior?". Criminology & Public Policy. 8 (2): 343–69. doi:10.1111/j.1745-9133.2009.00556.x. ISSN1745-9133.
12Mustard, David B. (April 1, 2001). "Racial, Ethnic, and Gender Disparities in Sentencing: Evidence from the U.S. Federal Courts". The Journal of Law and Economics. 44 (1): 285–314. doi:10.1086/320276. ISSN0022-2186. S2CID154533225.
12Daudistel, Howard C.; Hosch, Harmon M.; Holmes, Malcolm D.; Graves, Joseph B. (February 1, 1999). "Effects of Defendant Ethnicity on Juries' Dispositions of Felony Cases1". Journal of Applied Social Psychology. 29 (2): 317–36. doi:10.1111/j.1559-1816.1999.tb01389.x. ISSN1559-1816.
↑Armenta, Amanda (2016). "Radicalizing Crimmigration: Structural Racism, Colorblindness, and the Institutional Production of Immigrant Criminality". Sociology of Race and Ethnicity. 3.
↑notably, National Research Council. (1997) "From Generation to Generation: The Health and Well-Being of Children in Immigrant Families". Washington D.C.: National Academy Press (Available here Archived December 22, 2007, at the Wayback Machine )
↑'Foreign and Foreign-Born Engineers in the United States: Infusing Talent, Raising Issues', Office of Scientific and Engineering Personnel, 1988. online textArchived November 11, 2011, at the Wayback Machine
↑William A. Wulf, President, National Academy of Engineering, Speaking before the 109th US Congress, September 15, 2005
↑Kerr, Sari Pekkala; Kerr, William R. (2011). "Economic Impacts of Immigration: A Survey"(PDF). Finnish Economic Papers. 24 (1): 1–32. Archived(PDF) from the original on November 13, 2018. Retrieved March 11, 2018.
↑Bodvarsson, Örn B; Van den Berg, Hendrik (2013). The economics of immigration: theory and policy. New York; Heidelberg [u.a.]: Springer. p.157. ISBN978-1461421153. OCLC852632755.
Borjas, George J. (November 1, 2003). "The Labor Demand Curve is Downward Sloping: Reexamining the Impact of Immigration on the Labor Market". The Quarterly Journal of Economics. 118 (4): 1335–74. CiteSeerX10.1.1.183.1227. doi:10.1162/003355303322552810. ISSN0033-5533.
Kerr, Sari Pekkala; Kerr, William R. (2011). "Economic Impacts of Immigration: A Survey"(PDF). Finnish Economic Papers. 24 (1): 1–32. Archived(PDF) from the original on November 13, 2018. Retrieved March 11, 2018.
Longhi, Simonetta; Nijkamp, Peter; Poot, Jacques (October 1, 2010). "Meta-Analyses of Labour-Market Impacts of Immigration: Key Conclusions and Policy Implications". Environment and Planning C: Government and Policy. 28 (5): 819–33. Bibcode:2010EnPlC..28..819L. doi:10.1068/c09151r. ISSN0263-774X. S2CID154749568.
↑Qian, Nancy; Nunn, Nathan; Sequeira, Sandra (2020). "Immigrants and the Making of America". The Review of Economic Studies. 87: 382–419. doi:10.1093/restud/rdz003. S2CID53597318.
↑Fairlie, Robert W.; Lofstrom, Magnus (January 1, 2013). "Immigration and Entrepreneurship". IZA Discussion Papers. Institute for the Study of Labor (IZA). Archived from the original on August 16, 2016.
↑Wu, Ashley (October 29, 2023). "Why Illegal Border Crossings Are at Sustained Highs". The New York Times. Archived from the original on December 22, 2023. The Times quotes data source: U.S. Customs and Border Protection, and notes: "Only encounters between ports of entry are shown."
↑Mary E. Williams, Immigration. (San Diego: GreenHaven Press, 2004). p. 85.
↑Rita James Simon and Mohamed Alaa Abdel-Moneim, Public opinion in the United States: studies of race, religion, gender, and issues that matter (2010) pp. 61–62
12"Summary"(PDF). NPR. Archived(PDF) from the original on January 28, 2012. Retrieved April 25, 2012.
↑Espenshade, Thomas J. and Belanger, Maryanne (1998) "Immigration and Public Opinion." In Marcelo M. Suarez-Orozco, ed. Crossings: Mexican Immigration in Interdisciplinary Perspectives. Cambridge, Mass.: David Rockefeller Center for Latin American Studies and Harvard University Press, pp. 365–403
↑Cooper, Betsy; Cox, Daniel; Lienesch, Rachel; Jones, Robert P. (March 29, 2016). "How Americans View Immigrants, and What They ... | PRRI". PRRI.org. Public Religion Research Institute. Archived from the original on November 17, 2017. Retrieved November 17, 2017.
↑James H. Dormon, "Ethnic Stereotyping in American Popular Culture: The Depiction of American Ethnics in the Cartoon Periodicals of the Gilded Age," Amerikastudien, 1985, Vol. 30 Issue 4, pp. 489–507
↑Rachel Rupin and Jeffrey Melnick, Immigration and American Popular Culture: An Introduction (2006)
↑James H. Dorman, "American Popular Culture and the New Immigration Ethnics: The Vaudeville Stage and the Process of Ethnic Ascription," Amerikastudien, 1991, Vol. 36#2 pp. 179–93
↑Yasmeen Abu-Laban and Victoria Lamont, "Crossing borders: Interdisciplinary, immigration and the melting pot in the American cultural imaginary," Canadian Review of American Studies, 1997, Vol. 27#2, pp. 23–43
↑Michael Rogin, Blackface White Noise: Jewish Immigrants in the Hollywood Melting Pot (1996)
↑Michael Frontani, "'From the Bottom to the Top': Frank Sinatra, the American Myth of Success, and the Italian-American Image," Journal of American Culture, June 2005, Vol. 28 Issue 2, pp. 216–30
↑William H. A. Williams, "Green Again: Irish-American Lace-Curtain Satire," New Hibernia Review, Winter 2002, Vol. 6 Issue 2, pp. 9–24
↑Kerry Soper, "Performing 'Jiggs': Irish Caricature and Comedic Ambivalence Toward Assimilation and the American Dream in George Mcmanus's 'Bringing Up Father'", Journal of the Gilded Age and Progressive Era, April 2005, Vol. 4#2, pp. 173–213,
↑David R. Maciel and María Herrera-Sobek, Culture across Borders: Mexican Immigration and Popular Culture (1998)
↑Thomas J. Ferraro, Ethnic Passages: Literary Immigrants in Twentieth-Century America (1993)
↑Eva Roa White, "Emigration as Emancipation: Portrayals of the Immigrant Irish Girl in Nineteenth-Century Fiction," New Hibernia Review, Spring 2005, Vol. 9 Issue 1, pp. 95–108
↑Miran Hladnik, "Slovene Popular Novels about Emigration in the Nineteenth Century", Slovene Studies, 1985, Vol. 7 Issue 1/2, pp. 57–62
↑Thomas J. Ferraro, "'Working ourselves up' in America: Anzia Yezierska's Bread Givers", South Atlantic Quarterly, Summer 19 90, Vol. 89 Issue 3, pp. 547–91. reprinted in Ferraro, Ethnic Passages, pp. 53–86
↑Helmer Lång, and Michael Brook, "Moberg, the Emigrant Saga and Reality," Swedish Pioneer Historical Quarterly, 1972, Vol. 23 Issue 1, pp. 3–24
↑Philip J. Anderson, "Introduction to Vilhelm Moberg's 'Why I Wrote the Novel about Swedish Emigrants'", Swedish-American Historical Quarterly, July 2008, Vol. 59#3 pp. 137–44
↑Roger McKnight, "Vilhelm Moberg, the Emigrant Novels, and their Changing Readers," Swedish-American Historical Quarterly, July 1998, Vol. 49 Issue 3, pp. 245–56
↑Gabor S. Boritt, Lincoln and the Economics of the American Dream (1994) p. 1
↑Elizabeth Baigent, "Swedish immigrants in McKeesport, Pennsylvania: Did the Great American Dream come true?" Journal of Historical Geography, April 2000, Vol. 26 Issue 2, pp. 239–72
↑Jim Cullen, The American Dream: A Short History of an Idea that Shaped a Nation. 2004. ISBN0-19-517325-2.
Gerber, David A. American Immigration: A Very Short Introduction (2011). ISBN0195331788
Gjerde, Jon, ed. Major Problems in American Immigration and Ethnic History (1998).
Glazier, Michael, ed. The Encyclopedia of the Irish in America (1999). ISBN0268027552
Jones, Maldwyn A. American immigration (1960) online
Joselit, Jenna Weissman. Immigration and American religion (2001) online
Parker, Kunal M. Making Foreigners: Immigration and Citizenship Law in America, 1600–2000. New York: Cambridge University Press, 2015. ISBN1107698510
Seller, Maxine (1984). Immigrant Women (2nded.). Albany, NY: State University of New York Press. ISBN978-0791419038.
Sowell, Thomas. Ethnic America: A History (1981). ISBN0465020755
Thernstrom, Stephan, ed. Harvard Encyclopedia of American Ethnic Groups (1980). ISBN0674375122
Before 1920
Alexander, June Granatir. Daily Life in Immigrant America, 1870–1920: How the Second Great Wave of Immigrants Made Their Way in America (Chicago: Ivan R. Dee, 2007. xvi, 332 pp.)
Joseph, Samuel; Jewish Immigration to the United States from 1881 to 1910 Archived May 15, 2023, at the Wayback Machine Columbia University Press, (1914).
Kulikoff, Allan; From British Peasants to Colonial American Farmers (2000), details on colonial immigration. ISBN0807848824
Lieberson, Stanley (2020) [1980]. A Piece of the Pie: Blacks and White Immigrants Since 1880. Berkeley: University of California Press. ISBN978-0520352865.
Meagher, Timothy J. The Columbia Guide to Irish American History. (2005). ISBN0231510705
Miller, Kerby M. Emigrants and Exiles (1985), influential scholarly interpretation of Irish immigration
Motomura, Hiroshi. Americans in Waiting: The Lost Story of Immigration and Citizenship in the United States (2006), legal history. ISBN0199887438.
Pochmann, Henry A. and Arthur R. Schultz; German culture in America; philosophical and literary influences, 1600–1900 (1957)
Waters, Tony. Crime and Immigrant Youth Sage Publications (1999), a sociological analysis. ISBN145226337X
U.S. Immigration Commission, Abstracts of Reports, 2 vols. (1911); the full 42-volume report is summarized (with additional information) in Jeremiah W. Jenks and W. Jett Lauck, The Immigrant Problem (1912; 6th ed. 1926)
Wittke, Carl. We Who Built America: The Saga of the Immigrant (1939), covers all major groups
Yans-McLaughlin, Virginia ed. Immigration Reconsidered: History, Sociology, and Politics Oxford University Press. (1990) ISBN019536368X.
Recent: post 1965
Beasley, Vanessa B. ed. Who Belongs in America?: Presidents, Rhetoric, And Immigration (2006) ISBN1585445053
Bogen, Elizabeth. Immigration in New York (1987) ISBN0275921999
Bommes, Michael and Andrew Geddes. Immigration and Welfare: Challenging the Borders of the Welfare State (2000) ISBN0415223725.
Borjas, George J.Heaven's Door: Immigration Policy and the American Economy. Princeton, N.J.: Princeton University Press, 1999. xvii, 263 pp. ISBN0-691-05966-7.
Borjas, George J., ed. Issues in the Economics of Immigration (National Bureau of Economic Research Conference Report) (2000). ISBN0-226-06631-2.
Borjas, George. Friends or Strangers (1990) ISBN0465025676.
Garland, Libby. After They Closed the Gate: Jewish Illegal Immigration to the United States, 1921–1965. Chicago: University of Chicago Press, 2014. ISBN022612259X
Hidalgo, Javier (2018). "26. The Libertarian Case for Open Borders". In Brennan, Jason; van der Vossen, Bas; Scmidtz, David (eds.). The Routledge Handbook of Libertarianism. New York: Routledge. pp.377–389. ISBN978-0367870591. OCLC978902248.
Lamm, Richard D., and Gary Imhoff. The Immigration Time Bomb: the Fragmenting of America, in series, Truman Talley Books. 1st ed. New York: E.P. Dutton, 1985. xiii, 271 pp. ISBN0-525-24337-2.
Portes, Alejandro, and Rubén Rumbaut. Immigrant America. Berkeley, CA: University of California Press, 1990. ISBN0520070380.
Reimers, David. Still the Golden Door: The Third World Comes to America. New York: Columbia University Press, (1985). ISBN0231057709.
Smith, James P., and Barry Edmonston, eds. The Immigration Debate: Studies on the Economic, Demographic, and Fiscal Effects of Immigration (1998), online version; Archived March 20, 2021, at the Wayback Machine .
↑Those are traditions and denominations that trace their history back to the Protestant Reformation or otherwise heavily borrow from the practices and beliefs of the Protestant Reformers.
123456This is more of a movement then an institutionalized denomination.
↑Denominations that don't fit in the subsets mentioned above.
↑Those are traditions and denominations that trace their origin back to the Great Awakenings and/or are joined together by a common belief that Christianity should be restored along the lines of what is known about the apostolic early church.
↑The Holiness movement is an interdenominational movement that spreads over multiple traditions (Methodist, Quakers, Anabaptist, Baptist, etc.). However, here are mentioned only those denominations that are part of Restorationism as well as the Holiness movement, but are not part of any other Protestant tradition.
This page is based on this Wikipedia article Text is available under the CC BY-SA 4.0 license; additional terms may apply. Images, videos and audio are available under their respective licenses.