The Chinese American community is the largest Chinese community outside Asia and the third-largest community in the Chinese diaspora,behind the Chinese communities in Thailand and Malaysia. The 2022 American Community Survey of the U.S. Census estimated the population of Chinese Americans at 5,465,428,including 4,258,198 who were Chinese alone,and 1,207,230 who were part Chinese.[6][7] The 2010 census numbered the Chinese American population at about 3.8 million.[8] In 2010,half of the Chinese-born people in the United States lived in California and New York.[9] About half of the Chinese people in the U.S. in the 1980s had roots in Taishan.[10] Much of the Chinese population before the 1990s consisted of Cantonese or Taishanese-speaking people from Guangdong province. During the 1980s,more Mandarin-speaking immigrants from Northern China and Taiwan immigrated to the U.S.[11] In the 1990s,Fujianese immigrants arrived,many illegally,particularly in the New York City area.[12]In the 1800s and 1890s Chinese and Chinese Americans lived almost entirely in Western states,especially California and Nevada,as well as New York City.
Most early Chinese migrants were young men from villages of Toisan,as well as the eight districts in Guangdong Province.[13] They were motivated to leave by floods and famine in the mid-nineteenth century,as well as mass political unrest such as the Red Turban unrest and the Punti-Hakka Clan Wars.[14] The vast majority came from a small area of eight districts on the west side of the Pearl River Delta. The eight districts consist of three subgroups—the four districts of Sze Yup,the district of Chung Shan,and the three districts of Sam Yup—each subgroup speaking a distinct dialect of Cantonese. Immigrants from Sze Yup generally worked as laborers;those from Chung Shan specialized in agriculture;and those from Sam Yup became entrepreneurs.[15]
California gold rush and railroad construction
In the 1850s,Chinese workers migrated to work in the California gold rush,[16][17][18][19] and also to do agricultural jobs and factory work,especially the garment industry.[14] Some became entrepreneurs. Chinese often settled in ethnic neighborhoods called Chinatowns. In 1852,there were 25,000 Chinese migrants in America. After coming to the United States,these immigrants learned a lot of new knowledge about transportation,communications,architecture,medical care that they could not get in China. They also learned new Western culture,including new food,religion,life.
Chinese American fisherman at Monterey,CA,circa 1875
In 1862,the Pacific Railroad Acts led the Central Pacific Railroad to recruit labor gangs to build on the transcontinental railroad,most of whom were Irish. Later,these workers were accused of being "unsteady men and unreliable."[20] Only a few Chinese were hired,but the employers found them quick to learn,careful and frugal,and paid less than white workers. Construction Superintendent J.H. Strobridge and the acting chief engineer,Samuel S. Montague were impressed by the experience and efficiency of the Chinese workers. They reported that Chinese workers laid 10 miles and 56 feet of track in a single day on April 28,1869.[21]
However,Chinese workers had their own "community",with their own chefs and accountants. They arranged their own board,including imported Chinese staples,such as dried shellfish,fish,fruits,vegetables,and seaweed,as well as local products. Observers recount that these railroad workers bathed daily,changing into clean clothes after work,and preferred to build their own dugouts and stone shelters rather than use company-provided tents. The Chinese railroad workers,it is recounted,kept to themselves and,other than gambling,enjoyed few vices.[21]
Chinese laborers built the majority of the difficult route through the Sierra Nevada mountains and across Nevada. Some died in the heat of Nevada's summers and cold winters. In June 1867,to make up for the progress lost in the winter weather,the management decided to increase working hours. Chinese workers organized a strike. Although they were spread out over several miles of the line in numerous camps,they communicated closely and coordinated a work stoppage.[22] In the end,the company raised their wages,but only slightly.
The 1870 U.S. Census recorded 63,199 Chinese in the United States,[23] and by 1890,the number had increased to 126,778.[24] It was still difficult to obtain citizenship. In 1871,a white supremacist mob attacked Los Angeles' Chinatown and killed nineteen Chinese residents. Those lynched and shot likely included former railroad workers.[25] The 1882 Chinese Exclusion Act forced more Chinese to leave the United States.
The Burlingame–Seward Treaty of 1868 between the United States and Qing China specified the rights of Chinese to immigrate,[14] but the Page Law of 1875 banned female Chinese migrants from entering the country. Upon arrival Chinese men and women were separated,often for weeks,as they awaited hearings on their immigration status. The women were subjected to detailed questioning on their family life and origins and their responses were compared with others from their village. Discrepancies were used to justify denial of entry. The stress and delay caused many women to fall ill,even to commit suicide. Once they were allowed into the country,women migrants faced additional challenges. Many were coerced into prostitution;in 1878 over 60% of the adult Chinese women in California in 1870 worked in the sex trade. Some had been lured by the promise of marriage only to become sex slaves,while others came to reunite with their families. Ninety percent of the Chinese women who immigrated between 1898 and 1908 did so to join a husband or father. By 1900,only 4,522 of the 89,837 (5%) Chinese migrants were women.
In 1880,the diplomat James B. Angell negotiated a new treaty with Qing China. The Angell Treaty of 1880 restricted Chinese immigration and banned the naturalization of Chinese migrants,then the Chinese Exclusion Act of 1882 prohibited all Chinese from immigrating for 10 years and required all Chinese to carry identification. This was the first act in American history to restrict immigration. Then,six years later,the Scott Act of 1888 illegalized reentry to the United States after a visit to China,even for long-term legal residents.
In 1892,the Geary Act extended provisions in the Chinese Exclusion Act,and in 1902,the prohibition was expanded to cover Hawaii and the Philippines,despite the strong objections from the Chinese government and people.[14] The Chinese community,however,turned to the courts for redress. In 1898,the United States v. Wong Kim Ark was argued before the Supreme Court,and the decision was that ethnic Chinese born in the United States were American citizens.
The Chinese Exclusion Acts remained part of the law until 1943. With relations already complicated by the Treaties of Wangxia and Tianjian,the increasingly harsh restrictions on Chinese immigration combined with the rising discrimination against Chinese living in the United States in the 1870s-early 1900s.[14]
The Chinese Exclusion Repeal Act, passed in 1943, allowed Chinese immigration at the rate set by the Immigration Act of 1924, which was 2% of the Chinese American population in 1890. In 1949 the Chinese Communist Party won the Chinese Civil War and refugees from the conflict came to settle. The 1924 Immigration Act's quota system for was repealed when Lyndon B Johnsen signed the 1965 Immigration and Nationality Act, which increased the cap for Chinese immigrants.[26] Since the United States did not formally recognize the People's Republic of China, Chinese Refugees in the 1960s and 1970s had come almost exclusively from Hong Kong and Taiwan. Richard Nixon's visit to China in 1972 led to formalization of relations in 1979, allowing travel to resume. The Taiwan Relations Act of 1979 further separated Taiwan and Chinese immigration quotas as well as formalizing relations.[27]
The Second Wave of Chinese Immigrants consisted mostly of Hong Kong and Taiwanese nationals as well as students and professionals. The Aid Refugee Chinese Intellectuals initiative in 1952 helped Chinese refugees with more than two years of college move into America. Additionally thousands of Chinese students after the Chinese Civil War were unable to return to mainland China.[28]
In the 1980s and 1990s Chinese immigration continued to increase, with the number of Chinese Americans breaking 1 million by the 2000s.[29] New Chinatowns emerged in Flushing and 8th Avenue in New York City and Richmond in San Francisco and existing Chinatowns expanded to accommodate the influx of Chinese immigrants.
Economic growth in the People's Republic of China has given mainland Chinese more opportunities to emigrate. A 2011 survey showed that 60% of Chinese millionaires were planning to emigrate, with 40% of Chinese millionaires selecting the United States as the top destination for immigration.[30] Under the EB-5 program, applicants, together with their spouses and unmarried children under 21 years old will be eligible to apply for U.S. permanent residency as a group. Because the EB-5 program allows applicants to apply as a family, it has been reported to be a significant method for Chinese students to obtain authorization to work in the United States. Chinese multimillionaires benefited most from the EB-5 Immigrant Investor Program in the U.S. in 2021, as long as one has at least US$500,000 to invest in projects listed by United States Citizenship and Immigration Services (USCIS), where it is possible to get an EB-5 green card that comes with permanent U.S. residency rights, but only in states specified by the pilot project.[31][32] The H-1B visa is also becoming one of the main immigration pathways for the Chinese with 9% of the approved petitions in 2016.[33]
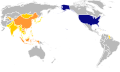
States with the largest estimated Chinese American populations
Percentage of Chinese population in the United States, 2000
The states with the largest estimated Chinese American populations, according to the 2010 Census, were California (1,253,100; 3.4%), New York (577,000; 3.0%), Texas (157,000; 0.6%), New Jersey (134,500; 1.5%), Massachusetts (123,000; 1.9%), Illinois (104,200; 0.8%), Washington (94,200; 1.4%), Pennsylvania (85,000; 0.7%), Maryland (69,400; 1.2%), Virginia (59,800; 0.7%), and Ohio (51,033; 0.5%). The state of Hawaii has the highest concentration of Chinese Americans at 4.0%, or 55,000 people.
Population centers of Chinese Americans
According to the 2024 Census estimates,[37] the three metropolitan areas with the largest Chinese American populations were the Greater New YorkCombined Statistical Area at 924,619 people, the San Jose-San Francisco-Oakland Combined Statistical Area at 793,801 people, and the Los Angeles Area Combined Statistical Area at about 737,039 people. Together these three metropolitan areas account for half of the total Chinese population in the US. New York City contains by far the highest ethnic Chinese population of any individual city outside Asia, estimated at 635,355 as of 2024. The Los Angeles County city of Monterey Park has the highest percentage of Chinese Americans of any municipality, at 43.7% of its population, or 24,758 people.
San Francisco, California has the highest per capita concentration of Chinese Americans of any major city in the United States, at an estimated 21.4%, or 172,181 people, and contains the second-largest total number of Chinese Americans of any U.S. city. San Francisco's Chinatown was established in the 1840s, making it the oldest Chinatown in North America and one of the largest neighborhoods of Chinese people outside of Asia,[42][43] composed in large part by immigrants hailing from Guangdong province and also many from Hong Kong. The San Francisco neighborhoods of Sunset District and Richmond District also contain significant Chinese populations. Houston, Texas is also another population center for Chinese Americans, as it contains the highest percentage of Chinese Americans in the Southern United States.
In addition to the big cities, smaller pockets of Chinese Americans are also dispersed in rural towns, often university-college towns, throughout the United States. For example, the number of Chinese Americans, including college professors, doctors, professionals, and students, has increased over 200% from 2005 to 2010 in Providence, Rhode Island, a small city with a large number of colleges.
According to the United States Census Bureau, the varieties of Chinese make up the third-most spoken language in the United States. It is spoken mainly within Chinese American populations and by immigrants or the descendants of immigrants.[44] In 2002, over 2 million Americans speak some variety or dialect of Chinese, with Standard Chinese (Mandarin) becoming increasingly common due to new immigration from China and supplanting the previous widespread Cantonese and Taishanese.[44]
Although many Chinese Americans grow up learning English, some teach their children to speak Chinese for preservation of an ancient civilization, preservation of a group identity, preservation of their cultural ancestry, desire for easy communication with each other and their relatives, and the perception that Chinese is a very useful language. The official standard for United States public notices and signage is Traditional Chinese.[46]
The majority of Chinese Americans do not report a religious affiliation. 43% switched to a different religion and 54% stayed within their childhood religion. According to the 2012 Pew Research Center Asian-American Survey, 52% of Chinese Americans aged 15 and over said that they did not have any religious affiliation. This is also compared with the religious unaffiliation of Asian-American average of 26% and a national average of 19%. Of the survey respondents, 15% were Buddhist, 8% were Catholic, and 22% belonged to a Protestant denomination. About half of Chinese Americans (52%)—including 55% of those born in the U.S. and 51% of those born overseas—describe themselves as religiously unaffiliated.[4][47]
The higher percentage of Chinese Christians in the United States than in China can only be partially explained by the fact that some Chinese Christians immigrate to the United States due to persecution,[48][49] since most Chinese Christians convert in the United States, not China.[50][51][52]
Judy Chu (D‑CA28th), the first female Chinese American elected to Congress
This section needs to be updated. Please help update this article to reflect recent events or newly available information.(January 2026)
Chinese Americans vary by language, religion, generational status, age and socioeconomic status and have varying political priorities and goals. As of 2013, Chinese Americans were the least likely Asian-American ethnicity to be affiliated with a political party.[53] They cluster in majority-Democratic states and voted Democratic in early twenty-first century presidential elections, as did other Asian Americans except Vietnamese Americans.[54]
17 to 20 Chinese immigrants were murdered during the Chinese massacre of 1871 in Los Angeles.An illustration of the Rock Springs massacre of 1885, in which at least 28 Chinese immigrants were killed
This section needs to be updated. Please help update this article to reflect recent events or newly available information.(January 2026)
Perceptions and stereotypes
A 2007 analysis indicated that most non-Asian Americans do not differentiate between Chinese Americans and East Asian Americans generally, and perceptions of both groups are nearly identical.[55] A 2001 survey of Americans' attitudes toward Asian Americans and Chinese Americans indicated that one fourth of the respondents had somewhat or very negative attitude toward Chinese Americans in general.[56] However, the study did also find several positive perceptions of Chinese Americans: strong family values (91%); honesty as entrepreneurs (77%); high value on education (67%).[55]
Early Chinese Americans struggled to survive in the United States as a result of prejudice, discrimination, and violence.
In 1880, motivated by yellow peril and sensationalism surrounding the upcoming presidential election, a mob numbering 3,000 instigated an anti-Chinese riot in Denver, Colorado. A man named Look Young was lynched, and nearly all of Chinatown was destroyed. 185 Chinese men were held in jail for three days for their own safety. Most of the rioters arrested were dismissed, and the alleged murderers of Look Young were tried and found not guilty.[57][58]
In 1871, 17–20 Chinese immigrants were murdered in Los Angeles by a mob of around 500 men. This racially motivated massacre was one of the largest mass-lynchings in the United States, and it took place after the accidental killing of Robert Thompson, a local rancher.
The Rock Springs massacre occurred in 1885, in which at least 28 Chinese immigrants were killed and 15 other Chinese were injured. Many enraged white miners in Sweetwater County felt threatened by the Chinese and blamed them for their unemployment. As a result of competition for jobs, white miners expressed their frustration by committing acts of physical violence in which they robbed, shot, and stabbed Chinese in Chinatown. The Chinese quickly tried to flee, but in doing so, many of them ended up being burned alive in their homes, starving to death in hiding places, or being exposed to animal predators in the mountains; some of them were successfully rescued by a passing train. A total of 78 homes were burned.
During the Hells Canyon massacre of 1887, at least 34 Chinese miners were killed. An accurate account of the event is still unavailable, but it is speculated that the Chinese miners were killed by gunshot during a robbery by a gang of seven armed horse thieves.
In 2008, researchers Georg Hsu and Yu Mui Wan published a paper citing severe stigma of mental illness in the Chinese American community as a barrier to diagnosis and treatment.[59] In a 1998 study of 29 diagnosed depressive Chinese American immigrants, more than half of respondents avoided labeling their symptoms as depression.[60] While patients were able to accurately identify and report depressive symptoms such as "irritability" and "rumination," patients were more likely to attribute their depression to somatic and physical symptoms than as a psychological state.[60]
Among Asian-American youth in 1980, suicide accounted for 20.8% of Chinese American female deaths.[61] Among males, it constituted 15.1% of deaths.[61] The study also reported that suicide rates among Chinese American elderly were higher than that of the national suicide rate for African-American, Hispanic, and Native-American people.
A study published in the Journal of Aging and Health stated that 18% to 29.4% of older Chinese adults in North America had at least a mild level of depression which was higher than other ethnic groups.[62] Further, the study reported that these depressive symptoms among older Chinese adults "tend to remain untreated."[62]
Before 1882, there were no limits on immigration to the United States, but with the Chinese Exclusion Act, for the first time in American history, immigration was deemed illegal. This legislation was partially repealed in 1943 with the Magnuson Act, and only fully repealed in 1965. The history of illegal immigration of Chinese people to the United States go back to the 19th century.[63] Smuggling of immigrants without authorization increased during 1990s following policy changes by the American government, but by the 21st century, some have returned to China due to its growing economy.[64] By 2017, it is estimated that more than a quarter million immigrants reside in the United States without authorization from China.[65] In 2015, there were about 39,000 Chinese nationals who were supposed to be deported; however, the People's Republic of China government had not provided paperwork to verify their citizenship.[66] In 2017, China was described as having become one of the leading sources of new immigrants without authorization.[67]
Socioeconomics
Income and social status
Income and social status of Chinese American locations vary widely. Although many Chinese Americans in Chinatowns of large cities are members of an impoverished working class, others are well-educated upper-class people living in affluent suburbs. The upper and lower-class Chinese are also widely separated by social status and class discrimination. In California's San Gabriel Valley, for example, the cities of Monterey Park and San Marino are both Chinese American communities lying geographically close to each other but they are separated by a large socioeconomic gap.
The model minority myth
High levels of achievement among some groups led to a perception of Chinese Americans as a "model minority". This stereotype was presented as positive, but has complicated implications for both Chinese Americans and other minority groups. Historical evidence suggests this narrative emerged partially as a political tool during the Civil Rights era.[68]
Early immigration patterns were significantly shaped by discriminatory policies, particularly during the Chinese Exclusion Era (1882–1943). These restrictions had lasting effects on community formation and cultural identity.[69]
Educational attainment
This section needs to be updated. Please help update this article to reflect recent events or newly available information.(January 2026)
The Chinese American community shows a range of educational attainment and a split between recent immigrants from China and earlier immigrants who came mainly from Taiwan and Hong Kong. The earlier immigrants have a higher percentage working in white collar and professional occupations, and earn higher median household incomes compared to other demographic groups.[70] Chinese Americans, like other East Asian Americans, typically have above-average achievement and higher educational attainment rates compared to other ethno-racial grops.[71] Chinese Americans have high averages in tests such as SAT, ACT, GRE. Although verbal scores lag somewhat due to the influx of new immigrants, combined SAT scores have also been higher than for most Americans.[72] Chinese Americans are more likely to apply to elite higher education institutions than other groups.[73][74][75][76] Chinese Americans are also disproportionately represented among US National Merit Scholarship awardees, and constitute 13% of the students at Ivy League universities and other institutions.[77][78][79]
Largely driven by enrollment of Chinese citizens, 25% of the recipients of American PhD in science and engineering are of Chinese descent.[80]
Level of education
U.S. Census Bureau of Labor Statistics in 2021 found high levels of education. 58.6% of Chinese Americans have attained at least a bachelor's degree, compared with 35.0% nationally and 56.4% for all Asian-American groups. The 2021 U.S. Census also reports that 60.6% of Chinese American men attained a bachelor's degree and 56.9% of Chinese American women attained at least a bachelor's degree, 31.0% of Chinese Americans possess at least a master's, doctorate or other graduate and professional degree, compared to 25.8% for all Asian Americans, and is a little more than two times above the national average of 13.8%.[81] The 2021 Census also reports that 64.9% of Chinese American men and 61.3% of Chinese American women work in a white-collar profession, compared to 57.5% for all Asian Americans, and is a little more than one and a half times above the national average of 42.2%.[81]
Bachelor's degree or higher educational attainment[81]
Technology conglomerates such as eBay located within high-technology centers across the United States, including California's Silicon Valley, have become attractive destinations of employment for Chinese Americans with technical skill-sets and foreign-born Chinese technology entrepreneurs looking to start or expand their own high-technology companies.
Perceptions and change
There has been a significant change in the perceptions about Chinese Americans among the general American populace. In as little as a century of American history, stereotypes of Chinese and other East Asian Americans have changed from being perceived as indentured and uneducated coolie laborers who were perpetually entangled in an endlessly hopeless cycle of socioeconomic destitution towards a modern juxtaposed portrayal of them being an intelligent, conscientious, and a highly educated minority group. Most Chinese Americans work as white-collar professionals, many of whom are highly educated and salaried professionals whose work is largely self-directed in management, professional, and related occupations such as engineering, medicine, finance, law, and academia. 63.1% of Chinese Americans work in white-collar professions compared with 57.5% for all Asian Americans and a U.S. national average of 42.2%.[81] Chinese Americans also make up a third of the Asian-American high-tech professional workforce and one-tenth of the entire Silicon Valley workforce.[83] Chinese American unemployment rates are comparable with the general U.S. population average with a figure of 6.4% compared to a national rate of 6.3% in 2021.[81]
Medicine
Between 2008 and 2017, the number of Chinese-educated physicians practicing in the United States rose by 38.1%, and the total number of Chinese-educated physicians actively practicing in the United States was about 0.6% of the active physician workforce in 2017.[84]
Technology
A significant number of Chinese Americans, who possess the required specialized expertise and qualifications in engineering and highly-technical domains, have gravitated towards Silicon Valley, the prominent hub of high-technology in the United States in search of job prospects or to establish their own high-technology start-up business ventures. Many up-and-coming foreign-born Chinese and Chinese-American technology entrepreneurs endeavor to leverage their technical skillsets by initiating the new promising high-technology startups of tomorrow. Such ambitiously aspirant technology entrepreneurs benefit from the fulsome availability of venture capital, profound business acumen, and enticing financial incentives prevalent in the region, all strategically aimed and specifically tailored at fostering and nurturing technological innovation. Ethnic Chinese have been successful in starting new firms in technology centers across the United States. Chinese Americans have enjoyed a vast disproportion of entrepreneurial and investment success in various U.S.-based high-technology centers and sectors, as evidenced by the 2010 Goldsea 100 Compilation of America's Most Successful Asian Entrepreneurs.[85] Chinese Americans accounted for 4% of people listed in the 1998 Forbes Hi Tech 100 List.[86]
Annalee Saxenian, a UC Berkeley professor, whose scholarly research interests include the contribution of Chinese immigrants on America's high-technology realm carried out a study that showed that since 1998, one out of five high-tech start-ups in Silicon Valley were led by a Chinese American. During the same year, 5 of the 8 fastest growing high-technology companies in Silicon Valley had a leading upper-level management executive who was of Chinese ancestry, except for Yahoo, whose Jerry Yang was a founder and owner, but was not serving in an executive leadership position. In Silicon Valley, several Chinese American community organizations, numbering from two to three dozen, actively strive to look out for and are committed to safeguarding the professional interests and well-being of the Chinese American community. These organizations boast membership counts with at least 100 individual members, with one particularly influential group being the Committee of 100.[87] Immigrants from mainland China and Taiwan were key founders in 12.8% of all Silicon Valley start-ups between 1995 and 2005.[88] Almost 6% of the immigrants who founded companies in the innovation/manufacturing-related services field are from China.[89]
Research funded by the Public Policy Institute of California indicates that in 1996, 1,786 Silicon Valley technology companies with $12.5 billion in sales and 46,000 employees were run by executives of Indian or Chinese descent. Moreover, the pace of entrepreneurship among local immigrants has been increasing rapidly. While executives of Chinese or Indian origin were at the helm of 13% of the Silicon Valley technology businesses started between 1980 and 1985, they were also running 27% of the more than 4,000 businesses started between 1991 and 1996.[90] Start-up firms remain a primary source for new ideas and innovation for Chinese American internet entrepreneurs. Many of them are employed or directly engaged in new start-up activities. The proportional share of start-up firms by ethnic Chinese in Silicon Valley skyrocketed from 9% in 1980–1984 to about 20% between 1995 and 1998.[91] By 2006, Chinese American high-technology entrepreneurs were behind 20 percent of all Silicon Valley start-up firms, leading 2000 Silicon Valley companies, and employing 58,000 workers.[80] Today, Chinese Americans still continue to own about 20% of all U.S.-based information technology companies that were founded in Silicon Valley since 1980.
Numerous professional organizations in perspective in the 1990s as a support network for fellow Chinese American high tech start-ups in the valley.[92] Between 1980 and 1999, 17% of the 11,443 high-tech firms in Silicon Valley—including some 40 publicly traded firms were controlled by an owner of Chinese ancestry. In 1990, Chinese Americans made up a third of the Asian-American high-tech professional workforce in addition to 11% of the entire Silicon Valley professional workforce. In 1998, Chinese Americans managed 2001 firms, employing 41,684 workers, and ran up 13.2 billion in sales. They also accounted for 17% of all Silicon Valley high-technology business owners, 10% of the professional high-technology workforce in the Valley, and 13.5% of the total sales all while accounting for less than 1% of the U.S. population at the time.[93]
Self-employment and entrepreneurship
Chinese Americans are also noted for their high rates of self-employment, as they have an extensive history of starting and owning their own businesses through various means of self-employment dating back to the California Gold Rush in the 1880s.[94] However, as more recent generations of Chinese Americans who have chose to seek higher education as another gateway to elevate themselves socioeconomically, rates of self-employment have been generally lower than population average.[95] In 2007, there were over 109,614 Chinese-owned employer firms, employing more than 780,000 workers, and generating more than $128 billion in revenue.[96]
When Chinese Americans were largely excluded from the American labour markets during the 19th century, many of them started their own businesses.[97] The community is also noted for their high rates of self-employment, as Chinese Americans have an extensive history of starting and owning their own businesses through various means of self-employment dating back to the California Gold Rush in the 1880s.[94] In 2007, there were over 109,614 Chinese-owned employer firms, employing more than 780,000 workers, and generating more than $128 billion in revenue.[96] Restaurants has continued and still remain among the most common business establishment started by Chinese Americans as Chinese food remains a staple composition in contemporary Chinese American culture. Fast casual restaurant establishments such as Manchu Wok, Panda Express, and Pick Up Stix were founded by Chinese Americans. Panda Express is a famous fast casual restaurant chain serving American Chinese cuisine in the United States founded by restaurateur Andrew Cherng and is one of the biggest Chinese American fast food establishments in the United States.[98] Chinese cuisine-style restaurants account for one third of all the ethnic restaurants in the United States, with a glut of them concentrated in New York City alone, where many Chinese emigrants have also opened up restaurants serving non-Chinese culinary offerings such as taco stands and sushi bars.[99] Beyond the restaurant industry, Chinese Americans have also owned convenience and grocery stores, professional offices such as medical and law practices, laundromats, beauty parlours, and hair salons to establishing numerous and influential Silicon Valley high-technology companies that have become very successful and influential in the American economy. Several influential Chinese American businessmen such as the transplant surgeon Patrick Soon-Shiong, computer hardware engineer Ming Hsieh, and internet entrepreneur Jerry Yang have become billionaires in the process and have regularly topped the Forbes 400 list of richest Americans in the past.[86] However, more recent generations of Chinese Americans who possess the academic qualifications to enter university have chosen to seek to enter the realm of American higher education as another gateway to elevate themselves socioeconomically, rates of self-employment have been generally lower than population average in contemporary America.[95] Despite the community's above-average academic performance and possession of sterling educational credentials, Chinese Americans still continue face barriers when advancing up the corporate ladder - particularly at American Fortune 500 corporations - due to the prevailing stereotypes of Chinese and other East Asian Americans as possessing quiet and passive personalities, traits that do not necessarily translate well when they enter the suites of corporate America as they perceived to lack rudimentary interpersonal skills, leadership qualities, and English language competency. Nonetheless, the number of Asian Americans on the boards of 750 publicly held American companies increased from 15 to 26 from 1992 to 1995, where among the Asian Americans that rose to the top of the corporate boards were either Chinese or Japanese Americans.[97]
Among Chinese-owned American firms, 40% were in the professional, scientific, and technical services sector, the accommodation and food services sector, and the repair, maintenance, personal, and laundry services sector. Chinese-owned U.S. firms were 2% of all U.S. businesses in these sectors. Wholesale trade and accommodation and food services accounted for 50.4% of Chinese-owned business revenue. 66,505 or 15.7% of Chinese-owned firms had receipts of $250,000 or more compared with 2% for all U.S. businesses.[96][100][101][102][103][104]
Economics
With their above average educational attainment rates, Chinese Americans from all socioeconomic backgrounds have achieved significant advances in their educational levels, occupational prestige, personal and household income, life expectancy, and other socioeconomic indicators. As the fulsome financial and socioeconomic opportunities offered by the United States have lifted many Chinese Americans out of poverty, and has allowed much of the community to channel their social mobility by elevating them into the ranks of America's middle and upper middle class, as well as the enjoyment of substantially high wellbeing relative to other minority ethno-racial groups in the United States.[105] Although the aggregate economic performance and situation of Chinese Americans remains highly positive, Chinese American wealth varies greatly by region across the country: For instance, in New York City, 22% of Chinese Americans live in poverty.[106]In 2022, income inequality among Chinese Americans was the greatest compared to other Asian American populations, and had also increased the most between 1980 and 2022.[107]
Chinese Americans are more likely to own homes than the general American population. According to the 2000 U.S. Census, 65% of Chinese Americans owned a home, higher than the total population's rate of 54%.[108][109] In 2003, real estate economist Gary Painter of the University of Southern California Lusk Center for Real Estate Research found out that when comparing homeowners with similar income levels Los Angeles, the Chinese American home-ownership rate was 20% higher than Whites; in San Francisco, it was 23% higher; and in the New York metropolitan area, it was 18% higher.[110] A 2008 Asian Real Estate Association of America report released on behalf of the American community survey found that Chinese Americans living in the states of Texas, New York, and California all had high home ownership rates that were significantly near or above the general population average.[111]
According to the 2020 U.S. census, Chinese American men had a full-time median income of $91,138 and Chinese American women had a median income of $75,148. Chinese Americans also have one of the highest median household incomes relatively in comparison to other East Asian American populations.
Despite overwhelmingly positive economic indicators and socioeconomic patterns compared to other non-white ethno-racial groups in the United States, a number of economic deterrents have been noted to afflict the Chinese American community including institutionalized discrimination against STEM researchers, engineers, and scientists of Chinese descent. While the median income of Chinese American households remains above most non-white ethno-racial groups in the United States, studies after the Great Recession revealed that East Asian men have witnessed the highest rate of persistent long-term unemployment.[112] In addition, studies have shown that Asian Americans have been discriminated against in companies with lower pay grades, even in larger high-tech corporate settings such as Google.[113]
A research on the whole genome patterns of common DNA variation in different human populations (African-American, Asian-American and European American) finds some common single-nucleotide polymorphisms (SNPs) in these three populations with diverse ancestry.[115] In the samples of Han Chinese in America, 74% of the total SNPs have two alleles, and majority of the segregating SNPs have a minor allele frequency (MAF) greater than 10%. Another noticeable point is that MAFs show similar distributions in European-American and Han Chinese populations. Besides, rarer haplotype is found to be absent in the samples of Han Chinese, and they also possess a high level of redundancy.[citation needed]
A study analyzing East Asian Genetic Substructure using genome-wide SNP arrays is carried out with greater than 200,000 genotypes from people of East Asian ancestry.[116] The continental populations are from the Human Genome Diversity Panel (Cambodian, Yi, Daur, Mongolian, Lahu, Dai, Hezhen, Miaozu, Naxi, Oroqen, She, Tu, Tujia, Naxi, Xibo, and Yakut), HapMap (Han Chinese and Japanese), as well as East Asian or East Asian-American subjects of Vietnamese, Korean, Filipino and Chinese ancestry. A clear understanding of the genetic substructure of any population helps in the studies of complex diseases, as well as the design and execution of association tests. Results of this study have identified markers that can not only reduce type 1 errors in future genetic disease studies, but also identify homogeneous groups and hence make this study more powerful.[citation needed]
The group of Chinese Americans in the same study consists of subjects with origins from North China, South China and Taiwan. This group is paired with Han Chinese from Beijing, and results indicate that the population differentiation values was small (<0.0025). There is substantially less genetic substructure between Han Chinese and Chinese American, compared with that between Han Chinese, Japanese and Korean groups, yet there is still a substructure in principal component, according to the split half reliability test.[citation needed]
Another study aiming to estimate cardiometabolic risk profile of Chinese adults with diabetes is also useful to reveal the personal genomics of Chinese Americans.[117] In this study, all subjects are over 18 years old and non-institutionalized. Results derived from a complex, multistage, probability sampling design show that 12,607 out of 98,658 Chinese adults are suffering from diabetes, based on the criteria of 2010 American Diabetes Association. In addition, the study reaches a conclusion that for those Chinese adults defined with diabetes, cardiometabolic risk factors are highly prevalent, including metabolic syndrome, systolic blood pressure that is higher than 140mmHg, low fruit and vegetable intake, low-density lipoprotein cholesterol that is higher than 110mg/dL.[citation needed]
Diabetes
The circumstance of the Asian American population is informative in a way that some knowledge about Chinese Americans can be inferred from it. The statistics of diabetes in Asian American population reveals that approximately 10% of the entire population are diabetic, and in which 90–95% are type 2 diabetes.[118] The current situation is that there are some challenges in diagnosing diabetes in many Asian Americans. The main obstacle is that many clinical features along with risks factors associated with diabetes are obtained from studies that focus on Caucasian populations, which might result in misdiagnoses between type 1 and type 2 diabetes for Asian Americans. In fact, the reason why classic features of type 1 and type 2 diabetes in America might not apply to Asian American population is about shared absence of common HLA DR-DQ genotype, low prevalence of positive anti-islet antibodies and low BMI in both types of diabetes.[119]
Some other studies have pointed out that for people of Asian descent and without diabetes, their insulin resistance levels are higher than non-diabetic people of Caucasian descent. Thus, Asian Americans are relatively more predisposed to develop type 2 diabetes. This suggests that insulin resistance, rather than body mass index (BMI) should be targeted while making diagnoses. A potential biomarker to identify diabetes in young Asian-American population is adipocyte fatty acid binding protein that has a strong association with insulin resistance but is independent of adiposity. Nevertheless, more research studies need to be carried out in order to confirm such finding. With further applying the above outcome on the population of Chinese Americans, it is plausible that there is a higher tendency for type 2 diabetes among this group of people, who also face the challenge of correct diagnosis in America.[citation needed]
Mental illness
Chinese American psychiatric patient, 1915
Genetic mental illness is stigmatized in China. A study compared the attitude of Chinese Americans towards mental illness with genetic causes and that of European American, finding that there is a perception of eugenics existing among Chinese Americans.[120]
Stigma and eugenics
The journal launched by the above study highlights the idea of genetic essentialism, namely, genes are largely deterministic of individual characteristics and behavior. There is a separation between the normal and the deviant, which drives the process of stigma labeling. On the other hand, since genetic diseases can be passed on from one generation to another, some mental illnesses are shared in a family, stigmatizing all members involved. Another viewpoint relevant to genetic essentialism is that, since genes are perceived by the common people as difficult to modify, genetic mental illness is likely to persist, and so is the stigma. As a result, the mindset of many Chinese Americans is that diseases with genetic causes are more serious than those without.[citation needed]
The same journal also delivers some hypotheses made on the basis of the long history of eugenics in China. First, Chinese Americans are more in favor of eugenic policies than European Americans. Secondly, more stigma would be generated towards genetic attributions of any diseases in Chinese American population. China used to implement restrictions on marriage licenses to people with genetic illnesses, which has made the attitude of Chinese Americans towards premarital genetic screening more supportive, especially when facing a chance of genetic defects. Moreover, from the perspective of this group of people, knowing whether a marriage partner has family history of mental illness with genetic basis is fairly important.[citation needed]
Chinese immigrants to the United States brought many of their ideas, values, and culture with them. Some of these have continued to influence later generations, such as the Confucianrespect for elders.[130] Similarly, education and the civil service were the most important path for upward social mobility in China.[130][131] The first Broadway show about Asian Americans Flower Drum Song premiered on Broadway in 1958;[132] the hit Chinglish premiered on Broadway in 2011.[133]
Early Chinese immigrants in America developed various strategies to preserve their cultural heritage while adapting to their new environment. Despite facing significant pressure to assimilate into mainstream American society, many maintained traditional practices through community organizations, cultural festivals, and language schools.[134]
Chinese American cuisine is a variety of Chinese cuisine.[139] Chinese American cuisine can be dated back to the gold rush, when Chinese immigrants cooked home-style dishes for themselves, but as cooks in mining camps and diners they prepared standard American fare. When laws and social pressure forced Chinese into Chinatowns, entrepreneurs opened Chinese restaurants that adapted South China country dishes for the tastes of white clientle. The birth of chop suey, a Chinese-American staple, was created around thia time. By the 1890s, it was seen as a culinary staple, with many new Chinese-American restaurants being known colloquially as "chop suey houses".[140] The La Choy Corporation started selling canned chop suey directly to American consumer in the 1920s, reflecting the Americanization and acceptance of the dish.[141]
In the 1940s and 1950s, Chinese food continued to increase in popularity. Other staples of Chinese American cuisine appeared, with beef and broccoli being invented in the 1920s by Californian Chinese Americans, and General Tso's chicken said to have been created by Peng Chang-kuei in Taiwan in the 1950s.
Panda Express was the first American fast food chain to serve Chinese American cuisine; it was created in 1983 and would encompass 2,400 stores thought the world.[142]
In the early twenty-first century, immigrants, especially of Fujian ancestry, opened Japanese-style restaurants. This was due to over-competition in the Chinese-style cuisine sector, and because the American public generally pays more money for Japanese-style cuisine.[143]
Sports
Buck Lai, Chinese-Hawaiian baseball player in 1914
Basketball became a significant sport among Chinese Americans in the 20th century.[144]
Charles Kuen Kao, physicist, winner of Nobel Prize in Physics in 2009 for the work on fiber optics, using laser to transmit digital data through glass fiber
Coco Lee, singer, songwriter and actress; first Asian American singer to perform at the Oscars; first Asian American singer to have an album released globally, with Just No Other Way
Tsung-Dao Lee, physicist, won the Nobel Prize in Physics (1957) with Yang Chen-Ning for their work on the violation of the parity law in weak interactions
Jeremy Shu-How Lin, professional basketball player, played in NBA for several years and a Harvard graduate
Gary Locke, politician and diplomat, the 10th United States ambassador to China (2011–2014), 21st Governor of Washington (1997–2005) and served in the Obama administration as United States Secretary of Commerce (2009–11)
Samuel Chao Chung Ting, physicist, one of the two winners of Nobel Prize in Physics in 1976 for the work on the discovery of J/ψ meson
Daniel Chee Tsui, physicist, one of the winners of Nobel Prize in Physics in 1998 for the work on the discovery of a new form of quantum fluid with fractionally charged excitations
John Tu, co-founder of Kingston Technologies, billionaire
Charles B. Wang, businessman, co-founder and CEO of Computer Associates International, Inc. (later renamed CA Technologies)
Chien-Shiung Wu, physicist who was called by scientists the "First Lady of physics" for her experimental discovery of parity violation in weak interaction proposed by Chen-Ning Yang and Tsung-Dao Lee, both of whom won Nobel Prize; made the crucial study that showed the problem with xenon in nuclear reactors for the Manhattan Project; her work was not publicly recognized except by top scientists until 1978, when she was given the Wolf Prize
Michelle Wu, first Asian-American mayor of Boston, born in the U.S.
Chinese Radio Seattle[146] (M-T 9:00pm–12:00am Fri-Sun 7:00pm-12:1m AM1150 KKNW/HD-3 FM 98.9/Mobile App: Chinese Radio Seattle), studio in Bellevue, Washington
Sinocast Radio, national Chinese network, heard in New York City on the 67 kHz subcarrier of WXRK-FM 92.3MHz.
WKDM, New York/New Jersey/Connecticut tri-state area is a Mandarin-dialect station on AM 1380kHz.
WZRC, New York/New Jersey/Connecticut tri-state area is a Cantonese-dialect station on AM 1480kHz.
Radio Taiwan International is broadcast on WYFR from Okeechobee, Florida on shortwave 5950kHz in the United States sometime after 5 p.m./6 p.m. until early morning. This broadcast can be received virtually through the entire United States using a shortwave radio.
123"Asian Americans: A Mosaic of Faiths". The Pew Forum on Religion & Public Life. Pew Research Center. July 19, 2012. Archived from the original on July 16, 2013. Retrieved February 15, 2013. Unaffiliated 52%, Protestant 22%, Buddhist 15%, Catholic 8%
↑Ng, Franklin (1998). The Taiwanese Americans. Greenwood Publishing Group. pp.2, 118, 126. ISBN978-0-313-29762-5.
↑Hsia, Lisa (2007). "Asians and Asian Americans in the West". In Mancall, Peter; Johnson, Benjamin Heber (eds.). Making of the American West: People and Perspectives. ABC-CLIO. pp.161–187.
↑Chang, Gordon H.; Obenzinger, Hilton; Hsu, Roland; Fishkin, Shelley Fisher, eds. (2019). "Introduction". The Chinese and the iron road: building the transcontinental railroad. Asian America. Stanford, California: Stanford University Press. pp.P10. ISBN978-1-5036-0925-9.
12Voss, Barbara L.; 色色拉沃斯 (2015). "The Historical Experience of Labor: Archaeological Contributions to Interdisciplinary Research on Chinese Railroad Workers / 劳工的历史经验: 考古学对于中 国铁路工人之跨学科研究的贡献". Historical Archaeology. 49 (1): P6. doi:10.1007/BF03376953. ISSN0440-9213. JSTOR43491356.
↑Chang, Gordon H.; Obenzinger, Hilton; Hsu, Roland; Fishkin, Shelley Fisher, eds. (2019). "Introduction". The Chinese and the iron road: building the transcontinental railroad. Asian America. Stanford, California: Stanford University Press. pp.P14. ISBN978-1-5036-0925-9.
↑Chang, Gordon H.; Fishkin, Shelley Fisher; Obenzinger, Hilton; Hsu, Roland, eds. (2019). "Chinese Railroad Workers and the US Transcontinental Railroad in Global Perspective". The Chinese and the iron road: building the transcontinental railroad. Asian America. Stanford, California: Stanford University Press. pp.P40. ISBN978-1-5036-0829-0.
↑Liu, Qing (May 2020). "To Be an Apolitical Political Scientist: A Chinese Immigrant Scholar and (Geo)politicized American Higher Education". History of Education Quarterly. 60 (2): 129–155. doi:10.1017/heq.2020.10. ISSN0018-2680.
↑US Census: Race and Hispanic or Latino: 2000Deprecated link archived 12 February 2020 at archive.today ; US Census: 1990Archived 11 August 2010 at the Wayback Machine ; US Census: Population 1790–1990Archived 2 October 2018 at the Wayback Machine ; Comparison of Asian Populations during the Exclusion YearsArchived 10 March 2007 at the Wayback Machine ; Estimation of the US-Census for the year 2004
↑Eileen Sullivan (November 24, 2023). "Growing Numbers of Chinese Migrants Are Crossing the Southern Border". The New York Times. Retrieved November 24, 2023. Most who have come to the United States in the past year were middle-class adults who have headed to New York after being released from custody. New York has been a prime destination for migrants from other nations as well, particularly Venezuelans, who rely on the city's resources, including its shelters. But few of the Chinese migrants are staying in the shelters. Instead, they are going where Chinese citizens have gone for generations: Flushing, Queens. Or to some, the Chinese Manhattan..."New York is a self-sufficient Chinese immigrants community," said the Rev. Mike Chan, the executive director of the Chinese Christian Herald Crusade, a faith-based group in the neighborhood.
↑Georg Hsu, L.K.; Wan, Yu Mui; Chang, Hong; Summergrad, Paul; Tsang, Bill Y.P.; Chen, Hongtu (September 2008). "Stigma of Depression Is More Severe in Chinese Americans than Caucasian Americans". Psychiatry: Interpersonal and Biological Processes. 71 (3): 210–218. doi:10.1521/psyc.2008.71.3.210. PMID18834272. S2CID23003033.
↑"Awards". Arthurhu.com. Archived from the original on December 25, 2011. Retrieved December 31, 2011.
↑Scott Jaschik (August 22, 2011). "Who Applies (and Gets in)". Inside Higher Ed. Archived from the original on April 25, 2012. Retrieved February 26, 2012. Then there is the question of who applies to competitive colleges: the NELS data show that 30 percent of Asian American applicants do, compared to 18 percent of white students and 10 percent of black and Latino students.
↑"Awards". Arthurhu.com. Retrieved December 31, 2011.
↑Scott Jaschik (August 22, 2011). "Who Applies (and Gets in)". Inside Higher Ed. Retrieved February 26, 2012. Then there is the question of who applies to competitive colleges: the NELS data show that 30 percent of Asian American applicants do, compared to 18 percent of white students and 10 percent of black and Latino students.
↑Bryan, Chiu; Cruz-Viesca, Melany Dela (2008). "Following the Path to Asian American Home-ownership"(PDF). Asian Real Estate Association of America (AREAA) Via American Community Survey: 9–11. Archived from the original(PDF) on October 17, 2012. Retrieved May 10, 2012.
12Haiming Liu (2005) "Asian-American Ideas (Cultural Migration)" In Horowitz, Maryanne Cline (editor) (2005) New Dictionary of the History of Ideas Charles Scribner's Sons, Detroit, Michigan, volume 1, pp. 158–160, ISBN0-684-31377-4
↑Hwang, directed by Leigh Silverman, David Henry. "Chinglish". Broadway's Best Shows, Longacre Theatre. Archived from the original on October 8, 2011. Retrieved May 5, 2013.
↑Lowe, Paula Madison, and Paula Williams Madison. Finding Samuel Lowe: China, Jamaica, Harlem. Amistad, 2015.
↑Ngu, Sarah (January 29, 2021). "'Not what it used to be': in New York, Flushing's Asian residents brace against gentrification". The Guardian US. Retrieved August 13, 2020. The three developers have stressed in public hearings that they are not outsiders to Flushing, which is 69% Asian. 'They've been here, they live here, they work here, they've invested here,' said Ross Moskowitz, an attorney for the developers at a different public hearing in February...Tangram Tower, a luxury mixed-use development built by F&T. Last year, prices for two-bedroom apartments started at $1.15m...The influx of transnational capital and rise of luxury developments in Flushing has displaced longtime immigrant residents and small business owners, as well as disrupted its cultural and culinary landscape. These changes follow the familiar script of gentrification, but with a change of actors: it is Chinese-American developers and wealthy Chinese immigrants who are gentrifying this working-class neighborhood, which is majority Chinese.
↑Eileen Sullivan (November 24, 2023). "Growing Numbers of Chinese Migrants Are Crossing the Southern Border". The New York Times. Retrieved November 24, 2023. Most who have come to the United States in the past year were middle-class adults who have headed to New York after being released from custody. New York has been a prime destination for migrants from other nations as well, particularly Venezuelans, who rely on the city's resources, including its shelters. But few of the Chinese migrants are staying in the shelters. Instead, they are going where Chinese citizens have gone for generations: Flushing, Queens. Or to some, the Chinese Manhattan..."New York is a self-sufficient Chinese immigrants community," said the Rev. Mike Chan, the executive director of the Chinese Christian Herald Crusade, a faith-based group in the neighborhood.
Brooks, Charlotte. American Exodus: Second-Generation Chinese Americans in China, 1901–1949 (University of California Press, 2019) online reviewArchived 14 December 2020 at the Wayback Machine .
Chang, Gordon H. Ghosts of Gold Mountain: The Epic Story of the Chinese Who Built the Transcontinental Railroad. Boston: Houghton Mifflin Harcourt, 2019. online
Chang, Iris. The Chinese in America: A Narrative History. New York: Viking, 2003. ISBN0-670-03123-2
Chen, Shehong. Being Chinese, Becoming Chinese American Urbana, IL: University of Illinois Press, 2002) ISBN0-252-02736-1online
Cheng, Cindy I-Fen. Citizens of Asian America: Democracy and Race during the Cold War (New York U. Press, 2013). 285p.
Hsu, Madeline Y.The Good Immigrants: How the Yellow Peril Became the Model Minority. Princeton, NJ: Princeton University Press, 2015.
Isaacs, Harold R. Scratches on Our Minds: American Images of China And India (1958) online
Kwong, Peter and Dusanka Miscevic. Chinese America: The Untold Story of America's Oldest New Community (2005)
Lee, Erika. The making of Asian America: A history (Simon and Schuster, 2015) online
Lee, Jonathan H. X. ed. Chinese Americans: The History and Culture of a People. Santa Monica, CA: ABC-CLIO, 2016. online
Ling, Huping, and Allan W. Austin, eds. Asian American History and Culture: An Encyclopedia (Routledge, 2015)
Louie, Vivian S. Compelled To Excel: Immigration, Education, And Opportunity Among Chinese Americans, (Stanford U. Press, 2004) 272 pages, ISBN0-8047-4985-X
McClain, Charles. In Search of Equality: The Chinese Struggle Against Discrimination in Nineteenth-Century America Berkeley: University of California Press, 1994.
Meng, Chih. Chinese American Understanding: A Sixty-Year Search, (China Institute in America, 1981, hardcover, 255 pages, OCLC: 8027928
Miscevic, Dusanka and Peter Kwong, eds. Chinese Americans: The Immigrant Experience, (Hugh Lauter Levin Associates, 2000), 240 pages, ISBN0-88363-128-8
See, Lisa. On Gold Mountain: The One-Hundred-Year Odyssey of My Chinese American Family, (1996). ISBN0-679-76852-1. See also the website for an exhibition based on this book HomeArchived 4 April 2005 at the Wayback Machine from the Smithsonian Asian Pacific American Program.
Song, Jingyi. Shaping and Reshaping Chinese American Identity: New York's Chinese during the Depression and World War II (2010)
Tung, May Pao-May. Chinese Americans and Their Immigrant Parents: Conflict, Identity, and Values, Haworth Press, 2000.
Wang, Ling-chi. "Chinese Americans." in Gale Encyclopedia of Multicultural America, edited by Thomas Riggs, (3rd ed., vol. 1, Gale, 2014), pp.491–506. onlineArchived 26 March 2021 at the Wayback Machine
Xu Guoqi. Chinese and Americans: A Shared History. Cambridge, MA: Harvard University Press, 2014.
Young, Elliott. Alien Nation: Chinese Migration in the Americas from the Coolie Era through World War II. Chapel Hill, NC: University of North Carolina Press, 2014.
↑Those are traditions and denominations that trace their history back to the Protestant Reformation or otherwise heavily borrow from the practices and beliefs of the Protestant Reformers.
123456This is more of a movement then an institutionalized denomination.
↑Denominations that don't fit in the subsets mentioned above.
↑Those are traditions and denominations that trace their origin back to the Great Awakenings and/or are joined together by a common belief that Christianity should be restored along the lines of what is known about the apostolic early church.
↑The Holiness movement is an interdenominational movement that spreads over multiple traditions (Methodist, Quakers, Anabaptist, Baptist, etc.). However, here are mentioned only those denominations that are part of Restorationism as well as the Holiness movement, but are not part of any other Protestant tradition.
This page is based on this Wikipedia article Text is available under the CC BY-SA 4.0 license; additional terms may apply. Images, videos and audio are available under their respective licenses.


 Shiing-Shen Chern, Wolf Prize winner, considered one of the greatest mathematicians of the 20th century
 Steven Chu, Nobel Prize winner in physics, 1997 and former United States Secretary of Energy
 Terence Tao, child prodigy, won Fields Medal, 2006
 Ching W. Tang, inventor of the organic light-emitting diode (OLED) and the hetero-junction organic photovoltaic cell (OPV); winner of the 2011 Wolf Prize in Chemistry
 Roger Y. Tsien, Nobel Prize winner in chemistry, 2009
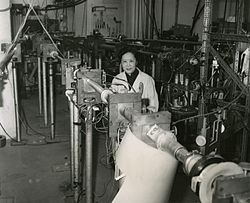
 Bruce Lee, famed actor, director and martial artist
 I. M. Pei, architect behind the pyramid of the Louvre, which is its main attraction; also designed the Rock and Roll Hall of Fame museum