In addition to being the nexus of the global entertainment industry, including films, television, and recorded music, Greater Los Angeles is also an important center of international trade, education, media, business, tourism, technology, and sports.[7] It is the third-largest metropolitan area by nominal GDP in the world with an economy exceeding $1 trillion in output, behind New York City and Tokyo.
There are three contiguous component urban areas in Greater Los Angeles: the Inland Empire, which can be broadly defined as Riverside and San Bernardino counties; the Ventura/Oxnard metropolitan area (Ventura County); and the Los Angeles metropolitan area (also known as Metropolitan Los Angeles or Metro LA) consisting of Los Angeles and Orange counties only. The Census Bureau designates the latter as the Los Angeles–Long Beach–Anaheim metropolitan statistical area (MSA), the fourth largest metropolitan area in the Western Hemisphere and the second-largest metropolitan area in the United States, by population of 13 million as of the 2020 U.S. census. It has a total area of 4,850 square miles (12,561km2). Although San Diego–Tijuana borders the Greater Los Angeles area at San Clemente and Temecula, it is not part of it as the two urban areas are not geographically contiguous due to the presence of Camp Pendleton. However, both form part of the Southern California megalopolis which extends into Tijuana, Baja California, Mexico.
Definitions
The Los Angeles–Long Beach, CA Combined Statistical Area as defined by the U.S. Office of Management and Budget.
The Los Angeles metropolitan area is defined by the U.S. Office of Management and Budget as the Los Angeles–Long Beach–Anaheim, CA Metropolitan Statistical Area (MSA),[9] with a 2021 population of 12,997,353.[10] The MSA is in turn made up of two "metropolitan divisions":
Los Angeles–Long Beach–Glendale, CA Metropolitan Division, coterminous with Los Angeles County (2023 population 9,663,345)
Anaheim–Santa Ana–Irvine, CA Metropolitan Division, coterminous with Orange County (2023 population 3,135,755)
The U.S. Census Bureau also defines a wider commercial region based on commuting patterns, the Los Angeles–Long Beach, CA Combined Statistical Area (CSA), more commonly known as the Greater Los Angeles Area, with an estimated population of 18,316,743 in 2023.[8] The total land area of the CSA is 33,955 sq. mi (87,945km2).
The CSA includes three component metropolitan areas:
The Los Angeles–Long Beach–Anaheim, CA MSA (2023 pop. 12,799,100), consisting of:
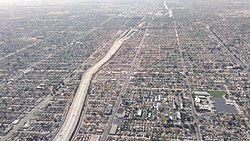
Many areas are completely filled with houses, buildings, roads, and freeways as observed in Vermont Vista, a Los Angeles neighborhood.
Los Angeles has long been famous for its sprawl, but this has to do more with its status in history as the "poster child" of large cities that grew up with suburban-style patterns of development, rather than how it ranks in sprawl among American metro areas today, now that suburban and exurban-style development is present across the country.[15] The Los Angeles–Orange County metro area was the most densely populated "urbanized area" (as defined by the United States Census Bureau) in the United States in 2000, with 7,068 inhabitants per square mile (2,729/km2).[16] For comparison, the "New York–Newark" Urbanized Area had a population density of 5,309 per square mile (2,050/km2).
Los Angeles' reputation for sprawl is due to the fact that the city grew from relative obscurity to one of the country's ten largest cities (i.e. 10th largest city in 1920), at a time when suburban patterns of growth first became possible due to electric streetcars and automobiles. The city was also the first large American city where, in the 1920s, major clusters of regional employment, shopping, and culture were already being built outside the traditional downtown areas – in edge cities such as Mid-Wilshire, Miracle Mile and Hollywood. This pattern of growth continued ever outward, more so when the freeway system was built starting in the 1950s; thus Greater Los Angeles was the earliest large American metropolitan area with a decentralized structure. Its major commercial, financial, and cultural institutions are geographically dispersed rather than being concentrated in a single downtown or central area. Also, the population density of Los Angeles proper is low (approximately 8,300 people per square mile) when compared to some other large American cities such as New York City (27,500), San Francisco (17,000), Boston (13,300), and Chicago (11,800).[17] Densities are particularly high within a 5-mile radius of downtown, where some neighborhoods exceed 20,000 people per square mile.[18] What gives the entire Los Angeles metro region a high density is the fact that many of the city's suburbs and satellite cities have high density rates.[19] Within its urbanized areas, Los Angeles is noted for having small lot sizes and low-rise buildings. Buildings in the area are low when compared to other large cities, mainly due to zoning regulations. Los Angeles became a major city just as the Pacific Electric Railway spread population to smaller cities much as interurbans did in East Coast cities. In the first decades of the twentieth century, the area was marked by a network of fairly dense but separate cities linked by rail. The ascendance of the automobile helped fill in the gaps between these commuter towns with lower-density settlements.[20]
Starting in the early twentieth century, there was a large growth in population on the western edges of the city moving to the San Fernando Valley and out into the Conejo Valley in eastern Ventura County. Many working-class whites migrated to this area during the 1960s and 1970s out of East and Central Los Angeles.[21] As a result, there was a large growth in population into the Conejo Valley and into Ventura County through the US 101 corridor. Making the US 101 a full freeway in the 1960s and expansions that followed helped make commuting to Los Angeles easier and opened the way for development westward. Development in Ventura County and along the US 101 corridor remains controversial, with open-space advocates battling those who feel business development is necessary to economic growth.[22] Although the area still has abundant amount of open space and land, almost all of it was put aside and mandated never to be developed as part of the master plan of each city. Because of this, the area which was once a relatively inexpensive area to buy real estate, saw rising real estate prices well into the 2000s.[23] Median home prices in the Conejo Valley for instance, ranged from $700,000 to $2.2 million in 2003.[24] According to Forbes, "it's nearly impossible" to find reasonably priced real estate in California, and the prices will continue to increase.[25]
The Los Angeles area continues to grow, principally on the periphery where new, cheaper, undeveloped areas are being sought.[26] As such, in these areas, populations as well as housing prices exploded, although the housing bubble popped late in the decade of the 2000s. Riverside and San Bernardino counties, which contain large swaths of desert, attracted most of the population increase between 2000 and 2006. Growth continues not only outside the existing urbanized area but also adjacent to existing development in the central areas.[27] As in virtually all US core cities, there is now vigorous residential development in the downtown area with both new buildings and renovation of former office buildings. The Los Angeles Downtown News keeps a list of ongoing development projects, updated every quarter.[28] Over the course of the 21st century, droughts and wildfires have increased in frequency and the region's water security has become a development issue.[29]
In fact, the Los Angeles area is considered a classic example of a metropolitan area that developed in such fashion.[30]
Furthermore, since the COVID-19 pandemic Downtown Los Angeles has experienced staggering commercial vacancy rates, urban blight, homelessness, drug use, and crime. Entire skyscrapers were reportedly sold for less than large estates in Bel Air.[31]
Employment is not only in the downtown area, but consistently occurs outside the central core. As such, many people commute throughout the city and suburbs in various directions for their work and daily activities, with a large portion heading to the municipalities that are outside the city of Los Angeles.[32]
Unlike most metropolitan areas, regional identity remains a contentious issue in the Greater Los Angeles area, with many residents not acknowledging any association with the region as a whole. For example, while Los Angeles County and Orange County together make up the smaller MSA region, the two host many sub-areas that each have sharp demographic, political, and financial distinctions. South Orange County residents often attempt to be identified apart from Los Angeles although they make up the same metropolitan area. Also, while only 1.63% of Los Angeles residents commute to Orange County for work, over 6% of Orange County commuters head to Los Angeles for work.[33] Western Riverside County and San Bernardino County have become commuter regions characteristic of other suburban counties throughout the nation. Residents in these counties often commute to Los Angeles County and Orange County for employment.[34]
Los Angeles County, of which the City of Los Angeles is the county seat, is the most populous county in the United States and is home to over a quarter of all California residents.[35] The large size of the city of Los Angeles, as well as its history of annexing smaller towns, has made city boundaries in the central area of Los Angeles County quite complicated.[36] Many cities are completely surrounded by the city of Los Angeles and are often included in the city's areas despite being independent municipalities. For example, Santa Monica and Beverly Hills (which is almost completely surrounded by Los Angeles) are considered part of the Westside, while Hawthorne and Inglewood are associated with South L.A. Adjacent areas that are outside the actual city boundaries of incorporated Los Angeles but border the city itself include the Santa Clarita Valley, the San Gabriel Valley, South Bay, and the Gateway Cities.
Despite the large footprint of the city of Los Angeles, a majority of the land area within Los Angeles County is unincorporated and under the primary jurisdiction of Los Angeles County. Much of this land, however, cannot be easily developed due to planning challenges presented by geographic features such as the Santa Monica Mountains, the San Gabriel Mountains, and the Mojave Desert. Actual land development in these regions occurs on the fringes of incorporated cities, some of which have been fully developed, such as the cities of Palmdale and Lancaster.
Subregions in Los Angeles County
While there is not an official designation for the regions that comprise Greater Los Angeles, one authority, the Los Angeles Times, divides the area into the following regions:[37]
Some of the above areas can be defined as being bounded by natural features such as mountains or the ocean; others are marked by city boundaries, freeways, or other constructed landmarks. For example, Downtown Los Angeles is the area of Los Angeles roughly enclosed by three freeways and one river: the Harbor Freeway (SR 110) to the west, the Santa Ana Freeway (US 101) to the north, the Los Angeles River to the east, and the Santa Monica Freeway (I-10) to the south.[38] Meanwhile, the San Fernando Valley ("The Valley") is defined as the basin consisting of the part of Los Angeles and its suburbs that lie north-northwest of downtown and is ringed by mountains.[39]
With a population of nearly 4.1 million people at the 2020 census, the City of Los Angeles is the second most populous city in the United States after New York City, and is the focal point of the Greater Los Angeles Area.[40] As an international center for finance, entertainment, media, culture, education, tourism, and science, Los Angeles is considered one of the world's most powerful and influential global cities.[41]
List of the 88 cities of Los Angeles County and six large CDPs by population at the 2020 U.S. census:
Orange County was originally an agricultural area dependent on citrus crops, avocados, and oil extraction, and became a bedroom community for Los Angeles when I–5, the Santa Ana Freeway, linked it to the city in the 1950s. The growth of Los Angeles initially fueled population growth in Orange County, but by the 1970s it had become an important economic center in its own right, with tourism and electronics industries, among others. Today, Orange County is known for its tourist attractions, such as Disneyland, Knott's Berry Farm, its several pristine beaches and coastline, and its wealthier areas, featured in television shows such as The O.C. None of the original downtowns serves as the central urban core for the county, but there are important clusters of business and culture in Downtown Santa Ana and in three edge cities: the Anaheim–Santa Ana edge city from Disneyland to the Orange Crush interchange (Orange, Santa Ana), the South Coast Plaza–John Wayne Airport edge city (Santa Ana, Costa Mesa, Irvine), and Irvine's Spectrum edge city.
Population of Los Angeles and Orange Counties since 1890
Orange County is sometimes figuratively divided into "North County" and "South County", with North Orange County including cities such as Anaheim, Fullerton, and Santa Ana, and is the older, more ethnically diverse and more densely built-up area both geographically and culturally closer to Los Angeles. South County, defined variously as beginning with either Costa Mesa[42] or Irvine[43] and includes cities to the east and south such as Laguna Beach, Mission Viejo, Newport Beach, and San Clemente, is more residential, affluent, recently developed, and has a mostly white population. Irvine is an exception, as it is a center of employment and is ethnically diverse. A growing alternative dividing marker between north and south is the El Toro Y interchange. Orange Coast or South Coast area is defined instead as consisting of some or all of the cities lining the coast.
The Inland Empire, consisting of San Bernardino and Riverside Counties, contains fast-growing suburbs of the region, with a large to majority percentage of the working population commuting to either Los Angeles or Orange counties for work. Originally an important center for citrus production, the region became an important industrial area by the early 20th century.[44][45][46] The Inland Empire also became a key transportation center following the completion of Route 66, and later I-10. With the post-World War II economic boom leading to rapid development in Los Angeles and Orange Counties, land developers bulldozed acres of agricultural land to build suburbs in order to accommodate the Los Angeles area's expanding population.[44] The development of a regional freeway system facilitated the expansion of suburbs and human migration linking the Inland Empire and rest of Greater Los Angeles. Despite being primarily suburban, the Inland Empire is also home to important warehousing, shipping, logistics and retail industries, centered on the subregion's major cities of Riverside, San Bernardino and Ontario.
While the Inland Empire is sometimes defined as the entirety of San Bernardino and Riverside counties, the eastern undeveloped, desert portions of these counties are not considered to be part of Greater Los Angeles. The state of California defines this area to include the cities of Adelanto, Apple Valley, and Victorville to the north, the Riverside–San Diego county line to the south, and the towns of Anza, Idyllwild, and Lucerne Valley, along with the San Bernardino National Forest to the east.[47]
Additionally, the southwest portion of Riverside County, centered on the city of Temecula is more economically linked to San Diego county, with its growth largely being driven by migrants from San Diego seeking more affordable housing similar to how northwestern Riverside county's growth was driven by migrants from Orange County and Los Angeles seeking more affordable housing.[48][49]
However, with clear northern and southern limits to expansion, the region's urban eastern boundaries have become increasingly nebulous as suburban sprawl continues to spread out to form a unified whole with Los Angeles, with further development encroaching past the San Bernardino and San Jacinto Mountains and into the outlying desert areas. As a result, the regional definition of Greater Los Angeles can now be extended to include Barstow and surrounding towns in the northeast, the Morongo Basin in the east-central including Yucca Valley and Twentynine Palms, and the Coachella Valley cities in the southeast. This interconnectivity, provided by one of the most extensive freeway systems in the world, as well as economic, social and media ties, has blended boundaries between these regions and the urbanized Los Angeles and Inland Empire areas.[50]
While the above areas are included in the regional definition of Greater Los Angeles, the U.S. Census Bureau defines Greater Los Angeles, or officially, the Los Angeles–Long Beach Combined Statistical Area, to include both the above-mentioned areas along with the entirety of San Bernardino and Riverside counties.[51] These areas are sparsely developed and are part of the Mojave and Colorado Deserts. To the north, I-15 crosses desolate desert landscape after passing Barstow, linking Greater Los Angeles with Las Vegas, with Baker being the only significant outpost along the route. To the east, lie the Mojave National Preserve and Joshua Tree National Park along with the towns of Needles and Blythe on the California-Arizona state line.
Ventura County is mostly suburban and rural and also has developed primarily through the growth of Los Angeles. Central and southern Ventura County formerly consisted of small towns along the Pacific Coast until the expansion of US 101 drew in commuters from the San Fernando Valley. Master-planned cities soon began developing, and the county became increasingly urbanized. The northern part of the county, however, remains largely undeveloped and is mostly within the Los Padres National Forest.
Urban areas within the Los Angeles combined statistical area as of the 2020 census. (Far eastern portions of Riverside and San Bernardino counties are cropped out).
Urban areas
Counties in the Los Angeles MSA
Counties in the Los Angeles CSA but not the MSA
At the core of the Los Angeles–Long Beach combined statistical area (CSA) lies the Los Angeles–Long Beach–Anaheim, CA urban area, the second most populous in the United States.[11] Within the boundaries of the CSA the Census Bureau defines 30 other urban areas as well, two of which (Riverside–San Bernardino and Oxnard–Ventura) form the core of their own metropolitan areas separate from the Los Angeles metropolitan statistical area. Urban areas situated primarily outside the Los Angeles metropolitan statistical area but within the CSA are identified with a cross (†) in the table below.
According to the 2020 census, there were 18,644,680 people living in the Greater Los Angeles Area.[citation needed] The racial makeup of the area was 29.4% White (23.0% Non-Hispanic European and 6.4% Non-Hispanic Middle Eastern), 13.8% Asian (Non-Hispanic), 0.2% Pacific Islander (Non-Hispanic), 6.1% African American (Non-Hispanic), 0.2% Native American (Non-Hispanic), 0.5% from other races (Non-Hispanic), and 3.3% from two or more races (Non-Hispanic). 46.3% of the population were Hispanic of any race, a super-majority of which was of Mexican origin.[53] 29.4% of the population (5.5 million) was foreign born; most immigrants came from Latin America and Asia.[54]
The explosive growth of the region in the 20th century can be attributed to its favorable Mediterranean climate, the availability of land and many booming industries such as oil, automobile and rubber, motion pictures, intermodal, logistics, and aerospace which in turn attracted millions of people from all over the United States and world.[citation needed] Citrus production was important to the region's development in the earlier part of the 20th century.[55]
Population density in the Los Angeles urban areaEthnic origins in LA CSA (5 counties)
While the New York metropolitan area is presently the most populous metropolitan area in the United States, it has been predicted in the past that Greater Los Angeles will eventually surpass Greater New York in population.[citation needed] Whether this will happen is yet to be seen, but past predictions on this event have been off the mark. A 1966 article in Time predicted Greater Los Angeles would surpass New York by 1975, and that by 1990, would reach close to the 19 million mark.[56] But the article's flawed definition of Greater Los Angeles included San Diego, which is actually its own metropolitan area. A 1989 article in The New York Times predicted Greater Los Angeles would surpass Greater New York by 2010,[57] but the article predicted the population would be 18.3 million in that year, a number Greater New York already surpassed in 2007 by half a million people. By 2009, the New York metropolitan area had a population of 22.2 million compared to the Greater Los Angeles Area's 18.7 million, about a 3.56 million persons difference.[58] Percentage growth, however, has been higher in Greater Los Angeles over the past few decades than in Greater New York.
According to the 2009 American Community Survey, the Los Angeles Metropolitan Area had a population of 12,874,797, of which 6,402,498 (49.7% of the population) were male and 6,472,299 (50.3% of the population) were female. The age composition is shown in the table at right.
Age distribution Los Angeles and Orange Counties, 2009
Age
% of pop.
Under 5
7.3%
5 to 9
6.6%
10 to 14
7.0%
15 to 19
7.2%
20 to 24
7.0%
25 to 34
15.5%
35 to 44
14.8%
45 to 54
13.9%
55 to 59
5.5%
60 to 64
4.4%
65 to 74
5.6%
75 to 84
3.6%
85 and over
1.6%
Median age
34.6
Median age: 34.6 years
Race
According to the 2020 census, there were 18,644,680 people living in the Greater Los Angeles Area. The racial makeup of the area was 29.4% White (23.0% Non-Hispanic European and 6.4% Non-Hispanic Middle Eastern), 13.8% Asian (Non-Hispanic), 0.2% Pacific Islander (Non-Hispanic), 6.1% African American (Non-Hispanic), 0.2% Native American (Non-Hispanic), 0.5% from other races (Non-Hispanic), and 3.3% from two or more races (Non-Hispanic). 46.3% of the population were Hispanic of any race, a super-majority of which was of Mexican origin.[53]
Ethnic origins in LA and Orange Counties
Non-Hispanic whites make up under one-third (29.4%) of the population, approximately 5,477,462 residents. The top European ancestries were German: 7.0% (1,301,202), English: 6.1% (1,131,426), Irish: 5.4% (1,002,233), Italian: 3.4% (624,585), Scandinavian: 2.2% (405,887), French: 1.5% (284,180), Scottish: 1.4% (264,429), Polish: 1.2% (224,443), and Russian: 1.0% (189,115). The top Middle Eastern ancestries were Jewish: 3.2% (600,000), Armenian: 1.2% (214.190), Arab: 0.98% (182,934), and Iranian: 0.75% (139,632). Additionally, 3.3% (611,193) of residents identified as simply American. Values may add to over 100% because people can identify with more than one ethnicity.
Approximately 2,577,706 residents are Asian of non-Hispanic origin. Asians of non-Hispanic origin make up 13.8% of the population, about 1.4% South Asian (Indian Subcontinent), and about 12.4% were East or Southeast Asian. The six largest Asian ancestries with respect to all of Greater LA's population were Chinese: ~ 6.1%, Filipino: ~ 3.1%, Vietnamese: ~ 2.0%, Korean ~ 1.9%, Indian ~ 1.1%, and Japanese ~ 0.8%. Other important Asian American groups include Cambodian, Laotian, Hmong, Taiwanese, Pakistani, and Thai Americans.
Non-Hispanic blacks make up 6.1% of the population. Approximately 1,143,781 residents are non-Hispanic blacks. Sub-Saharan Africans were 0.7% (137,443) and Non-Hispanic Caribbean Blacks were 0.3% (62,419).
Non-Hispanic Native Americans make up 0.2% of the population (46,143).
Non-Hispanic Native Hawaiians and other Pacific Islanders make up 0.2% of the population. Approximately 42,591 residents are Native Hawaiian or of other Pacific Islander ancestries. The largest Pacific Islander ancestries were Samoan, Native Hawaiian, and Guamanian or Chamorro, and Tongan
Non-Hispanic Multiracial people make up 3.3% of the population. Approximately 624,473 people are non-Hispanic multiracial.
People who listed "other" as their race made up 0.5% (102,434) of the population.
Source: data.census.gov. Retrieved on April 15, 2023.[60]
Hispanic or Latino origin
Hispanic or Latinos, who may be of any race, are by far the largest group; Hispanics or Latinos make up 46.3% of the population. They outnumber every other racial group. Approximately 8,630,090 residents are Hispanic or Latino. The largest Hispanic or Latino ancestry was by far Mexican, with other important groups being Salvadoran, Guatemalan, Honduran, Peruvian, Puerto Rican, Colombian, and Cuban.
Greater Los Angeles is a politically divided metropolitan area. During the 1970s and 1980s, the region leaned toward the Republican Party. Los Angeles County, the most populous of the region, is a Democratic stronghold, although it voted twice for both Richard Nixon (1968 and 1972) and Ronald Reagan (1980 and 1984). Riverside County, San Bernardino County, and Orange County have historically leaned toward the Republican Party but have started shifting leftward in recent years. Ventura County is politically divided.
Los Angeles and Orange Counties together have an economy of roughly $1.227 trillion.[3] Important are coastal California land values and the rents they command, which contribute heavily to GDP earnings, though there are worries that these high land values contribute to the long-term problem of housing affordability and are thus a possible risk to future GDP increase.[61][62] This is evident when comparing the coast with the Inland Empire, a large component of the five-county combined statistical area (CSA) that nevertheless contributes a far smaller portion to regional gross metropolitan product but still dominates in industry. The Greater Los Angeles CSA is the third-largest economic center in the world, after Greater Tokyo and the New York-Newark-Bridgeport CSA.
Greater Los Angeles is a hotspot for Asian car manufacturers. Specifically, Mitsubishi, Hyundai, Honda, and Mazda have their U.S. headquarters in the area.[63]Nissan and Toyota were headquartered in the area in the recent past as well. (Nissan moved to Tennessee; Toyota moved to Texas.)[64]
This section needs to be updated. Please help update this article to reflect recent events or newly available information.(June 2015)
The economy of the Los Angeles metropolitan area is famously and heavily based on the entertainment industry, with a particular focus on television, motion pictures, interactive games, and recorded music – the Hollywood district of Los Angeles and its surrounding areas are known as the "movie capital of the United States" due to the region's extreme commercial and historical importance to the American motion picture industry. Other significant sectors include shipping/international trade – particularly at the adjacent Port of Los Angeles and Port of Long Beach, together comprising the United States' busiest seaport – logistics – the Inland Empire being the largest concentration of warehousing and intermodal facilities in the world – as well as aerospace, technology, petroleum, fashion and apparel, and tourism.
The Port of Los Angeles and Port of Long Beach together comprise the fifth-busiest port in the world, being the center of imports and exports for trade on the west Pacific Coast as well as being one of the most significant ports of the western hemisphere. The Port of Los Angeles occupies 7,500 acres (3,035 hectares) of land and water along 43 miles (69 kilometres) of waterfront and is the busiest container port in the United States. The Port is the busiest port in the United States by container volume, the 8th busiest container port in the world.[67][68][69] The top trading partners in 2004 were: China ($68.8billion), Japan ($24.1billion), Taiwan ($10.8billion), Thailand ($6.7billion), & South Korea ($5.6billion)
The Port of Long Beach is the second-busiest container port in the United States. It adjoins the separate Port of Los Angeles. Acting as a major gateway for U.S.-Asian trade, the port occupies 3,200 acres (1,295 hectares) of land with 25 miles (40 kilometres) of waterfront in the city of Long Beach, California. The seaport has approximately $100billion in trade and provides more than 316,000 jobs in Southern California. The Port of Long Beach imports and exports more than $100billion worth of goods every year. The seaport provides the country with jobs, generates tax revenue, and supports retail and manufacturing businesses.[citation needed]
Economic statistics for Los Angeles and Orange Counties
In 2014, the population of the Long Beach–Los Angeles–Anaheim metropolitan statistical area (MSA) reached 13,262,220 and ranked second in the United States – a 1 percent increase from 2013.[70] In 2014, Los Angeles–Long Beach–Anaheim had a per capita personal income (PCPI) of $50,751 and ranked 29th in the country.
In 2014, Los Angeles–Long Beach–Anaheim placed third among the largest exporters in the United States (shipment totaling to $75.5 billion). The metro accounted for 40.8 percent of California's merchandise exports, mainly exporting computer and electronic products ($18.6 billion); transportation equipment ($15.3 billion) and chemicals ($5.6 billion). Nonetheless, the greater Los Angeles metro has immensely benefited from the free trade agreements: greater Los Angeles exported $25.1 billion to the NAFTA region and $776 million in goods to the CAFTA region.
Overall, in 2014 the average wages and salaries reached $57,519 (in 2010, the average wages and salaries reached $54,729).[71] Meanwhile, the median household income in 2014 was $56,935, a 1.4 percent increase from 2013 (average median household income was $56,164).[72]
Utilities and infrastructure
There are nine electric utility power companies in the Los Angeles metropolitan area. Southern California Edison serves a large majority of the Los Angeles metropolitan area except for Los Angeles city limits, Burbank, Glendale, Pasadena, Azusa, Vernon, Anaheim, and southern Orange County. Southern Orange County is part of the Los Angeles metropolitan area and it is served by San Diego Gas & Electric. There are three natural gas providers in the metropolitan area. Southern California Gas Company serves a large majority of the Los Angeles metropolitan area except for Long Beach and southern Orange County.
Medical facilities
Greater Los Angeles is one of the world's largest patient destinations. The Los Angeles Medical Services provide quality medical services and specialty care services to the populations served in compliance with local, state and federal regulations as well as human rights protection.[73]Archived February 12, 2018, at the Wayback Machine
Los Angeles and Orange counties have separate medical service department but both work jointly. Government and Private hospitals open normally Monday through Friday, excluding City Holidays but some speciality hospitals are open year-round.[73]Archived February 12, 2018, at the Wayback Machine
The main healthcare providers in the Los Angeles metropolitan area are Kaiser Permanente, Cedars-Sinai Health System, UCLA Health, Dignity Healthcare, and Providence Healthcare. LA Care and Care1st are also the main providers for those in the metropolitan area that have Medi-Cal.
Greater Los Angeles is one of the most visited areas in the world. It is known for its temperate weather, its popular beaches and amusements, its cultural centers and its natural beauty. In the year 1999, a total of 23.8million visitors stayed for at least one night.[75]
Area and ZIP codes
This section is missing information about San Bernardino, Riverside and Ventura counties. Please expand the section to include this information. Further details may exist on the talk page.(November 2020)
This section is missing information about San Bernardino, Riverside and Ventura counties. Please expand the section to include this information. Further details may exist on the talk page.(November 2020)
The system shared dual gauge track with the 3ft6in (1,067mm)narrow gaugeLos Angeles Railway, "Yellow Car", or "LARy" system on Main Street in downtown Los Angeles (directly in front of the 6th and Main terminal), on 4th Street, and along Hawthorne Boulevard south of downtown Los Angeles toward the cities of Hawthorne, Gardena, and Torrance.
The primary airport serving the LA metro area is Los Angeles International Airport (LAX), one of the busiest airports in the United States. LAX is in southwestern Los Angeles, 16 miles (26km) from Downtown Los Angeles. LAX is the only airport to serve as a hub for all three U.S. legacy airlines —American, Delta and United.
The system's light rail lines are the second busiest LRT system in the United States, after Boston, by number of riders, with 200,300 average weekday boardings during the third quarter of 2012.[80] By 2019, it had become the most heavily ridden light rail system in the country.[81]
Since the region of the city is in close proximity to a major fault area the tunnels were built to resist earthquakes of up to magnitude 7.5. Both subway lines use an electrified third rail to provide power to the trains, rendering these lines unusable on the other three. The Blue and Gold Lines run mostly at grade, with some street-running, elevated, and underground stretches in the more densely populated areas of Los Angeles. The Green Line is entirely grade separated, running in the median of I-105 and then turning southward along an elevated route.
Metrolink provides service to numerous places within Southern California, including all counties in the region. Metrolink operates to 67 stations on eight lines within Southern California which mostly (except for the Inland Empire–Orange County Line and Arrow) radiate from Los Angeles Union Station.
This section is missing information about San Bernardino, Riverside and Ventura counties. Please expand the section to include this information. Further details may exist on the talk page.(November 2020)
As a whole, the Los Angeles area has more national championships, all sports combined (college and professional), than any other city in the United States, with over four times as many championships as the entire state of Texas, and just over twice that of New York City.[84] It is the only American city to host the summer Olympic games twice: once in 1932, and more recently in 1984 (Lake Placid hosted the winter Olympic games twice: once in 1932 and once in 1980). Los Angeles will also be the host of the 2028 Summer Olympics, becoming the third city to host three Olympic Games, after London and Paris.
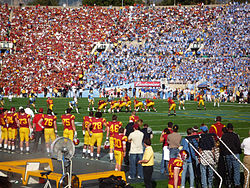
UCLA–USC rivalry; both are located in LA and members of the Pac-12 Conference, and moved together to the Big Ten Conference in 2024. The rivalry is unusual in the National Collegiate Athletic Association (NCAA) Division I sports, because the campuses are only 12 miles (19 km) apart, and located within the same megacity.
↑"On Tovaangar | PRIME". On Tovaangar | PRIME. Retrieved January 6, 2023. Tovaangar, which encompasses all of Gabrielino-Tongva territory, covers the Los Angeles Basin, half of Orange County, parts of Riverside County and San Bernardino County...
↑American Factfinder, United States Census Bureau, Table: "GCT-PH1-R. Population, Housing Units, Area, and Density (geographies ranked by total population): 2000" from Data Set: "Census 2000 Summary File 1 (SF 1) 100-Percent Data", accessed October 10, 2007 at: Archived February 19, 2008, at the Wayback Machine See also: List of United States urban areas
↑Haughton, Graham, and Colin Hunter, Sustainable Cities, London: Routledge, 2003: 81.
↑Bruegmann, Robert. Sprawl: A Compact History. University of Chicago Press, Chicago 2005: 65.
↑Abu-Lughod, Janet L. (1999). New York, Chicago, Los Angeles: America's Global Cities. Minneapolis: University of Minnesota Press. ISBN978-0-8166-3336-4.
↑Gutierrez, David. The Columbia History of Latinos in the United States. New York: Columbia University Press, 2003: 94.
↑Curtiss, Aaron. "Bitter Land-Use Fights Seen For 101 Corridor Development." Los Angeles Times November 20, 1993: B1.
↑Olsen, Andy. "Local Home Prices Soar in May." Los Angeles Times June 23, 2003: B3.
↑Griggs, Gregory. "Local Homes Get Even Pricier." Los Angeles Times August 21, 2003: B1.
↑Wolch, Jennifer R.; Manuel Pastor; Peter Dreier (2004). Up Against the Sprawl: Public Policy and the Making of Southern California. Minneapolis: University of Minnesota Press. ISBN978-0-8166-4298-4.
↑"Magnet in the West". Time. September 2, 1966. Archived from the original on December 4, 2008. Retrieved April 24, 2008. Greater Los Angeles is already the second-most-populous metropolis in the U.S., is almost sure to surpass New York by 1975. Last week alone, some 5,000 people moved into the area. By 1990, such growth will make the city the hub of an uninterrupted urbanized stretch of almost 19 million inhabitants occupying the 175-mile-long, coastal area that runs from Santa Barbara in the north to San Diego in the south.
↑Reinhold, Robert (August 28, 1989). "No Headline". The New York Times. Retrieved April 24, 2008. [A]nd the region's population will surpass New York's, reaching 18.3 million in 2010
This page is based on this Wikipedia article Text is available under the CC BY-SA 4.0 license; additional terms may apply. Images, videos and audio are available under their respective licenses.