Lake County, California

Last updated

Lake County, California
County of Lake
ClearLakeCA.jpg
Clear Lake, the dominant geographic feature in Lake County
Seal of Lake County, California.png
Lake County, California
Interactive map of Lake County
Map of California highlighting Lake County.svg
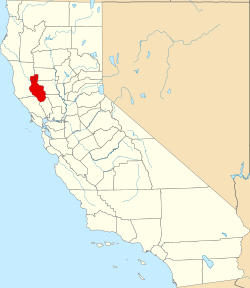
Location in the state of California
CountryUnited States
State California
Incorporated May 20, 1861 [1]
Named for Clear Lake
County seat Lakeport
Largest city Clearlake
Government
  Type Council–CAO
  BodyBoard of Supervisors
  ChairJessica Pyska
  Vice ChairMoke Simon
  Board of Supervisors [2]
Supervisors
  • Moke Simon
  • Bruno Sabatier
  • Eddie "EJ" Crandell
  • Michael S. Green
  • Jessica Pyska
  County Administrative OfficerSusan R Parker
Area
  Total1,329 sq mi (3,440 km2)
  Land1,256 sq mi (3,250 km2)
  Water73 sq mi (190 km2)
Highest elevation
[3]
7,059 ft (2,152 m)
Population
  Total68,163
  Density54/sq mi (21/km2)
Time zone UTC−8 (Pacific Standard Time)
  Summer (DST) UTC−7 (Pacific Daylight Time)
Area code 707
FIPS code06-033
GNIS feature ID 277281
Congressional district 4th
Website https://www.lakecountyca.gov/

Lake County is a county located in the north central portion of the U.S. state of California. As of the 2020 census, the population was 68,163. [4] The county seat is Lakeport. [5] The county takes its name from Clear Lake, the dominant geographic feature in the county and the largest non-extinct natural lake wholly within California. [6] (Lake Tahoe is partially in Nevada; the Salton Sea was formed by flooding; Tulare Lake was drained by the agricultural industry.)

Contents

Lake County forms the Clearlake, California micropolitan statistical area. [7] It is directly north of the San Francisco Bay Area.

Lake County is part of California's Wine Country, which also includes Napa, Sonoma, and Mendocino counties. It includes five American Viticultural Areas and over 35 wineries.

History

Lake County has been inhabited by Pomo Native Americans for over ten thousand years. Pomos had been fishermen and hunters, known especially for their intricate basketry made from lakeshore tules and other native plants and feathers. Pomo people continue to live in Lake County. [8]

The area had European-American settlers from at least the 1840s. Lake County was created in 1861 from parts of Napa and Mendocino counties. [9] The eastern boundary of Lake County, which was not clearly specified in the 1861 act, was clarified by legislative acts passed in 1864 and 1868. [10] A major effect of the 1868 act was to include in Lake County the entire watershed of North Fork Cache Creek, which had previously been claimed by Colusa County. [11]

The 1911 California Blue Book lists the major crops as Bartlett pears and beans. Other crops include grain, alfalfa, hay, prunes, peaches, apples, grapes and walnuts. Stockraising included goats, hogs, turkeys and dairying. [12]

Some vineyards were planted in the 1870s by European Americans but the first in the state were established in the 18th century by Spanish missionaries. By the early 20th century, the area was earning a reputation for producing some of the world's greatest wines. However, in 1920, national prohibition essentially ended Lake County's wine production. With authorized cultivation limited to sacramental purposes, most of the vineyards were ripped out and replanted with walnut and pear orchards.

Wine Country

Lake County vineyards SPRING IN THE VINEYARDS.JPG
Lake County vineyards

A reemergence of Lake County's wine industry began in the 1960s when a few growers rediscovered the area's grape-growing potential and began planting vineyards. Several Lake County American Viticultural Areas, such as High Valley AVA and Red Hills Lake County AVA, have been recognized as having distinct character.

The area has increased vineyard acreage from fewer than 100 acres in 1965 to more than 9,455 acres of vineyard in 2015 (a 7.6 percent increase over 2014). [13] Lake County's grape prices, at $1,634 per ton overall, also reached an all-time high in 2015. [13] In 2014, Lake County surpassed Mendocino County in price paid per ton of grapes in the North Coast premium market. [14]

The number of wineries also continues to grow, with over 35 wineries now located in Lake County. [15]

Air quality

Lake County has been ranked by the American Lung Association as having the cleanest air in the nation, including in 2013, 2014 and 2015. [16] Lake County has also been ranked 24 times as having the cleanest air in California. [16] Currently, the American Lung Association's website gives Lake County air a "C" grade for high ozone days and an "A" grade for particle pollution. [17]

Geography

According to the U.S. Census Bureau, the county has a total area of 1,329 square miles (3,440 km2), of which 1,256 square miles (3,250 km2) is land and 73 square miles (190 km2) (5.5%) is water. [18] Two main watercourses drain the county: Cache Creek, which is the outlet of Clear Lake; and Putah Creek. Both of these flow to the Sacramento River. The main streams which flow into Clear Lake are Forbes Creek, Scotts Creek, Middle Creek, and Kelsey Creek. At the extreme north of the county Lake Pillsbury and the Van Arsdale Reservoir dam the Eel River, providing water and power to Ukiah in Mendocino County.

Clear Lake is believed to be the oldest warmwater lake in North America, due to a geological fluke. The lake sits on a huge block of stone which slowly tilts in the northern direction at the same rate as the lake fills in with sediment, thus keeping the water at roughly the same depth. The geology of the county is chaotic, being based on Franciscan Assemblage hills. Numerous small faults are present in the south end of the lake as well as many old volcanoes, the largest being Cobb Mountain. The geologic history of the county shows events of great violence, such as the eruption of Mount Konocti and Mount St. Helena and the collapse of Cow Mountain, which created the hills around the county seat of Lakeport. Blue Lakes, Lake Pillsbury, and Indian Valley Reservoir are the county's other major bodies of water.

Lake County has habitats for a variety of species of concern including the uncommon herb, Legenere limosa , the rare Eryngium constancei, and the tule elk. Waterfowl, bear, and other wildlife abound in the Clear Lake basin.

Due to its surrounding hilly terrain, Lake is the only one of California's 58 counties never to have been served by a railroad line.

Adjacent counties

National protected areas

In 2015 President Barack Obama created the Berryessa Snow Mountain National Monument, incorporating these and other areas.

State protected areas

Mineral springs

In the late 19th century, the worldwide popularity of mineral water for the relief of myriad physical ailments resulted in the development of mineral resorts around Clear Lake. [19]

Climate

Lake County has a mediterranean climate with hot summer daytime temperatures in its lower elevations. Nighttime temperatures remain cool year-round, somewhat moderating average temperatures and relieving the summer heat.

Climate data for Clearlake, California (1981–2010 normals)
MonthJanFebMarAprMayJunJulAugSepOctNovDecYear
Record high °F (°C)76
(24)
81
(27)
84
(29)
94
(34)
101
(38)
114
(46)
113
(45)
112
(44)
111
(44)
104
(40)
92
(33)
78
(26)
114
(46)
Mean daily maximum °F (°C)55
(13)
58
(14)
62
(17)
67
(19)
75
(24)
84
(29)
92
(33)
90
(32)
85
(29)
75
(24)
62
(17)
55
(13)
72
(22)
Mean daily minimum °F (°C)32
(0)
34
(1)
36
(2)
39
(4)
45
(7)
51
(11)
55
(13)
53
(12)
49
(9)
42
(6)
35
(2)
32
(0)
42
(6)
Record low °F (°C)8
(−13)
16
(−9)
17
(−8)
23
(−5)
28
(−2)
34
(1)
39
(4)
40
(4)
30
(−1)
21
(−6)
19
(−7)
6
(−14)
6
(−14)
Average precipitation inches (mm)6.45
(164)
5.91
(150)
4.53
(115)
1.73
(44)
1.13
(29)
.22
(5.6)
.02
(0.51)
.10
(2.5)
.43
(11)
1.44
(37)
3.51
(89)
5.95
(151)
31.42
(798.61)
Source: [23]

Demographics

Historical population
CensusPop.Note
1870 2,969
1880 6,596122.2%
1890 7,1017.7%
1900 6,017−15.3%
1910 5,526−8.2%
1920 5,402−2.2%
1930 7,16632.7%
1940 8,06912.6%
1950 11,48142.3%
1960 13,78620.1%
1970 19,54841.8%
1980 36,36686.0%
1990 50,63139.2%
2000 58,30915.2%
2010 64,66510.9%
2020 68,1635.4%
2023 (est.)67,878 [24] −0.4%
U.S. Decennial Census [25]
1790–1960 [26] 1900–1990 [27]
1990–2000 [28] 2010 [29] 2020 [30]

2020 census

Lake County, California - Demographic Profile
(NH = Non-Hispanic)
Race / EthnicityPop 2010 [29] Pop 2020 [30] % 2010% 2020
White alone (NH)47,93844,20274.13%64.85%
Black or African American alone (NH)1,1861,1581.83%1.70%
Native American or Alaska Native alone (NH)1,5301,7372.37%2.55%
Asian alone (NH)6959401.07%1.38%
Pacific Islander alone (NH)97890.15%0.13%
Some Other Race alone (NH)1073860.17%0.57%
Mixed Race/Multi-Racial (NH)2,0244,2093.13%6.17%
Hispanic or Latino (any race)11,08815,44217.15%22.65%
Total64,66568,163100.00%100.00%

Note: the US Census treats Hispanic/Latino as an ethnic category. This table excludes Latinos from the racial categories and assigns them to a separate category. Hispanics/Latinos can be of any race.

2011

Places by population, race, and income

2010 Census

The 2010 United States Census reported that Lake County had a population of 64,665. The racial makeup of Lake County was 52,033 (80.5%) White, 1,232 (1.9%) African American, 2,049 (3.2%) Native American, 724 (1.1%) Asian, 108 (0.2%) Pacific Islander, 5,455 (8.4%) from other races, and 3,064 (4.7%) from two or more races. Hispanic or Latino of any race were 11,088 persons (17.1%). [38]

2005

There were a total of 34,031 homes in Lake County in 2005. This county has gone through a growth in housing units, adding a sum of 1,414 residential structures since 2001, a change of 4.3 percent. Lake County ranks 978 of 3,141, compared to change in residential structure growth in counties throughout the Unities States.

Lake County had a median home value in the year 2005 of $255,300, according to the American Community Survey. This median is less than the overall California 2005 home median value of $477,700 and greater than median home value of $167,500 for the rest of the nation in that year. In 2005, the American Community Survey reported that 14.4% of Lake County's owner-occupied dwellings are valued over a half a million dollars.

In the county, the population was spread out, with 24.1% under the age of 18, 6.0% from 18 to 24, 23.6% from 25 to 44, 26.8% from 45 to 64, and 19.5% who were 65 years of age or older. The median age was 43 years. For every 100 females there were 97.6 males. For every 100 females age 18 and over, there were 94.7 males.

The median income for a household in the county was $49,627, and the median income for a family was $55,818. Males had a median income of $45,771 versus $44,026 for females. The per capita income for the county was $43,825. About 6.9% of families and 4.6% of the population were below the poverty line, including 22.8% of those under age 18 and 7.3% of those age 65 or over. (Source: U.S. Census Bureau)

Within Lake County are two incorporated cities, the county seat of Lakeport and Clearlake, the largest city, and the communities of Kelseyville, Blue Lakes, Clearlake Oaks, Clearlake Park, Cobb, Finley, Glenhaven, Hidden Valley Lake, Clearlake Riviera, Loch Lomond, Lower Lake, Lucerne, Middletown, Nice, Spring Valley, Upper Lake, Whispering Pines, and Witter Springs.

Lake County is mostly agricultural, with tourist facilities and some light industry. Major crops include pears, walnuts and, increasingly, wine grapes.

2000

According to official estimates based on the 2000 Census, 30% of housing units in Lake County were manufactured housing units. [39] This was the highest percentage of any California county. [40]

Politics

Voter registration

Cities by population and voter registration

Overview

In its early history, Lake County leaned Democratic in Presidential and congressional elections. It supported every Democratic presidential candidate between 1864 and 1916 except Alton B. Parker in his 1904 landslide defeat. [42] Nonetheless, between 1920 and 1984 Lake County tended towards being Republican and was won by just four Democratic nominees – Franklin D. Roosevelt in 1932 and 1936, Lyndon B. Johnson in 1964 and Jimmy Carter in 1976. Ronald Reagan in 1984 remains the last Republican to win a majority in the county, which has reverted to leaning Democratic. [42]

United States presidential election results for Lake County, California [43]
Year Republican Democratic Third party
No.%No.%No.%
2020 13,12345.27%14,94151.55%9223.18%
2016 10,60342.95%11,50046.59%2,58110.46%
2012 9,20039.33%13,16356.27%1,0284.39%
2008 9,93538.76%14,85457.96%8403.28%
2004 11,09344.88%13,14153.16%4851.96%
2000 8,69941.58%10,71751.23%1,5037.18%
1996 7,45834.96%10,43248.90%3,44516.15%
1992 6,67828.77%10,54845.44%5,98725.79%
1988 9,36648.03%9,82850.39%3081.58%
1984 10,87454.83%8,64843.61%3091.56%
1980 8,93453.64%5,97835.90%1,74210.46%
1976 5,46244.46%6,37451.88%4493.65%
1972 6,47755.12%4,71540.13%5584.75%
1968 4,46449.00%3,77741.46%8709.55%
1964 3,61643.56%4,68056.37%60.07%
1960 4,17658.74%2,89740.75%360.51%
1956 4,07364.84%2,18534.78%240.38%
1952 4,36767.52%2,03831.51%630.97%
1948 3,05457.27%1,99937.48%2805.25%
1944 2,05954.97%1,67144.61%160.43%
1940 2,21553.36%1,89745.70%390.94%
1936 1,79748.74%1,83749.82%531.44%
1932 1,30134.75%2,34462.61%992.64%
1928 1,82065.37%92633.26%381.36%
1924 79544.94%26114.75%71340.31%
1920 99357.23%57132.91%1719.86%
1916 79135.42%1,16452.13%27812.45%
1912 00.00%1,11851.86%1,03848.14%
1908 62542.84%62843.04%20614.12%
1904 64145.40%59442.07%17712.54%
1900 58441.45%74652.95%795.61%
1896 54638.00%85459.43%372.57%
1892 53237.15%64444.97%25617.88%

Lake County is in California's 4th congressional district, represented by Mike Thompson ( D St. Helena ). [44]

In the state legislature, Lake is part of the 4th Assembly district and the 2nd Senate district.

On November 4, 2008, Lake County voted 52.6% for Proposition 8, which amended the California Constitution to ban same-sex marriages. [45]

Crime

The following table includes the number of incidents reported and the rate per 1,000 persons for each type of offense.

Cities by population and crime rates

Economy

The main crops in 2011, 2014 and 2015 (in thousands of dollars) are: [48] [49] [50]

2011 RankCrop201120142015
1Grapes, Wine38,45047,88058,867
2Pears, Bartlett14,88922,84819,575
3Nursery Products, Misc.3,5331,443942
4Walnuts, English2,3816,5346,732
5Cattle & Calves, Unspecified1,8952,1742,176
6Pears, Asian1,558----
7Field Crops, Unspecified1,1361,3971,810
8Pasture, Range405405720
9Pears, Unspecified4001,2801,161
10Vegetables, Unspecified193344286

Transportation

Major highways

There are also several numbered county routes in Lake County.

Public transportation

Lake Transit serves all areas around Clear Lake. Local routes serve Lakeport, Clearlake and Lower Lake. Connections are also provided to St. Helena (in Napa County) and Ukiah (in Mendocino County). Some routes operate on weekdays only; no service is provided on Sundays and observed public holidays. [51] [52]

Airports

Lampson Field is the county's public airport. There are also several private airstrips located throughout the county.

Historical railroads

In 1888 the Vaca Valley and Clear Lake Railroad reached Rumsey, but the planned line to Clear Lake was never built. The Clear Lake Railroad started work on a line from Hopland to Lakeport: "In November 1911 first ground was broken for the Hopland-Clear Lake railroad to Hopland. Mrs Harriet Lee Hammond, wife of the president of the road started construction. ... There were six miles of track out of Hopland ...", but this was also abandoned. [53] [54] [55]

Communities

Topological map of central Lake County Lake county usgs national map.png
Topological map of central Lake County

Cities

Census-designated places

Unincorporated communities

Population ranking

The population ranking of the following table is based on the 2010 census of Lake County. [56]

county seat

RankCity/Town/etc.Municipal typePopulation (2010 Census)
1 Clearlake City15,250
2 Hidden Valley Lake CDP5,579
3 Lakeport City4,753
4 Kelseyville CDP3,353
5 North Lakeport CDP3,314
6 Clearlake Riviera CDP3,090
7 Lucerne CDP3,067
8 Nice CDP2,731
9 Clearlake Oaks CDP2,359
10 Cobb CDP1,778
11 Middletown CDP1,323
12 Lower Lake CDP1,294
13 Upper Lake CDP1,052
14 Soda Bay CDP1,016
15 Spring Valley CDP845
16 Robinson Rancheria (Pomo Indians) [57] AIAN 207
17 Big Valley Rancheria (Pomo Indians) [58] AIAN139
18 Upper Lake Rancheria (Pomo Indians) [59] AIAN87
19 Sulphur Bank Rancheria (Pomo Indians) [60] AIAN61
20 Middletown Rancheria (Pomo Indians) [61] AIAN56

Notable people

See also

Notes

  1. Other = Some other race + Two or more races
  2. Native American = Native Hawaiian or other Pacific Islander + American Indian or Alaska Native
  3. 1 2 Percentage of registered voters with respect to total population. Percentages of party members with respect to registered voters follow.
  4. Only larceny-theft cases involving property over $400 in value are reported as property crimes.

Related Research Articles

<span class="mw-page-title-main">Yolo County, California</span> County in California, United States

Yolo County, officially the County of Yolo, is a county located in the northern portion of the U.S. state of California. Yolo County was one of the original counties of California, created in 1850 at the time of statehood. As of the 2020 census, the population was 216,403. Its county seat is Woodland.

<span class="mw-page-title-main">Amador County, California</span> County in California, United States

Amador County is a county located in the U.S. state of California, in the Sierra Nevada. As of the 2020 census, the population was 40,474. The county seat is Jackson. Amador County, located within California's Gold Country, is known as "The Heart of the Mother Lode". There is a substantial viticultural industry in the county.

<span class="mw-page-title-main">Colusa County, California</span> County in California, United States

Colusa County is a county located in the U.S. state of California. As of the 2020 census, the population was 21,839. The county seat is Colusa. It is in the northern Sacramento Valley, northwest of the state capital, Sacramento.

<span class="mw-page-title-main">El Dorado County, California</span> County in California, United States

El Dorado County, officially the County of El Dorado, is a county located in the U.S. state of California. As of the 2020 census, the population was 191,185. The county seat is Placerville. The county is part of the Sacramento-Roseville-Arden-Arcade, CA Metropolitan Statistical Area. It is located entirely in the Sierra Nevada, from the historic Gold Country in the western foothills to the High Sierra in the east. El Dorado County's population has grown as Greater Sacramento has expanded into the region. Where the county line crosses US 50 at Clarksville, the distance to Sacramento is 15 miles. In the county's high altitude eastern end at Lake Tahoe, environmental awareness and environmental protection initiatives have grown along with the population since the 1960 Winter Olympics, hosted at the former Squaw Valley Ski Resort in neighboring Placer County.

<span class="mw-page-title-main">Glenn County, California</span> County in California, United States

Glenn County is a county located in the U.S. state of California. As of the 2020 census, the population was 28,917. The county seat is Willows. It is located in the Sacramento Valley, in the northern part of the California Central Valley. The Grindstone Rancheria, reservation of the Grindstone Indian Rancheria of Wintun-Wailaki Indians, is located in Glenn County.

<span class="mw-page-title-main">Inyo County, California</span> County in California, United States

Inyo County is a county in the eastern central part of the U.S. state of California, located between the Sierra Nevada and the state of Nevada. In the 2020 census, the population was 19,016. The county seat is Independence. Inyo County is on the east side of the Sierra Nevada and southeast of Yosemite National Park in Central California. It contains the Owens River Valley; it is flanked to the west by the Sierra Nevada and to the east by the White Mountains and the Inyo Mountains. With an area of 10,192 square miles (26,400 km2), Inyo is the second-largest county by area in California, after San Bernardino County. Almost one-half of that area is within Death Valley National Park. However, with a population density of 1.8 people per square mile, it also has the second-lowest population density in California, after Alpine County.

<span class="mw-page-title-main">Kings County, California</span> County in California, United States

Kings County is a county located in the U.S. state of California. The population was 152,486 at the 2020 census. The county seat is Hanford.

<span class="mw-page-title-main">Mendocino County, California</span> County in the United States

Mendocino County is a county located on the North Coast of the U.S. state of California. As of the 2020 census, the population was 91,601. The county seat is Ukiah.

<span class="mw-page-title-main">Modoc County, California</span> County in California, United States

Modoc County is a county in the far northeast corner of the U.S. state of California. Its population is 8,700 as of the 2020 census, down from 9,686 from the 2010 census. This makes it California's third-least populous county. The county seat and only incorporated city is Alturas. Previous county seats include Lake City and Centerville. The county borders Nevada and Oregon.

<span class="mw-page-title-main">Mono County, California</span> County in California, United States

Mono County is a county located in the east central portion of the U.S. state of California. As of the 2020 census, the population was 13,195, making it the fourth-least populous county in California. The county seat is Bridgeport. The county is located east of the Sierra Nevada between Yosemite National Park and Nevada. The only incorporated town in the county is Mammoth Lakes, which is located at the foot of Mammoth Mountain. Other locations, such as June Lake, are also famous as skiing and fishing resorts. Located in the middle of the county is Mono Lake, a vital habitat for millions of migratory and nesting birds. The lake is located in a wild natural setting, with pinnacles of tufa arising out of the salty and alkaline lake. Also located in Mono County is Bodie, the official state gold rush ghost town, which is now a California State Historic Park.

<span class="mw-page-title-main">Placer County, California</span> County in California, United States

Placer County, officially the County of Placer, is a county located in the U.S. state of California. As of the 2020 census, the population was 404,739. The county seat is Auburn.

<span class="mw-page-title-main">Sutter County, California</span> County in California, United States

Sutter County is a county located in the U.S. state of California. As of the 2020 census, the population was 99,633. The county seat is Yuba City. Sutter County is included in the Yuba City, CA Metropolitan Statistical Area as well as the Sacramento-Roseville, CA Combined Statistical Area. The county is located along the Sacramento River in the Sacramento Valley.

<span class="mw-page-title-main">Tehama County, California</span> County in California, United States

Tehama County is a county located in the northern part of the U.S. state of California. As of the 2020 census, the population was 65,829. The county seat and largest city is Red Bluff.

<span class="mw-page-title-main">Trinity County, California</span> County in California, United States

Trinity County is a county located in the northwestern portion of the U.S. state of California. Trinity County is rugged, mountainous, heavily forested, and lies along the Trinity River within the Salmon and Klamath Mountains. It is also one of three counties in California with no incorporated cities.

<span class="mw-page-title-main">Clearlake, California</span> City in California, United States

Clearlake is a city in Lake County, California. Clearlake is 4.5 miles (7.2 km) north-northwest of Lower Lake, at an elevation of 1,417 feet (432 m). As of the 2020 census, the city had a total population of 16,685, up from 15,250 in 2010. It takes its name from Clear Lake.

<span class="mw-page-title-main">Lakeport, California</span> City in California, United States

Lakeport is an incorporated city and the county seat of Lake County, California. This city is 125 miles (201 km) northwest of Sacramento. Lakeport is on the western shore of Clear Lake, at an elevation of 1,355 feet (413 m). The population was 7000 at the 2024 census, up from 4,753 at the 2010 census.

<span class="mw-page-title-main">Lower Lake, California</span> Census-designated place in California, United States

Lower Lake is a census-designated place (CDP) in the southern Clear Lake region of Lake County, in northern California. Lower Lake is also an Indian rancheria of the Koi Nation people.

<span class="mw-page-title-main">Upper Lake, California</span> Census-designated place in California, United States

Upper Lake is a census-designated place (CDP) in Lake County, California, United States. Upper Lake is located 8 miles (13 km) north of Lakeport, at an elevation of 1,345 feet (410 m). The population was 1,052 at the 2010 census, up from 989 at the 2000 census. The Habematolel Pomo of Upper Lake are headquartered here.

<span class="mw-page-title-main">Calpella, California</span> Census-designated place in California, United States

Calpella is an unincorporated community and census-designated place (CDP) in Mendocino County, California, United States. It is located on the Russian River, 6 miles (10 km) north of Ukiah. It is situated within the Ukiah Valley, at the intersection of U.S. Route 101 and State Route 20. The population was 799 at the 2020 census, up from 679 in 2010. The small town is the site of the Mendocino Redwood Company mill and offices, which controls ten percent of the private land in the county.

<span class="mw-page-title-main">Lake Transit</span>

Lake Transit is a bus agency providing fixed-route, flex-stop and curbside "Dial-a-Ride" bus service in Lake County, California. The agency also provides service to Ukiah in Mendocino County and St. Helena in northern Napa County.

References

  1. "Lake County". Geographic Names Information System . United States Geological Survey, United States Department of the Interior.
  2. "Board of Supervisors". www.lakecountyca.gov. Retrieved July 1, 2022.
  3. "Snow Mountain". Peakbagger.com. Archived from the original on May 2, 2015. Retrieved April 9, 2015.
  4. "Lake County, California". United States Census Bureau . Retrieved January 30, 2022.
  5. "Find a County". National Association of Counties. Archived from the original on May 31, 2011. Retrieved June 7, 2011.
  6. "Clear Lake Is Unique". Official Website of the County of Lake. County of Lake. September 13, 2013. Archived from the original on October 6, 2015. Retrieved October 9, 2015.
  7. "2002 Economic Census: Summary Statistics by 2002 NAICS - Clearlake, CA Micropolitan Statistical Area". Archived from the original on May 27, 2014. Retrieved May 27, 2014. Clearlake, CA Micropolitan Statistical Area
  8. "Our Mission/History".
  9. "Lake County, California". Genealogy Trails. 2006. Retrieved October 9, 2015.
  10. California (1868). The Statutes of California Passed at the Seventeenth Session of the Legislature. J. Winchester. p. 269.
  11. Coy, Owen C. (1923). California County Boundaries: A Study of the Division of the State into Counties and the Subsequent Changes in their Boundaries (PDF). California Historical Survey Commission. Archived from the original (PDF) on November 13, 2020.
  12. California Secretary of State (1911). California Blue Book. p. 655.
  13. 1 2 "Lake County's crop value surges past $100 million, setting new record". June 23, 2016. Archived from the original on June 24, 2016. Retrieved July 2, 2016.
  14. "Lake County wine industry is ready for takeoff". May 15, 2016. Archived from the original on June 21, 2016. Retrieved July 2, 2016.
  15. "Wineries". www.lakecountywineries.org. Archived from the original on April 25, 2016. Retrieved July 2, 2016.
  16. 1 2 "Lake County's air rated cleanest in the nation". April 30, 2015. Archived from the original on August 16, 2016. Retrieved July 2, 2016.
  17. "How healthy is the air you breathe?". lung.org. Archived from the original on January 12, 2018. Retrieved March 26, 2018.
  18. "2010 Census Gazetteer Files". United States Census Bureau. August 22, 2012. Archived from the original on September 25, 2015. Retrieved September 26, 2015.
  19. 1 2 Sanderson, Marcia (2005). Lake County. Charleston, South Carolina: Arcadia Publishing. pp. 39–52. ISBN   978-0-7385-3030-7.
  20. "LAKE COUNTY HISTORY". Archived from the original on August 31, 2013. Retrieved September 8, 2012.
  21. https://www.sfgate.com/weather/article/Harbin-Hot-Springs-opening-pools-reservations-fire-13535539.php Clothing optional resort Harbin Hot Springs reopens its pools 3 years after wildfire
  22. 1 2 "Lake County History Timeline". Archived from the original on February 22, 2013. Retrieved September 8, 2012.
  23. "CLEARLAKE 4 SE, CALIFORNIA - Climate Summary". www.wrcc.dri.edu. Archived from the original on May 25, 2017. Retrieved March 26, 2018.
  24. "Annual Estimates of the Resident Population for Counties: April 1, 2020 to July 1, 2023". United States Census Bureau. Retrieved March 26, 2024.
  25. "Census of Population and Housing from 1790-2000". US Census Bureau . Retrieved January 24, 2022.
  26. "Historical Census Browser". University of Virginia Library. Archived from the original on August 11, 2012. Retrieved September 26, 2015.
  27. Forstall, Richard L., ed. (March 27, 1995). "Population of Counties by Decennial Census: 1900 to 1990". United States Census Bureau. Archived from the original on September 24, 2015. Retrieved September 26, 2015.
  28. "Census 2000 PHC-T-4. Ranking Tables for Counties: 1990 and 2000" (PDF). United States Census Bureau. April 2, 2001. Archived (PDF) from the original on December 18, 2014. Retrieved September 26, 2015.
  29. 1 2 "P2 HISPANIC OR LATINO, AND NOT HISPANIC OR LATINO BY RACE - 2010: DEC Redistricting Data (PL 94-171) - Lake County, California". United States Census Bureau .
  30. 1 2 "P2 HISPANIC OR LATINO, AND NOT HISPANIC OR LATINO BY RACE - 2020: DEC Redistricting Data (PL 94-171) - Lake County, California". United States Census Bureau .
  31. 1 2 3 4 5 6 7 8 9 10 11 12 13 14 15 16 17 U.S. Census Bureau. American Community Survey, 2011 American Community Survey 5-Year Estimates, Table B02001. U.S. Census website . Retrieved October 26, 2013.
  32. 1 2 U.S. Census Bureau. American Community Survey, 2011 American Community Survey 5-Year Estimates, Table B03003. U.S. Census website . Retrieved October 26, 2013.
  33. 1 2 U.S. Census Bureau. American Community Survey, 2011 American Community Survey 5-Year Estimates, Table B19301. U.S. Census website . Retrieved October 21, 2013.
  34. 1 2 U.S. Census Bureau. American Community Survey, 2011 American Community Survey 5-Year Estimates, Table B19013. U.S. Census website . Retrieved October 21, 2013.
  35. 1 2 U.S. Census Bureau. American Community Survey, 2011 American Community Survey 5-Year Estimates, Table B19113. U.S. Census website . Retrieved October 21, 2013.
  36. 1 2 U.S. Census Bureau. American Community Survey, 2011 American Community Survey 5-Year Estimates. U.S. Census website . Retrieved October 21, 2013.
  37. U.S. Census Bureau. American Community Survey, 2011 American Community Survey 5-Year Estimates, Table B01003. U.S. Census website . Retrieved October 21, 2013.
  38. "2010 Census P.L. 94-171 Summary File Data". United States Census Bureau.
  39. Bureau, U.S. Census. "American FactFinder - Results". factfinder2.census.gov. Archived from the original on February 12, 2020. Retrieved March 26, 2018.
  40. U.S. Department of Commerce Archived January 4, 2011, at the Wayback Machine
  41. 1 2 3 4 5 6 7 8 9 10 11 12 13 14 15 16 17 California Secretary of State. February 10, 2013 - Report of Registration Archived July 27, 2013, at the Wayback Machine . Retrieved October 31, 2013.
  42. 1 2 Menendez, Albert J.; The Geography of Presidential Elections in the United States, 1868-2004, pp. 152-155 ISBN   0786422173
  43. Leip, David. "Dave Leip's Atlas of U.S. Presidential Elections". uselectionatlas.org. Archived from the original on June 4, 2011. Retrieved March 26, 2018.
  44. "California's 4th Congressional District - Representatives & District Map". Civic Impulse, LLC. Retrieved February 25, 2023.
  45. California Secretary of State: “Statement of Vote for November 4, 2008, General Election” Archived October 18, 2012, at the Wayback Machine , page 62.
  46. 1 2 3 4 5 6 7 8 9 10 Office of the Attorney General, Department of Justice, State of California. Table 11: Crimes 2009 Archived December 2, 2013, at the Wayback Machine . Retrieved November 14, 2013.
  47. 1 2 3 United States Department of Justice, Federal Bureau of Investigation. Crime in the United States, 2017, Table 8 (California) Archived September 25, 2018, at the Wayback Machine . Retrieved May 27, 2019.
  48. "California Agricultural Resource Directory 2010 –2011" (PDF). Mother Jones. Archived (PDF) from the original on March 8, 2014. Retrieved March 1, 2014.
  49. "California Agricultural Statistics Review 2013 –2014" (PDF). Archived (PDF) from the original on September 5, 2015. Retrieved September 22, 2015.
  50. "Agricultural Statistics Review, 2014-2015" (PDF). California Department of Food and Agriculture. Archived (PDF) from the original on December 20, 2016. Retrieved December 8, 2016.
  51. "Routes & Schedules". laketransit.org. Archived from the original on March 27, 2018. Retrieved March 26, 2018.
  52. "General Information". laketransit.org. Archived from the original on March 27, 2018. Retrieved March 26, 2018.
  53. "Glimpses of the past". Cloverdale Reveille. August 1, 1984. Retrieved February 28, 2014.
  54. "CLEAR LAKE RAILROAD TO BEGIN WORK SOON". San Francisco Call. September 30, 1911. Archived from the original on March 6, 2014. Retrieved February 28, 2014.
  55. Aurelius O. Carpenter And Percy H. Millberry, (Transcribed by Peggy Hooper) (1914). History of Mendocino and Lake Counties, California With Biographical Sketches. Historic Record Company, Los Angeles, California. Archived from the original on November 17, 2014.
  56. "2010 U.S. Census website". United States Census Bureau . Retrieved February 10, 2013.
  57. Staff, Website Services & Coordination. "US Census Bureau 2010 Census Interactive Population Map". www.census.gov. Archived from the original on April 29, 2018. Retrieved March 26, 2018.
  58. Staff, Website Services & Coordination. "US Census Bureau 2010 Census Interactive Population Map". www.census.gov. Archived from the original on April 29, 2018. Retrieved March 26, 2018.
  59. Staff, Website Services & Coordination. "US Census Bureau 2010 Census Interactive Population Map". www.census.gov. Archived from the original on April 29, 2018. Retrieved March 26, 2018.
  60. Staff, Website Services & Coordination. "US Census Bureau 2010 Census Interactive Population Map". www.census.gov. Archived from the original on April 29, 2018. Retrieved March 26, 2018.
  61. Staff, Website Services & Coordination. "US Census Bureau 2010 Census Interactive Population Map". www.census.gov. Archived from the original on April 29, 2018. Retrieved March 26, 2018.

39°05′N122°46′W / 39.09°N 122.76°W / 39.09; -122.76