The climate of California varies widely from hot desert to alpine tundra, depending on latitude, elevation, and proximity to the Pacific Coast. California's coastal regions, the Sierra Nevada foothills, and much of the Central Valley have a Mediterranean climate, with warmer, drier weather in summer and cooler, wetter weather in winter. The influence of the ocean generally moderates temperature extremes, creating warmer winters and substantially cooler summers in coastal areas.
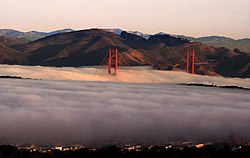
The cool California Current offshore, enhanced by upwelling of cold sub-surface waters, often creates summer fog near the coast, creating a warm-summer Mediterranean climate (Köppen climate classification Csb). Further inland, the climate becomes more continental, with some areas turning semi-arid (Köppen BSk), with colder winters and markedly hotter summers. Low-lying inland valleys, especially the Central Valley, have a hot-summer Mediterranean climate (Köppen Csa), with subtropical temperatures but a well-defined summer dry season and a foggy, rainy season in winter.
The temperature gradient between immediate coast and low-lying inland valleys in the south is about 7 °F (4 °C) in winter, the coast being warmer, and in summer roughly 25 °F (14 °C), the interior being warmer. For example, the average daily high in San Francisco in July and August is between 62 and 68 °F (17 and 20 °C), [1] [2] and in Walnut Creek, some 20 miles (32 km) inland, the average daily high in July and August is 90 °F (32 °C): a temperature gain of more than one degree (Fahrenheit) per mile. [3] In Southern California, the temperature differences are approximately 4 °F in winter and 23 °F (2 °C and 13 °C) in summer. At the coast in Santa Monica, the average high in August is 75 °F (24 °C), while in Burbank, approximately 10 miles (16 km) inland, the average high in August is 95 °F (35 °C): a temperature gain of about two degrees Fahrenheit per mile. [4]
During the cooler winter months (October–March), the Coachella Valley regularly has the warmest winter temperatures out of any place west of the Rocky Mountains. East Los Angeles, the Gateway Cities, and parts of the San Gabriel Valley average the warmest winter high temps (72 °F, 22 °C) in all of the western U.S., and Santa Monica averages the warmest winter lows (52 °F, 11 °C) in all of the western U.S. Palm Springs, a city in the Coachella Valley, averages high/low/mean temperatures of 75 °F/50 °F/63 °F, (24 °C/10 °C/17 °C) respectively during the period of cooler weather from November to April. [5]
The extreme southwest, around San Diego, has a subtropical semi-arid or steppe climate (Koppen BSh) as winters are drier there.
The southeastern regions have a hot arid climate (Koppen BWh), similar to that of the Sahara Desert. In the northern portion of the Mojave Desert on the east side of the state is Death Valley, which has recorded temperatures among the highest in the world. It is common in the summer for temperatures in the valley to surpass 120 °F (49 °C). The highest reliably recorded temperature in the world, [6] [7] 134 °F (56.7 °C), was recorded in Death Valley on July 10, 1913. Temperatures of 130 °F (54 °C) or higher have been recorded as recently as 2005. The 24-hour average July temperature in Death Valley is 101.8 °F (38.8 °C) (1981–2010 NCDC Normals).
Place | Jan | Feb | Mar | Apr | May | Jun | Jul | Aug | Sep | Oct | Nov | Dec |
---|---|---|---|---|---|---|---|---|---|---|---|---|
Alturas [8] | 44 / 18 (7 / −8) | 48 / 21 (9 / −6) | 54 / 25 (12 / −4) | 60 / 28 (16 / −2) | 70 / 34 (21 / 1) | 79 / 40 (26 / 4) | 90 / 44 (32 / 7) | 89 / 42 (32 / 6) | 80 / 36 (27 / 2) | 68 / 28 (20 / −2) | 52 / 23 (11 / −5) | 42 / 18 (6 / −8) |
Bakersfield [9] | 56 / 39 (13 / 4) | 63 / 42 (17 / 6) | 69 / 47 (21 / 8) | 75 / 50 (24 / 10) | 84 / 58 (29 / 14) | 91 / 64 (33 / 18) | 97 / 71 (36 / 22) | 96 / 69 (36 / 21) | 90 / 64 (32 / 18) | 80 / 55 (27 / 13) | 66 / 45 (19 / 7) | 57 / 39 (14 / 4) |
Bishop [10] | 54 / 23 (12 / −5) | 58 / 27 (14 / −3) | 66 / 31 (19 / −1) | 73 / 36 (23 / 2) | 82 / 44 (28 / 7) | 92 / 51 (33 / 11) | 98 / 56 (37 / 13) | 96 / 54 (36 / 12) | 88 / 47 (31 / 8) | 76 / 37 (24 / 3) | 63 / 28 (17 / −2) | 53 / 22 (12 / −6) |
Bodie [11] | 40 / 5 (4 / −15) | 41 / 7 (5 / −14) | 45 / 11 (7 / −12) | 50 / 17 (10 / −8) | 61 / 24 (16 / −4) | 70 / 30 (21 / −1) | 78 / 34 (26 / 1) | 77 / 32 (25 / 0) | 71 / 26 (22 / −3) | 60 / 18 (16 / −8) | 49 / 11 (9 / −12) | 41 / 6 (5 / −14) |
Death Valley [12] | 67 / 40 (19 / 4) | 73 / 46 (23 / 8) | 82 / 55 (28 / 13) | 91 / 62 (33 / 17) | 101 / 73 (38 / 23) | 110 / 81 (43 / 27) | 117 / 88 (47 / 31) | 115 / 86 (46 / 30) | 107 / 76 (42 / 24) | 93 / 62 (34 / 17) | 77 / 48 (25 / 9) | 65 / 38 (18 / 3) |
Eureka [13] | 56 / 41 (13 / 5) | 56 / 42 (13 / 6) | 57 / 43 (14 / 6) | 58 / 44 (14 / 7) | 60 / 48 (16 / 9) | 62 / 50 (17 / 10) | 63 / 52 (17 / 11) | 64 / 53 (18 / 12) | 64 / 50 (18 / 10) | 62 / 47 (17 / 8) | 58 / 44 (14 / 7) | 55 / 41 (13 / 5) |
Fresno [14] | 55 / 38 (13 / 3) | 62 / 42 (17 / 6) | 68 / 46 (20 / 8) | 75 / 49 (24 / 9) | 84 / 56 (29 / 13) | 92 / 62 (33 / 17) | 98 / 68 (37 / 20) | 97 / 66 (36 / 19) | 91 / 62 (33 / 17) | 80 / 53 (27 / 12) | 65 / 43 (18 / 6) | 55 / 38 (13 / 3) |
Los Angeles [15] | 68 / 48 (20 / 9) | 69 / 49 (21 / 9) | 70 / 51 (21 / 11) | 73 / 54 (23 / 12) | 75 / 57 (24 / 14) | 78 / 60 (26 / 16) | 83 / 64 (28 / 18) | 84 / 64 (29 / 18) | 83 / 63 (28 / 17) | 79 / 59 (26 / 15) | 73 / 52 (23 / 11) | 68 / 48 (20 / 9) |
Needles [16] | 65 / 44 (18 / 7) | 70 / 47 (21 / 8) | 77 / 52 (25 / 11) | 85 / 59 (29 / 15) | 95 / 68 (35 / 20) | 104 / 77 (40 / 25) | 109 / 84 (43 / 29) | 107 / 83 (42 / 28) | 100 / 75 (38 / 24) | 88 / 62 (31 / 17) | 73 / 50 (23 / 10) | 63 / 43 (17 / 6) |
Redding [17] | 55 / 37 (13 / 3) | 60 / 39 (16 / 4) | 65 / 43 (18 / 6) | 71 / 46 (22 / 8) | 81 / 54 (27 / 12) | 90 / 61 (32 / 16) | 98 / 66 (37 / 19) | 97 / 63 (36 / 17) | 90 / 58 (32 / 14) | 78 / 50 (26 / 10) | 63 / 41 (17 / 5) | 55 / 36 (13 / 2) |
Riverside [18] | 69 / 43 (21 / 6) | 70 / 45 (21 / 7) | 73 / 46 (23 / 8) | 78 / 50 (26 / 10) | 83 / 55 (28 / 13) | 89 / 60 (32 / 16) | 95 / 64 (35 / 18) | 96 / 65 (36 / 18) | 92 / 61 (33 / 16) | 83 / 55 (28 / 13) | 75 / 47 (24 / 8) | 68 / 42 (20 / 6) |
Sacramento [19] | 54 / 39 (12 / 4) | 60 / 41 (16 / 5) | 65 / 44 (18 / 7) | 71 / 46 (22 / 8) | 80 / 51 (27 / 11) | 87 / 56 (31 / 13) | 92 / 58 (33 / 14) | 91 / 58 (33 / 14) | 87 / 56 (31 / 13) | 78 / 50 (26 / 10) | 64 / 43 (18 / 6) | 54 / 38 (12 / 3) |
San Diego [20] | 65 / 49 (18 / 9) | 65 / 51 (18 / 11) | 67 / 53 (19 / 12) | 68 / 56 (20 / 13) | 69 / 59 (21 / 15) | 71 / 62 (22 / 17) | 75 / 65 (24 / 18) | 76 / 67 (24 / 19) | 76 / 65 (24 / 18) | 73 / 61 (23 / 16) | 69 / 54 (21 / 12) | 65 / 48 (18 / 9) |
San Francisco [1] | 57 / 46 (14 / 8) | 60 / 48 (16 / 9) | 62 / 49 (17 / 9) | 63 / 49 (17 / 9) | 64 / 51 (18 / 11) | 66 / 53 (19 / 12) | 66 / 54 (19 / 12) | 68 / 55 (20 / 13) | 70 / 55 (21 / 13) | 69 / 54 (21 / 12) | 63 / 50 (17 / 10) | 57 / 46 (14 / 8) |
San Jose [21] | 58 / 42 (14 / 6) | 62 / 45 (17 / 7) | 66 / 47 (19 / 8) | 69 / 49 (21 / 9) | 74 / 52 (23 / 11) | 79 / 56 (26 / 13) | 82 / 58 (28 / 14) | 82 / 58 (28 / 14) | 80 / 57 (27 / 14) | 74 / 53 (23 / 12) | 64 / 46 (18 / 8) | 58 / 42 (14 / 6) |
Santa Rosa [22] | 59 / 39 (15 / 4) | 63 / 41 (17 / 5) | 67 / 43 (19 / 6) | 70 / 45 (21 / 7) | 75 / 48 (24 / 9) | 80 / 52 (27 / 11) | 82 / 52 (28 / 11) | 83 / 53 (28 / 12) | 83 / 52 (28 / 11) | 78 / 48 (26 / 9) | 67 / 43 (19 / 6) | 59 / 39 (15 / 4) |
South Lake Tahoe [23] | 43 / 16 (6 / −9) | 44 / 18 (7 / −8) | 49 / 23 (9 / −5) | 54 / 27 (12 / −3) | 64 / 32 (18 / 0) | 72 / 37 (22 / 3) | 81 / 41 (27 / 5) | 80 / 40 (27 / 4) | 74 / 35 (23 / 2) | 63 / 28 (17 / −2) | 51 / 22 (11 / −6) | 43 / 17 (6 / −8) |
The highest temperature ever recorded in California was 134 °F (57 °C) in Death Valley on July 10, 1913. This is also the highest temperature ever recorded on Earth. The lowest was −45 °F (−43 °C) in Boca on January 20, 1937.
Climate data for California | |||||||||||||
---|---|---|---|---|---|---|---|---|---|---|---|---|---|
Month | Jan | Feb | Mar | Apr | May | Jun | Jul | Aug | Sep | Oct | Nov | Dec | Year |
Record high °F (°C) | 97 (36) | 100 (38) | 107 (42) | 118 (48) | 122 (50) | 129 (54) | 134 (57) | 130 (54) | 126 (52) | 117 (47) | 105 (41) | 100 (38) | 134 (57) |
Record low °F (°C) | −45 (−43) | −43 (−42) | −35 (−37) | −30 (−34) | −15 (−26) | 2 (−17) | 12 (−11) | 12 (−11) | −5 (−21) | −20 (−29) | −28 (−33) | −40 (−40) | −45 (−43) |
Source: https://www.infoplease.com/science-health/weather/california-temperature-extremes |
Climate data for Fresno, California (Fresno Airport), 1991–2020 normals, [lower-alpha 1] extremes 1881–present [lower-alpha 2] | |||||||||||||
---|---|---|---|---|---|---|---|---|---|---|---|---|---|
Month | Jan | Feb | Mar | Apr | May | Jun | Jul | Aug | Sep | Oct | Nov | Dec | Year |
Record high °F (°C) | 78 (26) | 84 (29) | 91 (33) | 101 (38) | 110 (43) | 112 (44) | 115 (46) | 113 (45) | 114 (46) | 102 (39) | 90 (32) | 77 (25) | 115 (46) |
Mean maximum °F (°C) | 68.1 (20.1) | 73.7 (23.2) | 81.9 (27.7) | 90.8 (32.7) | 99.0 (37.2) | 105.9 (41.1) | 107.7 (42.1) | 107.1 (41.7) | 103.1 (39.5) | 93.2 (34.0) | 79.6 (26.4) | 67.4 (19.7) | 109.2 (42.9) |
Average high °F (°C) | 55.4 (13.0) | 61.3 (16.3) | 67.5 (19.7) | 73.7 (23.2) | 82.7 (28.2) | 91.4 (33.0) | 97.7 (36.5) | 96.5 (35.8) | 90.7 (32.6) | 78.7 (25.9) | 64.9 (18.3) | 55.3 (12.9) | 76.3 (24.6) |
Daily mean °F (°C) | 48.0 (8.9) | 52.3 (11.3) | 57.4 (14.1) | 62.3 (16.8) | 70.2 (21.2) | 77.6 (25.3) | 83.5 (28.6) | 82.2 (27.9) | 77.1 (25.1) | 66.7 (19.3) | 55.1 (12.8) | 47.5 (8.6) | 65.0 (18.3) |
Average low °F (°C) | 40.6 (4.8) | 43.3 (6.3) | 47.3 (8.5) | 50.9 (10.5) | 57.6 (14.2) | 63.9 (17.7) | 69.3 (20.7) | 67.9 (19.9) | 63.4 (17.4) | 54.6 (12.6) | 45.4 (7.4) | 39.8 (4.3) | 53.7 (12.1) |
Mean minimum °F (°C) | 30.5 (−0.8) | 33.4 (0.8) | 37.2 (2.9) | 40.4 (4.7) | 47.7 (8.7) | 52.9 (11.6) | 60.1 (15.6) | 59.7 (15.4) | 53.8 (12.1) | 44.6 (7.0) | 34.7 (1.5) | 30.2 (−1.0) | 28.8 (−1.8) |
Record low °F (°C) | 17 (−8) | 24 (−4) | 26 (−3) | 32 (0) | 36 (2) | 42 (6) | 50 (10) | 49 (9) | 37 (3) | 27 (−3) | 26 (−3) | 18 (−8) | 17 (−8) |
Average precipitation inches (mm) | 2.16 (55) | 1.93 (49) | 1.90 (48) | 1.04 (26) | 0.42 (11) | 0.24 (6.1) | 0.03 (0.76) | trace | 0.05 (1.3) | 0.56 (14) | 0.87 (22) | 1.79 (45) | 10.99 (279) |
Average precipitation days (≥ 0.01 in) | 7.7 | 8.5 | 7.2 | 4.5 | 2.7 | 0.7 | 0.3 | 0.1 | 0.6 | 2.2 | 4.7 | 7.3 | 46.5 |
Average relative humidity (%) | 83.3 | 77.2 | 68.9 | 57.4 | 47.3 | 41.9 | 39.2 | 44.7 | 50.0 | 58.5 | 74.1 | 84.2 | 60.6 |
Mean monthly sunshine hours | 141.5 | 196.9 | 286.2 | 335.5 | 398.9 | 412.2 | 428.2 | 399.6 | 345.9 | 302.3 | 189.9 | 127.1 | 3,564.2 |
Percent possible sunshine | 46 | 65 | 77 | 85 | 91 | 94 | 96 | 95 | 93 | 87 | 62 | 42 | 80 |
Source: NOAA (relative humidity and sun 1961–1990) [24] [25] [26] |
Month | Jan | Feb | Mar | Apr | May | Jun | Jul | Aug | Sep | Oct | Nov | Dec | Year |
---|---|---|---|---|---|---|---|---|---|---|---|---|---|
Record high °F (°C) | 95 (35) | 95 (35) | 99 (37) | 106 (41) | 103 (39) | 112 (44) | 109 (43) | 106 (41) | 113 (45) | 108 (42) | 100 (38) | 92 (33) | 113 (45) |
Mean maximum °F (°C) | 83.0 (28.3) | 82.8 (28.2) | 85.8 (29.9) | 90.1 (32.3) | 88.9 (31.6) | 89.1 (31.7) | 93.5 (34.2) | 95.2 (35.1) | 99.4 (37.4) | 95.7 (35.4) | 88.9 (31.6) | 81.0 (27.2) | 101.5 (38.6) |
Average high °F (°C) | 68.0 (20.0) | 68.0 (20.0) | 69.9 (21.1) | 72.4 (22.4) | 73.7 (23.2) | 77.2 (25.1) | 82.0 (27.8) | 84.0 (28.9) | 83.0 (28.3) | 78.6 (25.9) | 72.9 (22.7) | 67.4 (19.7) | 74.8 (23.8) |
Daily mean °F (°C) | 58.4 (14.7) | 59.0 (15.0) | 61.1 (16.2) | 63.6 (17.6) | 65.9 (18.8) | 69.3 (20.7) | 73.3 (22.9) | 74.7 (23.7) | 73.6 (23.1) | 69.3 (20.7) | 63.0 (17.2) | 57.8 (14.3) | 65.8 (18.8) |
Average low °F (°C) | 48.9 (9.4) | 50.0 (10.0) | 52.4 (11.3) | 54.8 (12.7) | 58.1 (14.5) | 61.4 (16.3) | 64.7 (18.2) | 65.4 (18.6) | 64.2 (17.9) | 59.9 (15.5) | 53.1 (11.7) | 48.2 (9.0) | 56.8 (13.8) |
Mean minimum °F (°C) | 41.4 (5.2) | 42.9 (6.1) | 45.4 (7.4) | 48.9 (9.4) | 53.5 (11.9) | 57.4 (14.1) | 61.1 (16.2) | 61.7 (16.5) | 59.1 (15.1) | 53.7 (12.1) | 45.4 (7.4) | 40.5 (4.7) | 39.2 (4.0) |
Record low °F (°C) | 28 (−2) | 28 (−2) | 31 (−1) | 36 (2) | 40 (4) | 46 (8) | 49 (9) | 49 (9) | 44 (7) | 40 (4) | 34 (1) | 30 (−1) | 28 (−2) |
Average rainfall inches (mm) | 3.29 (84) | 3.64 (92) | 2.23 (57) | 0.69 (18) | 0.32 (8.1) | 0.09 (2.3) | 0.02 (0.51) | 0.00 (0.00) | 0.13 (3.3) | 0.58 (15) | 0.78 (20) | 2.48 (63) | 14.25 (362) |
Average rainy days (≥ 0.01 in) | 6.1 | 6.3 | 5.1 | 2.8 | 1.9 | 0.5 | 0.4 | 0.1 | 0.4 | 2.2 | 2.8 | 5.5 | 34.1 |
Mean monthly sunshine hours | 225.3 | 222.5 | 267.0 | 303.5 | 276.2 | 275.8 | 364.1 | 349.5 | 278.5 | 255.1 | 217.3 | 219.4 | 3,254.2 |
Percent possible sunshine | 71 | 72 | 72 | 78 | 64 | 64 | 83 | 84 | 75 | 73 | 70 | 71 | 73 |
Source: NOAA (sun 1961–1977) [27] [28] [29] [30] |
Month | Jan | Feb | Mar | Apr | May | Jun | Jul | Aug | Sep | Oct | Nov | Dec | Year |
---|---|---|---|---|---|---|---|---|---|---|---|---|---|
Record high °F (°C) | 91 (33) | 92 (33) | 95 (35) | 102 (39) | 97 (36) | 104 (40) | 97 (36) | 98 (37) | 110 (43) | 106 (41) | 101 (38) | 94 (34) | 110 (43) |
Mean maximum °F (°C) | 81.2 (27.3) | 80.1 (26.7) | 80.6 (27.0) | 83.1 (28.4) | 80.6 (27.0) | 79.8 (26.6) | 83.7 (28.7) | 86.0 (30.0) | 90.7 (32.6) | 90.9 (32.7) | 87.2 (30.7) | 78.8 (26.0) | 95.5 (35.3) |
Average high °F (°C) | 66.3 (19.1) | 65.6 (18.7) | 66.1 (18.9) | 68.1 (20.1) | 69.5 (20.8) | 72.0 (22.2) | 75.1 (23.9) | 76.7 (24.8) | 76.5 (24.7) | 74.4 (23.6) | 70.9 (21.6) | 66.1 (18.9) | 70.6 (21.4) |
Daily mean °F (°C) | 57.9 (14.4) | 57.9 (14.4) | 59.1 (15.1) | 61.1 (16.2) | 63.6 (17.6) | 66.4 (19.1) | 69.6 (20.9) | 70.7 (21.5) | 70.1 (21.2) | 67.1 (19.5) | 62.3 (16.8) | 57.6 (14.2) | 63.6 (17.6) |
Average low °F (°C) | 49.4 (9.7) | 50.1 (10.1) | 52.2 (11.2) | 54.2 (12.3) | 57.6 (14.2) | 60.9 (16.1) | 64.0 (17.8) | 64.8 (18.2) | 63.7 (17.6) | 59.8 (15.4) | 53.7 (12.1) | 49.1 (9.5) | 56.6 (13.7) |
Mean minimum °F (°C) | 41.8 (5.4) | 42.9 (6.1) | 45.3 (7.4) | 48.0 (8.9) | 52.7 (11.5) | 56.7 (13.7) | 60.2 (15.7) | 61.0 (16.1) | 58.7 (14.8) | 53.2 (11.8) | 46.1 (7.8) | 41.1 (5.1) | 39.4 (4.1) |
Record low °F (°C) | 27 (−3) | 34 (1) | 35 (2) | 42 (6) | 45 (7) | 48 (9) | 52 (11) | 51 (11) | 47 (8) | 43 (6) | 38 (3) | 32 (0) | 27 (−3) |
Average rainfall inches (mm) | 2.86 (73) | 2.99 (76) | 1.73 (44) | 0.60 (15) | 0.28 (7.1) | 0.08 (2.0) | 0.04 (1.0) | 0.00 (0.00) | 0.11 (2.8) | 0.49 (12) | 0.82 (21) | 2.23 (57) | 12.23 (311) |
Average rainy days (≥ 0.01 in) | 6.1 | 6.3 | 5.6 | 2.6 | 1.7 | 0.5 | 0.5 | 0.1 | 0.5 | 2.0 | 3.2 | 5.4 | 34.5 |
Average relative humidity (%) | 63.4 | 67.9 | 70.5 | 71.0 | 74.0 | 75.9 | 76.6 | 76.6 | 74.2 | 70.5 | 65.5 | 62.9 | 70.8 |
Average dew point °F (°C) | 41.4 (5.2) | 44.4 (6.9) | 46.6 (8.1) | 49.1 (9.5) | 52.7 (11.5) | 56.5 (13.6) | 60.1 (15.6) | 61.2 (16.2) | 59.2 (15.1) | 54.1 (12.3) | 46.8 (8.2) | 41.4 (5.2) | 51.1 (10.6) |
Source: NOAA (relative humidity and dew point 1961–1990) [27] [31] [32] [33] |
Climate data for Sacramento, California (Sacramento Executive Airport), 1991–2020 normals, extremes 1941–present [lower-alpha 3] | |||||||||||||
---|---|---|---|---|---|---|---|---|---|---|---|---|---|
Month | Jan | Feb | Mar | Apr | May | Jun | Jul | Aug | Sep | Oct | Nov | Dec | Year |
Record high °F (°C) | 76 (24) | 78 (26) | 88 (31) | 95 (35) | 105 (41) | 115 (46) | 114 (46) | 112 (44) | 114 (46) | 104 (40) | 87 (31) | 74 (23) | 115 (46) |
Mean maximum °F (°C) | 65.2 (18.4) | 71.1 (21.7) | 78.1 (25.6) | 87.4 (30.8) | 95.3 (35.2) | 103.1 (39.5) | 105.3 (40.7) | 104.1 (40.1) | 100.6 (38.1) | 91.8 (33.2) | 76.5 (24.7) | 65.1 (18.4) | 107.0 (41.7) |
Average high °F (°C) | 56.0 (13.3) | 61.3 (16.3) | 66.3 (19.1) | 72.1 (22.3) | 80.3 (26.8) | 87.9 (31.1) | 92.6 (33.7) | 91.9 (33.3) | 88.5 (31.4) | 78.8 (26.0) | 65.0 (18.3) | 56.0 (13.3) | 74.7 (23.7) |
Daily mean °F (°C) | 47.6 (8.7) | 51.4 (10.8) | 55.4 (13.0) | 59.5 (15.3) | 66.1 (18.9) | 72.2 (22.3) | 75.9 (24.4) | 75.3 (24.1) | 72.5 (22.5) | 64.5 (18.1) | 53.9 (12.2) | 47.3 (8.5) | 61.8 (16.6) |
Average low °F (°C) | 39.2 (4.0) | 41.5 (5.3) | 44.5 (6.9) | 47.0 (8.3) | 52.0 (11.1) | 56.5 (13.6) | 59.2 (15.1) | 58.8 (14.9) | 56.5 (13.6) | 50.3 (10.2) | 42.7 (5.9) | 38.5 (3.6) | 48.9 (9.4) |
Mean minimum °F (°C) | 29.1 (−1.6) | 31.7 (−0.2) | 35.1 (1.7) | 37.9 (3.3) | 44.1 (6.7) | 49.5 (9.7) | 54.1 (12.3) | 53.8 (12.1) | 49.6 (9.8) | 41.7 (5.4) | 32.7 (0.4) | 28.7 (−1.8) | 26.9 (−2.8) |
Record low °F (°C) | 20 (−7) | 23 (−5) | 26 (−3) | 31 (−1) | 34 (1) | 41 (5) | 48 (9) | 48 (9) | 42 (6) | 35 (2) | 26 (−3) | 18 (−8) | 18 (−8) |
Average precipitation inches (mm) | 3.66 (93) | 3.49 (89) | 2.68 (68) | 1.26 (32) | 0.75 (19) | 0.23 (5.8) | trace | 0.04 (1.0) | 0.09 (2.3) | 0.85 (22) | 1.66 (42) | 3.43 (87) | 18.14 (461) |
Average precipitation days (≥ 0.01 in) | 10.0 | 9.1 | 9.0 | 5.1 | 3.6 | 1.1 | 0.1 | 0.2 | 0.7 | 3.1 | 6.1 | 9.6 | 57.7 |
Average relative humidity (%) | 83.3 | 76.8 | 71.6 | 64.5 | 58.9 | 55.0 | 53.2 | 55.7 | 57.0 | 63.1 | 75.6 | 82.9 | 66.5 |
Average dew point °F (°C) | 39.4 (4.1) | 42.1 (5.6) | 42.8 (6.0) | 43.7 (6.5) | 46.9 (8.3) | 50.4 (10.2) | 53.1 (11.7) | 53.4 (11.9) | 50.9 (10.5) | 47.5 (8.6) | 43.7 (6.5) | 39.2 (4.0) | 46.1 (7.8) |
Mean monthly sunshine hours | 145.5 | 201.3 | 278.0 | 329.6 | 406.3 | 419.5 | 440.2 | 406.9 | 347.8 | 296.7 | 194.9 | 141.1 | 3,607.8 |
Percent possible sunshine | 48 | 67 | 75 | 83 | 92 | 94 | 98 | 96 | 93 | 86 | 64 | 48 | 81 |
Source: NOAA (relative humidity, dew point and sun 1961–1990) [35] [36] [37] |
Climate data for Sacramento 5 ESE, California (Sacramento State [38] ), 1991–2020 normals, extremes 1877–present | |||||||||||||
---|---|---|---|---|---|---|---|---|---|---|---|---|---|
Month | Jan | Feb | Mar | Apr | May | Jun | Jul | Aug | Sep | Oct | Nov | Dec | Year |
Record high °F (°C) | 79 (26) | 80 (27) | 90 (32) | 98 (37) | 107 (42) | 112 (44) | 114 (46) | 112 (44) | 116 (47) | 102 (39) | 86 (30) | 72 (22) | 116 (47) |
Mean maximum °F (°C) | 66.4 (19.1) | 72.5 (22.5) | 80.6 (27.0) | 89.5 (31.9) | 97.1 (36.2) | 104.4 (40.2) | 106.7 (41.5) | 105.5 (40.8) | 102.0 (38.9) | 92.3 (33.5) | 77.3 (25.2) | 65.9 (18.8) | 108.1 (42.3) |
Average high °F (°C) | 56.5 (13.6) | 62.2 (16.8) | 67.8 (19.9) | 73.5 (23.1) | 81.3 (27.4) | 89.0 (31.7) | 94.4 (34.7) | 93.5 (34.2) | 89.3 (31.8) | 78.9 (26.1) | 65.3 (18.5) | 56.4 (13.6) | 75.7 (24.3) |
Daily mean °F (°C) | 48.8 (9.3) | 52.9 (11.6) | 57.2 (14.0) | 61.4 (16.3) | 67.7 (19.8) | 73.9 (23.3) | 77.9 (25.5) | 77.3 (25.2) | 74.0 (23.3) | 65.9 (18.8) | 55.3 (12.9) | 48.5 (9.2) | 63.4 (17.4) |
Average low °F (°C) | 41.1 (5.1) | 43.7 (6.5) | 46.7 (8.2) | 49.3 (9.6) | 54.0 (12.2) | 58.7 (14.8) | 61.4 (16.3) | 61.0 (16.1) | 58.8 (14.9) | 52.9 (11.6) | 45.3 (7.4) | 40.7 (4.8) | 51.1 (10.6) |
Mean minimum °F (°C) | 32.5 (0.3) | 35.4 (1.9) | 38.8 (3.8) | 41.6 (5.3) | 47.2 (8.4) | 51.9 (11.1) | 55.9 (13.3) | 55.9 (13.3) | 52.4 (11.3) | 45.1 (7.3) | 36.2 (2.3) | 31.9 (−0.1) | 30.5 (−0.8) |
Record low °F (°C) | 19 (−7) | 21 (−6) | 29 (−2) | 34 (1) | 37 (3) | 43 (6) | 47 (8) | 48 (9) | 44 (7) | 34 (1) | 27 (−3) | 17 (−8) | 17 (−8) |
Average precipitation inches (mm) | 3.87 (98) | 3.63 (92) | 2.82 (72) | 1.44 (37) | 0.86 (22) | 0.21 (5.3) | trace | 0.02 (0.51) | 0.15 (3.8) | 0.93 (24) | 1.78 (45) | 3.49 (89) | 19.20 (488) |
Average precipitation days (≥ 0.01 in) | 10.8 | 9.6 | 9.2 | 5.3 | 3.7 | 1.2 | 0.1 | 0.2 | 0.8 | 3.1 | 6.8 | 10.1 | 60.9 |
Source: NOAA [35] [39] [40] , Western Regional Climate Center [41] |
Month | Jan | Feb | Mar | Apr | May | Jun | Jul | Aug | Sep | Oct | Nov | Dec | Year |
---|---|---|---|---|---|---|---|---|---|---|---|---|---|
Record high °F (°C) | 79 (26) | 81 (27) | 87 (31) | 94 (34) | 97 (36) | 103 (39) | 98 (37) | 98 (37) | 106 (41) | 102 (39) | 86 (30) | 76 (24) | 106 (41) |
Mean maximum °F (°C) | 67.1 (19.5) | 71.8 (22.1) | 76.4 (24.7) | 80.7 (27.1) | 81.4 (27.4) | 84.6 (29.2) | 80.5 (26.9) | 83.4 (28.6) | 90.8 (32.7) | 87.9 (31.1) | 75.8 (24.3) | 66.4 (19.1) | 94.0 (34.4) |
Average high °F (°C) | 57.8 (14.3) | 60.4 (15.8) | 62.1 (16.7) | 63.0 (17.2) | 64.1 (17.8) | 66.5 (19.2) | 66.3 (19.1) | 67.9 (19.9) | 70.2 (21.2) | 69.8 (21.0) | 63.7 (17.6) | 57.9 (14.4) | 64.1 (17.8) |
Daily mean °F (°C) | 52.2 (11.2) | 54.2 (12.3) | 55.5 (13.1) | 56.4 (13.6) | 57.8 (14.3) | 59.7 (15.4) | 60.3 (15.7) | 61.7 (16.5) | 62.9 (17.2) | 62.1 (16.7) | 57.2 (14.0) | 52.5 (11.4) | 57.7 (14.3) |
Average low °F (°C) | 46.6 (8.1) | 47.9 (8.8) | 48.9 (9.4) | 49.7 (9.8) | 51.4 (10.8) | 53.0 (11.7) | 54.4 (12.4) | 55.5 (13.1) | 55.6 (13.1) | 54.4 (12.4) | 50.7 (10.4) | 47.0 (8.3) | 51.3 (10.7) |
Mean minimum °F (°C) | 40.5 (4.7) | 42.0 (5.6) | 43.7 (6.5) | 45.0 (7.2) | 48.0 (8.9) | 50.1 (10.1) | 51.6 (10.9) | 52.9 (11.6) | 52.0 (11.1) | 49.9 (9.9) | 44.9 (7.2) | 40.7 (4.8) | 38.8 (3.8) |
Record low °F (°C) | 29 (−2) | 31 (−1) | 33 (1) | 40 (4) | 42 (6) | 46 (8) | 47 (8) | 46 (8) | 47 (8) | 43 (6) | 38 (3) | 27 (−3) | 27 (−3) |
Average precipitation inches (mm) | 4.40 (112) | 4.37 (111) | 3.15 (80) | 1.60 (41) | 0.70 (18) | 0.20 (5.1) | 0.01 (0.25) | 0.06 (1.5) | 0.10 (2.5) | 0.94 (24) | 2.60 (66) | 4.76 (121) | 22.89 (581) |
Average precipitation days (≥ 0.01 in) | 11.2 | 10.8 | 10.8 | 6.8 | 4.0 | 1.6 | 0.7 | 1.1 | 1.2 | 3.5 | 7.9 | 11.6 | 71.2 |
Average relative humidity (%) | 80 | 77 | 75 | 72 | 72 | 71 | 75 | 75 | 73 | 71 | 75 | 78 | 75 |
Mean monthly sunshine hours | 185.9 | 207.7 | 269.1 | 309.3 | 325.1 | 311.4 | 313.3 | 287.4 | 271.4 | 247.1 | 173.4 | 160.6 | 3,061.7 |
Percent possible sunshine | 61 | 69 | 73 | 78 | 74 | 70 | 70 | 68 | 73 | 71 | 57 | 54 | 69 |
Average ultraviolet index | 2 | 3 | 5 | 7 | 9 | 10 | 10 | 9 | 7 | 5 | 3 | 2 | 6 |
Source 1: NOAA (sun 1961–1974) [42] [43] [44] [45] | |||||||||||||
Source 2: Met Office (humidity) [46] , Weather Atlas (UV) [47] |
Month | Jan | Feb | Mar | Apr | May | Jun | Jul | Aug | Sep | Oct | Nov | Dec | Year |
---|---|---|---|---|---|---|---|---|---|---|---|---|---|
Record high °F (°C) | 88 (31) | 91 (33) | 99 (37) | 98 (37) | 98 (37) | 101 (38) | 100 (38) | 98 (37) | 111 (44) | 107 (42) | 100 (38) | 88 (31) | 111 (44) |
Mean maximum °F (°C) | 78.8 (26.0) | 78.6 (25.9) | 80.2 (26.8) | 82.1 (27.8) | 79.3 (26.3) | 79.6 (26.4) | 82.9 (28.3) | 85.2 (29.6) | 90.6 (32.6) | 87.8 (31.0) | 85.4 (29.7) | 77.0 (25.0) | 94.0 (34.4) |
Average high °F (°C) | 66.4 (19.1) | 66.2 (19.0) | 67.0 (19.4) | 68.8 (20.4) | 69.5 (20.8) | 71.7 (22.1) | 75.3 (24.1) | 77.3 (25.2) | 77.2 (25.1) | 74.6 (23.7) | 70.7 (21.5) | 66.0 (18.9) | 70.9 (21.6) |
Daily mean °F (°C) | 58.4 (14.7) | 59.0 (15.0) | 60.7 (15.9) | 62.9 (17.2) | 64.8 (18.2) | 67.2 (19.6) | 70.7 (21.5) | 72.4 (22.4) | 71.7 (22.1) | 68.1 (20.1) | 62.7 (17.1) | 57.9 (14.4) | 64.7 (18.2) |
Average low °F (°C) | 50.3 (10.2) | 51.8 (11.0) | 54.5 (12.5) | 57.1 (13.9) | 60.0 (15.6) | 62.6 (17.0) | 66.1 (18.9) | 67.5 (19.7) | 66.2 (19.0) | 61.5 (16.4) | 54.8 (12.7) | 49.8 (9.9) | 58.5 (14.7) |
Mean minimum °F (°C) | 43.7 (6.5) | 46.1 (7.8) | 48.7 (9.3) | 51.9 (11.1) | 55.8 (13.2) | 59.3 (15.2) | 63.0 (17.2) | 63.9 (17.7) | 61.8 (16.6) | 55.5 (13.1) | 48.2 (9.0) | 43.0 (6.1) | 42.6 (5.9) |
Record low °F (°C) | 25 (−4) | 34 (1) | 36 (2) | 39 (4) | 45 (7) | 50 (10) | 54 (12) | 54 (12) | 50 (10) | 43 (6) | 36 (2) | 32 (0) | 25 (−4) |
Average rainfall inches (mm) | 1.98 (50) | 2.20 (56) | 1.46 (37) | 0.65 (17) | 0.28 (7.1) | 0.05 (1.3) | 0.08 (2.0) | 0.01 (0.25) | 0.12 (3.0) | 0.50 (13) | 0.79 (20) | 1.67 (42) | 9.79 (249) |
Average rainy days (≥ 0.01 in) | 6.5 | 7.1 | 6.2 | 3.8 | 2.2 | 0.7 | 0.7 | 0.3 | 0.9 | 2.4 | 3.7 | 5.8 | 40.3 |
Average relative humidity (%) | 63.1 | 65.7 | 67.3 | 67.0 | 70.6 | 74.0 | 74.6 | 74.1 | 72.7 | 69.4 | 66.3 | 63.7 | 69.0 |
Average dew point °F (°C) | 42.8 (6.0) | 45.3 (7.4) | 47.3 (8.5) | 49.5 (9.7) | 53.1 (11.7) | 57.0 (13.9) | 61.2 (16.2) | 62.4 (16.9) | 60.6 (15.9) | 55.6 (13.1) | 48.6 (9.2) | 43.2 (6.2) | 52.2 (11.2) |
Mean monthly sunshine hours | 239.3 | 227.4 | 261.0 | 276.2 | 250.5 | 242.4 | 304.7 | 295.0 | 253.3 | 243.4 | 230.1 | 231.3 | 3,054.6 |
Percent possible sunshine | 75 | 74 | 70 | 71 | 58 | 57 | 70 | 71 | 68 | 69 | 73 | 74 | 69 |
Source: NOAA (sun, relative humidity, and dew point 1961–1990) [49] [50] [51] |
The prevailing westerly winds from the oceans also bring moisture, and the northern parts of the state generally receive higher annual rainfall amounts than the south. California's mountain ranges influence the climate as well: moisture-laden air from the west cools as it ascends the mountains, dropping moisture; some of the rainiest parts of the state are west-facing mountain slopes. Northwestern California has a temperate climate with rainfall of 15 inches (380 mm) to 50 inches (1,300 mm) per year. Some areas of Coast Redwood forest receive over 100 inches (2,500 mm) of precipitation per year.
The Central Valley has a wide range of precipitation. The northern parts of the Central Valley receive substantially greater precipitation from winter storms which sweep down from the Pacific Northwest, while the southernmost regions of the Central Valley are near desert-like because of a lack of precipitation. Parts of the Valley are occasionally filled with thick fog (known locally as "tule fog").
The high mountains, including the Sierra Nevada, the Cascade Range, and the Klamath Mountains, have a mountain climate with snow in winter and mild to moderate heat in summer. Ski resorts at Lake Tahoe, Mammoth Lakes, and Mount Shasta routinely receive over 10 feet (3.0 m) of snow in a season, and some years, substantially more – leading, for example, to annual ski races on the Fourth of July.
On the east side of the mountains is a drier rain shadow. California's desert climate regions lie east of the high Sierra Nevada and southern California's Transverse Ranges and Peninsular Ranges. The low deserts east of the southern California mountains, including the Imperial and Coachella valleys and the lower Colorado River, are part of the Sonoran Desert, with minimal frost in the winter; the higher elevation deserts of eastern California, including the Mojave Desert, Owens Valley, and the Modoc Plateau, are part of the Great Basin region, which has a more continental climate. During the summer months, especially from July through early September, the region is affected by the Mexican Monsoon (also called the "southwest monsoon"), which drives moisture from the tropical Pacific, Gulf of California, and/or Gulf of Mexico into the deserts, setting off brief, but often torrential thunderstorms, particularly over mountainous terrain.
Despite its long coastline, California is not vulnerable to tropical cyclones. Because of the cold California Current from the North Pacific Ocean and the fact that the storms tend to "steer" west, California has only been hit with two tropical storms in recorded history, a storm which came ashore in 1939 and dumped heavy rainfall on the Los Angeles area and interior deserts. The remnants of tropical systems will affect California more commonly, every several years.
The ENSO cycle has a huge effect on rainfall and snowfall patterns in California, especially during the winter and spring seasons. During the El Niño phase, the jet stream is located south through California, allowing for warmer temperatures and more heavy rains to occur, particularly in the southern portions of the state. During the La Niña phase, the jet stream is much further north, and therefore the far northern portions of California are wetter, while the southern half stays cool and dry.
Summers in inland California can see temperatures well over 100 °F (38 °C) during the day and less than 0.3 in (7.6 mm) of monthly rainfall, particularly in the southern areas. This makes them prone to wildfires. These can be life-threatening and cause evacuation. Wildfires are less common along the coast because of the cooler, more humid summers, but can occur in autumn when the marine layer is less common, making temperatures warmer and humidity drop significantly.
The following are terms used to describe local or regional weather events.
The 'Central Valley is a broad, elongated, flat valley that dominates the interior of California. It is 40–60 mi (60–100 km) wide and runs approximately 450 mi (720 km) from north-northwest to south-southeast, inland from and parallel to the Pacific coast of the state. It covers approximately 18,000 sq mi (47,000 km2), about 11% of California's land area. The valley is bounded by the Coast Ranges to the west and the Sierra Nevada to the east.
Missouri generally has a variety of seasonal humid subtropical climate, with cool winters and long, hot summers. In the southern part of the state, particularly in the Bootheel, the climate borders on a more mild-type humid subtropical climate, and in the northern third, the state transitions into a humid continental climate. Because of its location in the interior United States, Missouri often experiences extremes in temperatures. Lacking either large mountains or oceans nearby to moderate its temperature, its climate is alternately influenced by air from the cold Arctic and the hot and humid Gulf of Mexico.
The Sacramento Valley is the area of the Central Valley of the U.S. state of California that lies north of the Sacramento–San Joaquin River Delta and is drained by the Sacramento River. It encompasses all or parts of ten Northern California counties. Although many areas of the Sacramento Valley are rural, it contains several urban areas, including the state capital, Sacramento. Since 2010, statewide droughts in California have further strained both the Sacramento Valley's and the Sacramento metropolitan region's water security.
June Gloom is a California term for a weather pattern that results in cloudy, overcast skies with cool temperatures during the late spring and early summer. While it is most common in the month of June, it can occur in surrounding months, giving rise to other colloquialisms, such as "May Gray", "No-Sky July", and "Fogust". Low-altitude stratus clouds form over the cool water of the California Current, and spread overnight into the coastal regions of California.
The climate of Virginia, a state on the east coast of the United States, is considered mild compared to more northern areas of the United States such as New England and the Midwest. Most of Virginia east of the Blue Ridge mountains, the southern part of the Shenandoah Valley, and the Roanoke Valley, has a humid subtropical climate. In the mountainous areas west of the Blue Ridge, the climate is warm-summer humid continental or oceanic climate. Severe weather, in the form of tornadoes, tropical cyclones, and winter storms, impacts the state on a regular basis. Central Virginia received significant snowfall of 20 inches in December 2009.
The climate of San Diego, California is classified as a Mediterranean climate. The basic climate features hot, sunny, and dry summers, and cooler, wetter winters. However, San Diego is much more arid than typical Mediterranean climates, and winters are still dry compared with most other zones with this type of climate.
The Climate of Grand Forks, North Dakota is a warm summer continental typical of cities located in the Great Plains, with four very distinct seasons and great variation in temperatures over very short periods of time. The city's climate is characterized by long, cold winters with moderate snowfall and warm summers which are typically humid.
North Dakota's climate is typical of a continental climate with cold winters and warm-hot summers. The state's location in the Upper Midwest allows it to experience some of the widest variety of weather in the United States, and each of the four seasons has its own distinct characteristics. The eastern half of the state has a humid continental climate with warm to hot, somewhat humid summers and cold, windy winters, while the western half has a semi-arid climate with less precipitation and less humidity but similar temperature profiles. The areas east of the Missouri River get slightly colder winters, while those west of the stream get higher summer daytime temperatures. In general, the diurnal temperature difference is prone to be more significant in the west due to higher elevation and less humidity.
The climate of Pennsylvania is diverse due to the multitude of geographic features found within the state. Straddling two major climate zones, the southeastern corner of Pennsylvania has the warmest climate. A portion of Greater Philadelphia lies at the southernmost tip of the humid continental climate zone, with the city proper being in the humid subtropical climate zone. Still, Philadelphia features colder, snowier winters than most locations with a humid subtropical climate. Moving west toward the mountainous interior of the state, the climate becomes markedly colder, the number of cloudy days increases, and winter snowfall amounts are greater.
The landlocked U.S. state of Nevada has a varied geography and is almost entirely within the Basin and Range Province and is broken up by many north–south mountain ranges. Most of these ranges have endorheic valleys between them.
The U.S. state of Idaho borders six other U.S. states and one Canadian province. The states of Washington and Oregon are to the west, Nevada and Utah are to the south, and Montana and Wyoming are to the east. Idaho also shares a short border with the Canadian province of British Columbia to the north.
The U.S. state of Kansas is bordered by Nebraska to the north; Missouri to the east; Oklahoma to the south; and Colorado to the west. The state is divided into 105 counties with 628 cities, with its largest county by area being Butler County. Kansas is located equidistant from the Pacific and Atlantic oceans. The geographic center of the 48 contiguous states is in Smith County near Lebanon. Until 1989, the Meades Ranch Triangulation Station in Osborne County was the geodetic center of North America: the central reference point for all maps of North America. The geographic center of Kansas is in Barton County.
The climate of New York (state) is generally humid continental, while the extreme southeastern portion of the state lies in the warmer humid subtropical climate zone. Winter temperatures average below freezing during January and February in much of the state of New York, but several degrees above freezing along the Atlantic coastline, including New York City.
The climate of Massachusetts is mainly a humid continental climate, with hot, humid summers and cold, snowy winters and abundant precipitation. Massachusetts is a state located in the New England region of the northeastern United States. Most of its population of 7.0 million live in the Boston metropolitan area. The eastern half of this relatively small state is mostly urban and suburban. Massachusetts is the most populous of the six New England states and ranks third in the nation by population density and fourth by GDP per capita. Massachusetts receives about 43 inches or 1,090 millimetres of rain annually, fairly evenly distributed throughout the year, slightly wetter during the winter. Summers are warm with average high temperatures in July above 80 °F or 26.7 °C and overnight lows above 60 °F or 15.6 °C common throughout the state. Winters are cold, but generally less extreme on the coast with high temperatures in the winter averaging above freezing even in January, although areas further inland are much colder. The state does have extreme temperatures from time to time with 100 °F or 37.8 °C in the summer and temperatures below 0 °F or −17.8 °C in the winter not being unusual.
The climate of Los Angeles is mild to hot year-round, and mostly dry. It is classified as a Mediterranean climate, which is a type of dry subtropical climate. It is characterized by seasonal changes in rainfall—with a dry summer and a winter rainy season. Under the modified Köppen climate classification, the coastal areas are classified as Csb, and the inland areas as Csa.
Scott Lake is a lake in Thurston County, Washington, United States. It is located 3.2 miles (5.1 km) south of the Tumwater city limits, 8.4 miles (13.5 km) south of the Olympia city limits, and 14.1 miles (22.7 km) north of the Centralia city limits. The location for Scott Lake is in Sections 33 and 34, Township 17N, Range 2W, Willamette Meridian.
Washington is the northwesternmost state of the contiguous United States. It borders Idaho to the east, bounded mostly by the meridian running north from the confluence of the Snake River and Clearwater River, except for the southernmost section where the border follows the Snake River. Oregon is to the south, with the Columbia River forming the western part and the 46th parallel forming the eastern part of the Oregon–Washington border. During Washington's partition from Oregon, the original plan for the border followed the Columbia River east until the confluence with the Snake, and then would have followed the Snake River east; this was changed to keep Walla Walla's fertile farmland in Washington.
The climate of New England varies greatly across its 500-mile (800 km) span from northern Maine to southern Connecticut.
The National Centers for Environmental Information (NCEI), an agency of the United States government, manages one of the world's largest archives of atmospheric, coastal, geophysical, and oceanic data, containing information that ranges from the surface of the sun to Earth's core, and from ancient tree ring and ice core records to near-real-time satellite images.