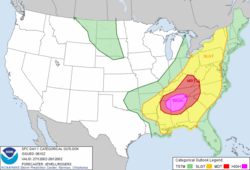
Progression of a well-anticipated high risk event across the Central Plains on April 14, 2012. This event ultimately produced 85tornadoes that day, one of which killed six people.
A high risk severe weather event is the greatest threat level issued by the Storm Prediction Center (SPC) for convective weather events in the United States. On the scale from one to five, a high risk is a level five. A high risk is usually for major tornado outbreaks with numerous strong to violent tornadoes expected, and occasionally derechos with widespread destructive wind gusts, and these outlooks are typically reserved for the most extreme events.[1] They are generally only issued on the day of the event. However, there have been three occurrences (April 7, 2006, April 14, 2012, and March 15, 2025) of a high risk being issued for Day 2 of the outlook period (with the event occurring the following day). Under the official protocol, a high risk cannot be issued for Day 3 of the outlook period.[2]
1984 Carolinas tornado outbreak – Twenty-four tornadoes were confirmed; seven were rated F4. In addition to the 57 tornadic deaths, 1,249people were injured. This was and remained the deadliest official high risk day (since SELS/SPC high risk outlooks began) for over 27 years, surpassed by the Super Outbreak of April 27, 2011.[10]
Severe weather outbreak did not consolidate due to a lack of moisture and instability anticipated to develop.[69] Seven tornadoes were confirmed; one was rated F3.[95]
Thunderstorm complex early in the day prevented significant moisture from moving into the region and ultimately limited severe weather activity.[98] Thirteen tornadoes were confirmed; two were rated F2.[99]
Only high risk ever issued in September. Squall line with damaging winds and some large hail.[111] Four weak tornadoes were confirmed; one was rated F1.[112]
Major derecho event.[117] The Lynchburg, Virginia area was hit the hardest. The city had a wind gust to 80mph, with significant damage reported. Power was cut to 95% of the city.[118] Thirteen tornadoes were confirmed; six were rated F1.[119] Only the 1900 UTC outlook had a high risk.
Only high risk ever issued in August.[citation needed] Twelve tornadoes were confirmed; two were rated F3.[136] The same system also produced an F4 in Turtle Mountain, Manitoba in Canada.
Moderate tornado outbreak reorganized into a progressive derecho.[citation needed] Twenty tornadoes were confirmed; one was rated F3. High risk was discontinued at 02Z.[152]
Late-May 1998 tornado outbreak and derecho – Only high risk ever issued in the Northeast (although it was discontinued and reduced to moderate risk at 1930Z, following a morning remnant derecho but prior to/concurrent with occurrence of afternoon into overnight severe weather outbreak).[165] Forty-two tornadoes were confirmed; six were rated F3.[166]
High risk was issued 15Z and discontinued 02Z. Followed by a progressive derecho.[citation needed] Twenty-two tornadoes were confirmed; six were rated F1.[167]
Tornado outbreak of April 8–9, 1999 – High risk was maintained through the day. Fifty-four tornadoes were confirmed; three were rated F4. Some occurred overnight, outside the 01Z high risk area.
1999 Oklahoma tornado outbreak – High risk was issued at 20Z and maintained thereafter. Highest winds ever recorded in a tornado, 301mph (484km/h);[172] seventy-three tornadoes were confirmed, including three F4s and the Bridge Creek-Moore F5.
1999 Oklahoma tornado outbreak – High risk was issued 13Z and discontinued 01Z. Only streak of three consecutive High risk days as of March 2025. Major derecho event.[citation needed]
High risk was maintained throughout the day; however, event failed to consolidate with only isolated tornadoes and scattered severe wind reported. A shortwaveridge maintained a capping inversion.[174]
2000–2009
There were no high risk days in 2000. Thirty-eight high risks were issued in the 2000s.
Storm Prediction Center High Risk Events – 2000–2009[nb 1][nb 2]
Tornadoes of 2001#April 6–7 – The high risk was issued at 0600Z and discontinued at 0100Z. A serial derecho formed, producing widespread wind damage. 162 damaging wind gusts were reported, including 12 hurricane force.[176] One person was killed by lightning in Ohio. Six tornadoes were also confirmed; two were rated F2.[177]
Tornado outbreak of April 10–11, 2001 – The High risk was issued at 1630Z and discontinued at 0100Z. Three people were killed by tornadoes. The event also featured the costly Tri-State hailstorm on the prior day. Thirty-three tornadoes were confirmed; one was rated F3.[179]
Tornadoes of 2001#June 11–13 – The high risk was issued at 2000Z and maintained at 0100Z. A progressive derecho produced widespread wind damage, including a measured thunderstorm wind gust of 120 miles per hour (193km/h) near Atwater, Minnesota. 194 damaging wind gusts were reported, including 5 hurricane force.[181] Twenty-nine tornadoes were also confirmed; one was rated F2. However, some of the tornadoes were associated with landfalling Tropical Storm Allison, not the system that triggered the high risk. One of the tornadoes in Florida killed one person.[182]
The high risk was issued for only the 2000Z update. Thirty-two tornadoes were confirmed; one was rated F3. One person was killed by straight-line winds in Illinois.[184]
Tornadoes of 2001#October 24 – The high risk was maintained throughout the entire day (smaller at 0100Z ahead of the most intense storms over Ohio at that time). A significant tornado event was concentrated mostly in northern portions of the high risk area, with nearly the entire high risk area also experiencing a major serial derecho. One person was killed by straight-line winds in Michigan while another person was also killed in Tennessee. Twenty-five tornadoes were confirmed; two were rated F3.[186] Over 446 damaging wind gusts were reported across 18 states, including 2 hurricane force.[187]
This was the last time a High Risk was issued by SPC with no surrounding "Moderate Risk" area. The high risk was issued at 0600Z update; it was removed at 2000Z outlook update due to concern over the extent of how favorable conditions would be for severe weather. However, the initiation of the most intense severe weather occurred after that time. Fourteen tornadoes, with one being rated F3, were confirmed, but were all in Texas and Oklahoma, well outside the high risk. However, widespread hail damage occurred and one person was killed by straight-line winds in Kansas.[189]
Only the 0600Z outlook included a high risk, which was for a significant wind event instead of tornadoes. This is the only day in which a High Risk was issued in only the initial Day 1 outlook, and the second consecutive high risk issuance to be downgraded to a moderate risk before the expected onset of the highest severe weather potential; such a downgrade remains rare as of 2025. It is also the most recent use of a high risk during the July through September period (typically a mid and late summer into very early fall minimum for such outlooks). No fatalities took place.[191] Three weak tornadoes were confirmed. Most severe weather was damaging wind reports.[192]
Tornado outbreak of November 9–11, 2002 – This was the second and most intense day of a late fall tornado outbreak. The high risk was maintained throughout the entire day and is the only time since 1990 in which a fall high risk was issued in back to back years (see October 24, 2001). The issuance of a high risk at the initial 06Z Day 1 Outlook notably followed a Day 2 Outlook for the same period that did not contain a moderate risk area, as both Day 2 outlooks issued the day before included only an enhanced slight risk. This is the last time as of 2025 that a High Risk outlook was issued for a 12Z-12Z convective period without at least one prior Moderate Risk outlook valid for the same period. The main high risk area featured numerous tornadoes, including a pair of long-tracked F-3s. However, the strongest tornado, rated F-4, occurred in a separate, significant outbreak over Ohio, outside the high hisk. The 01z outlook extended the moderate and high risk zones north into this area, but few tornadoes would occur in this area beyond 01Z, while significant tornadoes continued past 01Z in southern portions of the high risk area. In total, sixty-one tornadoes were confirmed. Thirty-one people were killed during the outlook period.[194][195]
Tornadoes of 2002#December 23–24 – One of only two high risks ever issued in December and second latest in the year (first was December 24, 1982). The high risk was maintained throughout the entire day for both widespread wind damage and isolated strong tornadoes, but the day busted as a whole.[197] Fifteen tornadoes were confirmed; three were rated F1.[198]
May 2003 tornado outbreak sequence – Most prolific day of an at the time record setting tornado outbreak sequence. The high risk was issued at 13Z and subsequently maintained. Seventy-nine tornadoes were confirmed; four were rated F4.[202]
May 2003 tornado outbreak sequence – The high risk was issued at 1630Z and discontinued at 01Z. Twenty-eight tornadoes were confirmed; one was rated F3.[204]
May 2003 tornado outbreak sequence – The high risk was issued at 1630Z and expanded southward at 20Z, then fully discontinued at 01Z. Forty-five tornadoes were confirmed; one was rated F4 (occurring in the area not upgraded to a high risk until 20Z).[206]
May 2003 tornado outbreak sequence – The high risk was issued at 13Z and subsequently maintained. Forty-nine tornadoes were confirmed; three were rated F3.[208] Also included 35% tornado probability area, above the 25% (prior to 2006) minimum threshold for a high risk.
The high risk was issued at 1630Z and discontinued at 01Z. Reorganized into a large serial derecho.[citation needed] Twenty-five tornadoes were confirmed; two were rated F2.[212]
May 2004 tornado outbreak sequence/2004 Hallam tornado – Sixty-eight tornadoes were confirmed; one was rated F4. The F4 tornado was the largest tornado on record at the time with a peak width of 2.5 miles (4.0km) as it struck Hallam, Nebraska.[214] This is the first time a high risk did not appear until the 01Z outlook (which was prior to the Hallam tornado) within an outlook cycle, which has occurred one additional time since (on April 30, 2010).
May 2004 tornado outbreak sequence – The high risk lasted the entire Day 1 Outlook cycle. Also a major derecho event.[citation needed] Included a 45% sig risk for damaging winds, meeting high risk criteria for the time (prior to 2006). Fifty-four tornadoes were confirmed; two were rated F2.[216] 128 damaging wind gusts were reported, including 3 hurricane force.[217]
May 2004 tornado outbreak sequence – For the second consecutive May and the last occurrence as of March 2025, a fourth high risk day was issued in an eight-day period. The high risk lasted the entire Day 1 Outlook cycle. Eighty-six tornadoes were confirmed; two were rated F3.[221] Included 35% tornado risk area above the (at the time) minimum threshold of 25%.
Mid-November 2005 tornado outbreak – The high risk lasted the entire outlook cycle. Forty-nine tornadoes were confirmed; one was rated F4. This was the only violent tornado to be recorded in 2005. Two days later, portions of the High Risk area had below freezing high temperatures - the coldest conditions within two of any High Risk outlook since at least 1995.[227]
Tornado outbreak sequence of March 9–13, 2006 – The high risk lasted the entire outlook cycle. This was the first High Risk to use a 30% tornado probability, which became the minimum threshold in 2006 (25% and 35% contours were discontinued). Fifty-nine tornadoes were confirmed; one was rated F4. Most F2+ tornadoes were in Missouri, making it one of the state's strongest tornado outbreaks, and the strongest this early in the year.[229] One supercell storm tracked nearly 800 miles from Oklahoma to Michigan, producing many tornadoes along its path.
Tornado outbreak of April 6–8, 2006 – Only known high risk to include a 60% tornado contour, the highest level issued by the SPC.[233] It was also the first of only three known occurrences (the others being April 14, 2012 and March 15, 2025) in which a Day 2 high risk outlook was issued, and the high risk persisted for the entire Day 1 Outlook cycle. This aforementioned Day 2 high risk produced the first/only instance to date (as of 2025) where a high risk was simultaneously in effect for both Day 1 (see April 6, 2006 above) and Day 2, and a simultaneous occurrence of a Day 1 moderate risk and Day 2 high risk was not observed until March 14–15, 2025. Forty-seven tornadoes were confirmed; two were rated F3.[234]
April 2007 nor'easter – The high risk was issued at 20Z and subsequently maintained. However, only seven tornadoes were confirmed; one was rated EF1.[238]
Tornado outbreak sequence of April 20–27, 2007 – The high risk was issued at 20Z and subsequently maintained. Twenty-three tornadoes were confirmed; one was rated EF3, although this all occurred outside the high risk area, which saw virtually no activity. The supercell that produced the EF3 tornado also produced an F4 tornado in Mexico before crossing the international border.[240]
Tornado outbreak of May 4–6, 2007 – The high risk was issued at 13Z and subsequently maintained. Ninety tornadoes were confirmed; two were rated EF3. Notably, an EF5 tornado related to the same system (and the strongest tornado of the multi-day outbreak sequence) also occurred the day before, which was a moderate risk day.[242]
The high risk was issued at 06Z and discontinued at 01Z. Reorganized into a moderate wind event.[citation needed] Included a 60% sig risk for damaging winds for the 1200z outlook before being switched back to a 30% sig tornado risk in the 1300z outlook. This is the latest date in the spring severe weather season during the 20th century that a 30% tornado area has been issued. Twelve tornadoes were confirmed; one was rated EF3.[244] 135 damaging gusts were reported. However, the 3 hurricane-force wind gusts occurred in Missouri, outside the high risk.[245]
2008 Super Tuesday tornado outbreak – The high risk was issued at 13Z and subsequently maintained. Sixty-three tornadoes were confirmed; three were rated EF4.[247] One EF4 tornado in Arkansas tracked over 120 miles. One of only two high risks issued in January or February since January 21, 1999, continuing to present, with the other being January 22, 2017. This was the deadliest day at the time for tornadoes since May 31, 1985.
Tornado outbreak of May 22–27, 2008 – The high risk was issued at 20Z and subsequently maintained. Twenty-eight tornadoes were confirmed; one was rated EF3.[251]
Tornado outbreak sequence of June 3–11, 2008 – The high risk was issued at 13Z and subsequently maintained. Also included a 60% significant severe wind probability, which meets high risk standards (the High Risk area in the 01Z outlook was sustained by this wind risk, with a maximum 15% tornado probability in that outlook; and the 30% tornado area in prior outlooks was considerably smaller than the 60% wind area). Forty tornadoes were confirmed; three were rated EF2.[255] 261 damaging wind gusts were reported including 10 hurricane-force which were up to 100mph, though many occurred south of the high risk.[256]
Eleven tornadoes were confirmed; one was rated EF2.[260] The high risk was issued at 1630Z and, despite the maintenance of the high risk through the rest of the day, the outbreak busted as a whole.
†– Value is estimated
2010–2019
There were no high risk days in 2015, 2016, or 2018. This is the first decade to feature multiple years without a High Risk. 2018 was also the only year since 1950 to feature no violent (EF4+ tornadoes) nationwide. Twenty-three high risks were issued in the 2010s.
Storm Prediction Center High Risk Events – 2010–2019[nb 1]
Tornado outbreak of April 22–25, 2010 – A high risk was issued at 06Z issued for a 30% probability of significant tornadoes. There were 39 tornadoes confirmed; two were rated EF4. One of the EF4 tornado was the second (then-first) widest in Mississippi state history, and the fourth-longest tracked in the state. The strongest tornadoes were in/near the high risk area. The high risk was discontinued at 0100Z.
Tornado outbreak of April 30 – May 2, 2010 – A high risk was issued on the first day of the aforementioned outbreak for a 30% probability of significant tornadoes. For only the second known time a high risk was not issued until 0100 UTC (the other occurrence May 22, 2004). This is the last 01Z High Risk upgrade to date. The eventual high risk area was only in an enhanced slight risk prior to 20Z. This is the only day in which the entire area to eventually be in a high risk was not even in a moderate risk until 2000Z. There were 28 tornadoes confirmed; two were rated EF3.
Tornado outbreak of April 30 – May 2, 2010 – A high risk was issued at 13Z on the second day of the aforementioned outbreak for a 30% probability of significant tornadoes, and was subsequently maintained. Only 11 weak tornadoes were confirmed during the day, but several strong tornadoes, one of which was rated EF3, occurred overnight focused on the eastern portions of the high risk area and into the bordering moderate risk. A major flood disaster also occurred from the same storm.
Tornado outbreak of May 10–13, 2010 – A high risk lasted the entire outlook cycle on the first day of the aforementioned outbreak for a 30% probability of significant tornadoes. There were 70 tornadoes confirmed; two were rated EF4, both of which occurred around the west edge of the high risk in the southern suburbs of the Oklahoma City metropolitan area and were responsible for the three fatalities during the outbreak.
Tornadoes of 2010#May 18–21 – A high risk was issued at 1630Z on the second day of the aforementioned outbreak for a 30% probability of significant tornadoes. Overall, the event busted; only 13 weak tornadoes, seven of which were rated EF1, were confirmed in the area, although significant flooding occurred from the same storm system. The high risk was discontinued at 01Z.
October 2010 North American storm complex – This was a major derecho event.[citation needed] The high risk was issued at 06Z based on 60% significant severe wind probability, with a tornado probability of 15% falling short of high risk standards. There were 43 tornadoes confirmed; five were rated EF2. There were also 339 damaging wind reports including 7 hurricane-force gusts (many inside the high risk) up to 85mph (137km/h).[269] The high risk was discontinued at 2000Z as the squall line was most intense in the morning and early afternoon. The storm system (nicknamed "Octbomb") responsible for this severe weather outbreak also featured near-record nontropical low pressure over Minnesota.
Tornado outbreak of April 14–16, 2011 – A high risk was issued at 1630Z on the third day of the aforementioned outbreak (which had already produced a substantial tornado outbreak on the prior days) for a 30% probability of significant tornadoes. A total of 58 tornadoes were confirmed; six were rated EF3, two of which had path lengths of over 50 miles (80km) with the first striking Raleigh, North Carolina (albeit at EF1 strength). The high risk was discontinued at 0100Z as the storms had mostly moved off the East Coast.
2011 Super Outbreak – A high risk was issued at 13Z and subsequently maintained on the second day of the record-setting aforementioned outbreak for a 30% probability of significant tornadoes. In the 1630z outlook, the wind risk was also upgraded to 60%, which meets high risk criteria.[272] There were 55 tornado touch downs during the day; one was rated EF3. 390 damaging wind gusts were also reported, including 5 hurricane gusts. Despite the abundance of tornadoes and wind reports, most of the severe activity happened either along and south of the southern part of the high-risk area or well to the east in the slight risk area over Alabama. Additionally, on the previous day (April 25, the first day of this sequence), a moderate risk was in effect simultaneously for that day (the 25th), in anticipation for this day (the 26th; Day 2 outlook), and also in anticipation for the following day (April 27; Day 3 outlook; which turned into an extremely destructive and record setting high risk day - see below). This is the only known simultaneous occurrence of Day 1, 2, and 3 moderate risk outlooks.
2011 Super Outbreak – The high risk lasted the entire Day 1 Outlook cycle. This was day 3 of the record-setting aforementioned outbreak; this day alone set the record for most tornadoes in a 24-hour period. It was also the deadliest high risk day on record as well as the deadliest single day outbreak in the United States since the Tri-State tornado outbreak on March 18, 1925. The outlook included a 45% significant tornado area that was introduced at 1630Z (the first instance of a 45% tornado area being added prior to the 20Z outlook), which is above the minimum threshold for a high risk. It also produced the first known watch (PDS tornado watch 235) with a >95% probability for all severe and significant severe hazards.[274] The tornadoes came in three rounds starting with two damaging morning squall lines followed by an outbreak of large tornadic supercells. The strongest (violent EF4/EF5) tornadoes occurred in the high risk area (many in/near the 45% probability) associated with these large supercells, while dozens of other tornadoes were confirmed throughout the other risk areas. Three of the tornadoes tracked over 100 miles (160km), with one of them becoming the deadliest tornado ever recorded in Alabama. Several areas that had experienced tornadoes either from that morning or from other outbreaks earlier that year were struck again as well. One violent tornado struck both Tuscaloosa and Birmingham, Alabama, remaining on the ground in-between. There were 215 tornado touchdowns; four were rated EF5, the second most for a calendar day (the record is the Super Outbreak of April 3, 1974). An additional 11 EF4 tornadoes were also reported, and the total of 15 violent tornadoes (EF4+) was the third most on record, behind the 1974 Super Outbreak and the 1965 Palm Sunday outbreak (all of these numbers are the most of any day since 1982, when records of High Risk outlooks begin). An additional F0 tornado was confirmed in Canada.
Tornado outbreak sequence of May 21–26, 2011 – The high risk was issued at 06Z and discontinued at 01Z. This was day 4 of the aforementioned outbreak sequence and included a 45% significant tornado area introduced at 1630Z, above the minimum high-risk threshold. There were 47 tornado touchdowns; with the El Reno-Piedmont tornado (occurring within the high risk and 45% tornado area over Oklahoma) being rated an EF5. This EF5 occurred only two days after the devastating Joplin EF5 from the same overall storm sequence (however, a high risk outlook was not issued on May 22). Two of the three EF4 tornadoes that were confirmed that day may have also reached EF5 intensity. The high risk was discontinued at 0100Z. This is the last High Risk day as of August 2025 to produce an official EF5 tornado (however, an EF5 tornado did occur more recently in 2013 in Oklahoma on a Moderate Risk day).
Tornado outbreak sequence of May 21–26, 2011 – A high risk was issued at 13Z on the fifth day of the aforementioned outbreak sequence for a 30% probability of significant tornadoes. A total of 94 tornadoes were confirmed; two (both of which occurred inside of the high risk) were rated EF3; three of the tornadoes were in California, well to the west of the main risk area. The high-risk was discontinued at 0100Z.
Tornado outbreak of March 2–3, 2012 – A high risk was issued at 13Z on the first day of the aforementioned outbreak (but fourth day of a storm sequence that began February 28) for a 30% probability of significant tornadoes. A total of 64 tornadoes were confirmed; two were rated EF4, both of which were produced by the same supercell, which also produced an EF3 tornado, all within the high risk area. Another EF3 tornado tracked for over 80 miles (130km) through eastern Kentucky and southwestern West Virginia. The high risk was discontinued at 0100Z.
Tornado outbreak of April 13–16, 2012 – This was day 2 of aforementioned outbreak; it was the second of three high risks to be issued on Day 2 (the day before the event; first Day 2 high risk was for April 7, 2006, and the third was for March 15, 2025) and the first/only to date ever issued on the initial (0600Z) Day 2 outlook.[278] It included 45% tornado probability above minimum threshold of 30%. This was the only day to have a 45% tornado area in its 06Z Day 1 Outlook (although that 45% area was north of most of the tornadoes; by 20Z the 45% area had been shifted southward and covered the region that ultimately saw the most/densest tornado activity). A total of 83 tornadoes were confirmed; one was rated EF4. The high risk largely busted in most of Oklahoma (except far northern and western) as the brunt of outbreak was focused in Kansas. The high risk was maintained for the entire Day 1 cycle (in addition to both Day 2 outlooks) in the regions where most of the tornadoes including the strongest tornadoes occurred (the southern end of the high risk, which lacked storms due to capping until well into the night when a moderate squall line containing only a few embedded tornadoes developed along the cold front as it overtook the dryline, was trimmed back to a moderate risk at 01Z).
June 12–13, 2013 derecho series – This is the latest date of a 'spring season' high risk in the 21st century to date. The high risk was issued at 1630Z driven by 60% significant severe wind probability as the maximum tornado probability was a hatched 15% area, just short of the high risk level. (The latest spring season issuance of a 30% tornado area in the 21st century is June 7, 2007.) A total of 19 tornadoes were confirmed; one was rated EF3. 278 damaging wind gusts were reported, including 4 hurricane-force gusts, though most occurred over Ohio and were east of the high risk and near or after its 01Z discontinuation.[280] The high risk was discontinued at 01Z.
Tornado outbreak of November 17, 2013 – The high risk was initially issued at 06Z for a 30% probability of significant tornadoes. This was an unusually far north tornado outbreak and one of only five high risk days during the month of November in recorded history (three since 2000).[283] Many Midwest cities (including Chicago, South Bend, and Fort Wayne) outside the climatologically most frequent high risk locations experienced their second high risk day of 2013. It was the second latest date in the year a high risk has been issued since 2000 (the latest was December 23, 2002, in the Deep South), and latest date in a calendar year that a high risk has been issued in the Midwest (second latest is November 15, 2005). It also included a high risk level (60% significant severe) wind probability in the 2000Z outlook. In all, 77 tornadoes were confirmed largely in and near the high risk area; two were rated EF4, both occurring in the western portion of the high risk area. 579 wind reports were also recorded, including 19 hurricane-force.[284] The high risk was discontinued at 0100Z as the cold front and related storms had moved eastward into the bordering moderate area (which was maintained primarily for wind). This was the last High Risk issued during the fall severe weather season for over a decade (although incidents of significant fall/early winter season tornadoes have occurred more recently).
Tornado outbreak of April 27–30, 2014 – This was the first day of the aforementioned outbreak. A small high risk area was issued at the 2000Z outlook that included the cities of Little Rock, Camden, and Danville for a 30% probability of significant tornadoes. An EF4 tornado was confirmed in the risk area before the high risk was discontinued in a special outlook update at 0230Z. The outlook period as a whole produced 18 tornadoes.[286]
Tornado outbreak of April 27–30, 2014 – This was the second day of the aforementioned outbreak. A high risk was issued at the 2000Z outlook for a 30% probability of significant tornadoes. Numerous long-tracked and/or strong to violent tornadoes occurred across Mississippi, Alabama, and Tennessee. It was the largest tornado outbreak in central Alabama since April 27, 2011. A total of 57 tornadoes were confirmed during the outlook period; one was rated EF4. The strongest tornadoes were in or nearby to the high risk. This is the last occurrence of back to back high risk days for at least a decade (continuing as of early 2025; and three consecutive high risk days have not occurred in 25 years, since May 1999). The high risk was discontinued at 0100Z.[288]
Tornadoes of 2014#June 3–4 – The high risk was issued at 2000Z for 60% wind probability and potential derecho; tornado probability was 10%, well short of high risk level. Extreme hail/wind and some tornadoes were reported, although most of the activity remained along or south of the southern part of the high risk. Nine tornadoes were confirmed during the outlook period; one tornado was rated EF3. The high risk was discontinued at 0100Z.
Tornado outbreak of January 21–23, 2017 – An unusual January High Risk (the first since 1999) followed the longest known gap (over 30 months) between High Risk days. This was the second day of the aforementioned outbreak. The high risk was issued at 13Z for a 30% probability of significant tornadoes, primarily in northern Florida and southern Georgia.[291] This was also the first high risk issued under the five-category system (which began in October 2014), and also the furthest southeast (Florida panhandle) a high risk has been issued in the 21st century. There were 17 confirmed tornado touchdowns during the outlook period; one tornado, which was rated EF3, traveled over 70 miles (110km) and was over a 1 mile (1.6km) wide. There were six fatalities from tornadoes along with one non-tornadic death. The high risk was discontinued at 0100Z.
Tornadoes of 2017#April 2–3 – This was the first day of the aforementioned outbreak. The high risk was issued at 1630Z for a 30% probability of significant tornadoes. Although most of the tornadoes that touched down were relatively weak and short-lived, seven of them were more than 1⁄2mi (0.80km) wide, including one that reached a peak width of just over 1+1⁄4mi (2.0km) wide, and multiple tornado emergencies were issued. 30 tornadoes were confirmed during the outlook period; six of them were rated EF2. The high risk was discontinued at 0100Z.[293]
Tornadoes of 2017#April 4–6 – This was the second day of the aforementioned outbreak. The high risk was issued at 1630Z for a 30% probability of significant tornadoes. A total of 26 tornadoes were confirmed during the outlook period, four of which were rated EF2, although the tornadoes were mostly scattered throughout the various severe risk areas rather than being concentrated within the high risk area. One EF2 tornado in Georgia did prompt the issuance of a tornado emergency. The high risk was discontinued at around 0100Z.[295]
Tornado outbreak sequence of May 15–20, 2017 – This was day 4 of the outbreak sequence. The high risk was issued at 06Z for a 30% probability of significant tornadoes. A total of 58 tornadoes were confirmed during the outlook period, three of which were rated EF2. However, only weak, scattered tornadoes were reported in the high risk area, which saw a large area of heavy rain when the most favorable tornado parameters arrived; the strongest tornadoes occurred to the east of that area. The high risk was discontinued at 01Z.[297]
Tornado outbreak sequence of May 2019 – This was day 4 of the outbreak sequence. The high risk was initially issued at 06Z for a 30% probability of significant tornadoes; this risk area was subsequently expanded and upgraded to a 45% probability of significant tornadoes, exceeding the minimum high risk criteria at the 1630Z outlook. This high risk produced the second known tornado watch with a >95% chance of all hazards (PDS Tornado Watch 199).[299] The event did not quite live up to the high parameters that were in place for the day with sustained supercells failing to develop in the 45% risk, likely in part because of more persistent low cloud cover. However, 50 tornadoes were confirmed during the outlook period, many in/near the high risk area and one of which was rated EF3 (one of the tornadoes was also well outside of the risk area in Arizona). The high risk lasted for the entire outlook period, although the 01Z outlook had only a much smaller high risk area focusing on one lone supercell.[300]
†– Value is estimated *– Peak wind gust of 151mph (243km/h) measured during the EF5 El Reno tornado
2020–present
There were no high-risk days in 2020 or 2022. Six high risks have been issued so far in the 2020s.
Storm Prediction Center High Risk Events – 2020–2026[nb 1]
Tornado outbreak of March 16–18, 2021 – This was day 2 of the outbreak. The high risk, which lasted the entire Day 1 Outlook cycle, was initially issued for a 30%hatched area for tornadoes; this was upgraded to a 45%hatched area for tornadoes at 1606Z. A total of 40tornadoes were confirmed during the outlook period, four of which were rated EF2, although little tornado activity occurred within the 45% risk area.[302]
Tornado outbreak sequence of March 24–28, 2021 – This was day 2 of the outbreak sequence. The high risk was issued at 06Z for a 30%hatched area for tornadoes. A PDS tornado watch was issued, with a >95% chance for both tornadoes and strong tornadoes, and high probabilities for most other categories. Multiple tornado emergencies were issued for at least three different tornadoes. The high risk was discontinued at 01z and downgraded to an enhanced risk as the storm system began weakening and the supercells began dying off, although the strongest tornado, which was rated EF4, took place a few hours after that time, and was east of where the high risk had been in place in earlier outlooks. A total of 20tornadoes were confirmed during the outlook period.[304]
Tornado outbreak of March 31 – April 1, 2023 – Two high risk zones were issued at 1630Z with 30%hatched areas for tornadoes. The northern of the two zones was discontinued at 01Z, whereas the southern zone was subsequently maintained. Multiple tornado emergencies and mass casualty events were issued during the outbreak. A total of 114tornadoes were confirmed during the outlook period, one of which was rated EF4 and occurred in the northern high risk area prior to its 01Z removal. This was the first instance of two separate high risk areas since the initial 06Z outlook on April 14, 2012, and the first time in the 21st century in which the 1630Z and 20Z outlooks had separate high risk zones. This was also the deadliest high risk day since March 2, 2012.[citation needed]
Tornado outbreak of May 6–10, 2024 – A high risk zone was issued at the 13Z outlook and subsequently maintained for a 30%hatched area for tornadoes.[306][308] 47 tornadoes were confirmed, including a violent EF4 tornado that struck Barnsdall and Bartlesville, Oklahoma after dark, occurring within the high risk area in the 01Z outlook update and killing two people. However, all of the other tornadoes were weak, and the southern portion of the high risk generally lacked tornado reports.
Tornado outbreak of March 13–16, 2025 – A high risk was issued in the 1730Z Day 2 convective outlook, with a 30% risk for significant tornadoes.[309] It was only the third ever issuance of a Day 2 high risk in SPC history, and the first since April 14, 2012.[310] This is also the first Day 2 high risk under the five category outlook system, which began in October 2014, as well as the first Day 2 high risk since Day 2 individual hazard probability graphics began in January 2020. The high risk area was expanded slightly for the 0600 UTC Day 1 Outlook issuance, with a continued focus on a 30% hatched (significant) area for tornadoes. Before the tornado outbreak started, two PDS Tornado watches were issued and both had >95 probability for both tornadoes, and strong tornadoes.[311][312] Multiple intense tornadoes occurred in the High Risk area, particularly across southern Mississippi. This includes the EF4 tornado that struck the northwestern portion of Walthall County, Mississippi near Tylertown, Mississippi.[313] In all, 43 tornadoes occurred during the outbreak period. The high risk was discontinued at 0100 UTC update.[314]
Tornado outbreak and floods of April 2–7, 2025 – A high risk was issued in the 0600Z Day 1 convective outlook, with a 30% risk for significant tornadoes. The high risk would be expanded southwestward in the 13Z outlook update. Widespread intense severe thunderstorms occurred across the high risk area. Numerous tornado warnings, including several PDS tornado warnings and two tornado emergencies were issued. The high risk was maintained throughout the entire outlook cycle with 91 tornadoes touching down during that time.[315]
12345All values include events that took place outside the high-risk area(s). Tornado and fatality totals only include incidents that occurred on the respective high risk days. Fatality totals only include direct tornadic deaths.
↑Starting on February 1, 2007, the Fujita Scale was replaced with the Enhanced Fujita Scale for rating tornadoes.
↑This number reflects the number of tornadoes during the outlook period between 12Z on the day of the high risk to 12Z the next day.
References
↑Chris Hayes Novy (March 25, 2010). "SPC and its Products: Convective Outlooks". Storm Prediction Center. National Oceanic and Atmospheric Administration. Retrieved June 15, 2013.
↑Badgett, Phillip; Smith, Barrett; Blaes, Jonathan; Gonski, Rod & Keeter, Kermit (March 18, 2009). "March 28, 1984 Carolina's Tornado Outbreak". National Weather Service Office in Raleigh, North Carolina. North Carolina State University. Retrieved June 18, 2013.
↑"March 28, 1984 Tornado List". National Climatic Data Center. Tornado History Project. 2013. Archived from the original on October 5, 2015. Retrieved June 17, 2013.
↑"November 15, 1989 Tornado List". National Climatic Data Center. Tornado History Project. 2013. Archived from the original on January 17, 2016. Retrieved June 17, 2013.
↑"May 15, 1990 Tornado List". National Climatic Data Center. Tornado History Project. 2013. Archived from the original on October 23, 2015. Retrieved June 18, 2013.
↑"June 2, 1990 Tornado List". National Climatic Data Center. Tornado History Project. 2013. Archived from the original on February 4, 2013. Retrieved June 18, 2013.
↑"April 26, 1991 Tornado List". National Climatic Data Center. Tornado History Project. 2013. Archived from the original on October 23, 2015. Retrieved June 18, 2013.
↑Satkus, Robert. "April 28, 1991". Fire Dispatcher. Archived from the original on June 10, 2007. Retrieved June 18, 2013.
↑"June 16, 1992 Tornado List". National Climatic Data Center. Tornado History Project. 2013. Archived from the original on July 17, 2011. Retrieved June 18, 2013.
↑"June 17, 1992 Tornado List". National Climatic Data Center. Tornado History Project. 2013. Archived from the original on June 23, 2015. Retrieved June 18, 2013.
↑"March 27, 1994 Tornado List". National Climatic Data Center. Tornado History Project. 2013. Archived from the original on October 23, 2015. Retrieved June 18, 2013.
↑"April 25, 1994 Tornado List". National Climatic Data Center. Tornado History Project. 2013. Archived from the original on October 23, 2015. Retrieved June 18, 2013.
↑"November 27, 1994 Tornado List". National Climatic Data Center. Tornado History Project. 2013. Archived from the original on January 17, 2016. Retrieved June 18, 2013.
↑"May 7, 1995 Tornado List". National Climatic Data Center. Tornado History Project. 2013. Archived from the original on February 4, 2013. Retrieved June 17, 2013.
↑"May 12, 1995 Tornado List". National Climatic Data Center. Tornado History Project. 2013. Archived from the original on February 16, 2012. Retrieved June 17, 2013.
↑"May 13, 1995 Tornado List". National Climatic Data Center. Tornado History Project. 2013. Archived from the original on February 16, 2012. Retrieved June 17, 2013.
↑"May 17, 1995 Tornado List". National Climatic Data Center. Tornado History Project. 2013. Archived from the original on February 5, 2013. Retrieved June 17, 2013.
↑"April 19, 1996 Tornado List". National Climatic Data Center. Tornado History Project. 2013. Archived from the original on August 9, 2011. Retrieved June 17, 2013.
↑"July 1, 1997 Tornado List". National Climatic Data Center. Tornado History Project. 2013. Archived from the original on March 3, 2016. Retrieved June 17, 2013.
↑"April 8, 1998 Tornado List". National Climatic Data Center. Tornado History Project. 2013. Archived from the original on March 12, 2012. Retrieved June 17, 2013.
↑"April 16, 1998 Tornado List". National Climatic Data Center. Tornado History Project. 2013. Archived from the original on February 27, 2012. Retrieved June 17, 2013.
↑"May 31, 1998 Tornado List". National Climatic Data Center. Tornado History Project. 2013. Archived from the original on November 11, 2019. Retrieved June 17, 2013.
↑"January 21, 1999 Tornado List". National Climatic Data Center. Tornado History Project. 2013. Archived from the original on July 3, 2013. Retrieved June 17, 2013.
↑"July 31, 2002 Tornado List". National Climatic Data Center. Tornado History Project. 2013. Archived from the original on June 16, 2013. Retrieved June 15, 2013.
↑"November 10, 2002 Tornado List". National Climatic Data Center. Tornado History Project. 2013. Archived from the original on April 13, 2014. Retrieved June 15, 2013.
↑"December 23, 2002 Tornado List". National Climatic Data Center. Tornado History Project. 2013. Archived from the original on January 17, 2016. Retrieved June 15, 2013.
↑"April 6, 2003 Tornado List". National Climatic Data Center. Tornado History Project. 2013. Archived from the original on June 18, 2013. Retrieved June 16, 2013.
↑"May 4, 2003 Tornado List". National Climatic Data Center. Tornado History Project. 2013. Archived from the original on June 17, 2013. Retrieved June 16, 2013.
↑"May 5, 2003 Tornado List". National Climatic Data Center. Tornado History Project. 2013. Archived from the original on June 18, 2013. Retrieved June 16, 2013.
↑"May 8, 2003 Tornado List". National Climatic Data Center. Tornado History Project. 2013. Archived from the original on June 18, 2013. Retrieved June 16, 2013.
↑"May 10, 2003 Tornado List". National Climatic Data Center. Tornado History Project. 2013. Archived from the original on June 18, 2013. Retrieved June 16, 2013.
↑"May 15, 2003 Tornado List". National Climatic Data Center. Tornado History Project. 2013. Archived from the original on June 17, 2013. Retrieved June 16, 2013.
↑"March 4, 2004 Tornado List". National Climatic Data Center. Tornado History Project. 2013. Archived from the original on June 17, 2013. Retrieved June 16, 2013.
↑"May 22, 2004 Tornado List". National Climatic Data Center. Tornado History Project. 2013. Archived from the original on June 18, 2013. Retrieved June 16, 2013.
↑"May 24, 2004 Tornado List". National Climatic Data Center. Tornado History Project. 2013. Archived from the original on June 17, 2013. Retrieved June 16, 2013.
↑"May 29, 2004 Tornado List". National Climatic Data Center. Tornado History Project. 2013. Archived from the original on June 18, 2013. Retrieved June 16, 2013.
↑"May 30, 2004 Tornado List". National Climatic Data Center. Tornado History Project. 2013. Archived from the original on June 18, 2013. Retrieved June 16, 2013.
↑"April 11, 2005 Tornado List". National Climatic Data Center. Tornado History Project. 2013. Archived from the original on June 18, 2013. Retrieved June 16, 2013.
↑"June 4, 2005 Tornado List". National Climatic Data Center. Tornado History Project. 2013. Archived from the original on June 18, 2013. Retrieved June 16, 2013.
↑"November 15, 2005 Tornado List". National Climatic Data Center. Tornado History Project. 2013. Archived from the original on June 18, 2013. Retrieved June 16, 2013.
↑"March 12, 2006 Tornado List". National Climatic Data Center. Tornado History Project. 2013. Archived from the original on June 17, 2013. Retrieved June 16, 2013.
↑"April 6, 2006 Tornado List". National Climatic Data Center. Tornado History Project. 2013. Archived from the original on June 18, 2013. Retrieved June 16, 2013.
↑"April 7, 2006 Tornado List". National Climatic Data Center. Tornado History Project. 2013. Archived from the original on June 18, 2013. Retrieved June 16, 2013.
↑"March 1, 2007 Tornado List". National Climatic Data Center. Tornado History Project. 2013. Archived from the original on June 18, 2013. Retrieved June 16, 2013.
↑"April 13, 2007 Tornado List". National Climatic Data Center. Tornado History Project. 2013. Archived from the original on June 18, 2013. Retrieved June 16, 2013.
↑"April 24, 2007 Tornado List". National Climatic Data Center. Tornado History Project. 2013. Archived from the original on June 17, 2013. Retrieved June 16, 2013.
↑"May 5, 2007 Tornado List". National Climatic Data Center. Tornado History Project. 2013. Archived from the original on June 18, 2013. Retrieved June 16, 2013.
↑"June 7, 2007 Tornado List". National Climatic Data Center. Tornado History Project. 2013. Archived from the original on June 18, 2013. Retrieved June 16, 2013.
↑"February 5, 2008 Tornado List". National Climatic Data Center. Tornado History Project. 2013. Archived from the original on June 17, 2013. Retrieved June 16, 2013.
↑"March 15, 2008 Tornado List". National Climatic Data Center. Tornado History Project. 2013. Archived from the original on June 17, 2013. Retrieved June 16, 2013.
↑"May 22, 2008 Tornado List". National Climatic Data Center. Tornado History Project. 2013. Archived from the original on June 18, 2013. Retrieved June 16, 2013.
↑"May 29, 2008 Tornado List". National Climatic Data Center. Tornado History Project. 2013. Archived from the original on June 17, 2013. Retrieved June 16, 2013.
↑"June 5, 2008 Tornado List". National Climatic Data Center. Tornado History Project. 2013. Archived from the original on June 17, 2013. Retrieved June 16, 2013.
↑"April 10, 2009 Tornado List". National Climatic Data Center. Tornado History Project. 2013. Archived from the original on June 17, 2013. Retrieved June 16, 2013.
↑"April 26, 2009 Tornado List". National Climatic Data Center. Tornado History Project. 2013. Archived from the original on June 17, 2013. Retrieved June 16, 2013.
↑"Tornado Outbreak April 28–29, 2014". National Weather Service office in Birmingham, Alabama. National Oceanic and Atmospheric Administration. May 2, 2014. Retrieved May 3, 2014.
This page is based on this Wikipedia article Text is available under the CC BY-SA 4.0 license; additional terms may apply. Images, videos and audio are available under their respective licenses.


