Köppen climate types of the United States using the 0°C (32°F) isotherm.Köppen climate types of the United States using the −3°C (27°F) isotherm.
The climate of the U.S. varies due to changes in latitude, and a range of geographic features, including mountains and deserts. Generally, on the mainland, the climate of the U.S. becomes warmer the farther south one travels, and drier the farther west, until one reaches the West Coast.
West of 100°W, much of the U.S. has a cold semi-arid climate in the interior upper western states (Idaho to the Dakotas), to warm to hot desert and semi-arid climates in the southwestern U.S. East of 100°W, the climate is humid continental in northern areas (locations roughly above 40°N, Northern Plains, Midwest, Great Lakes, New England), transitioning into a humid temperate climate from the Southern Plains and lower Midwest east to the Middle Atlantic states (Virginia to southern Connecticut).
The primary drivers of weather in the contiguous United States are the seasonal change in the solar angle, the migration north–south of the subtropical highs, and the seasonal change in the position of the polar jet stream.
In the Northern Hemisphere summer, the subtropical high pressure systems move northward and closer to the United States mainland. In the Atlantic Ocean, the Bermuda High creates a south-southwest flow of tropical air masses over the southeastern, south-central and central United States – resulting in warm to hot temperatures, high humidity and frequent intense (but usually brief) showers and/or thunderstorms as the heat builds in the afternoon. In the Northern Hemisphere summer, high pressure in the Pacific Ocean builds toward the California coast, resulting in a northwesterly airflow, creating the cool, dry, and stable weather conditions prevalent along the West Coast in summer.
In the Northern Hemisphere winter, the subtropical highs retreat southward. The polar jet stream (and associated conflict zone between cold, dry air masses from Canada and warm, moist air masses from the Gulf of Mexico) drops further southward into the United States – bringing more frequent periods of stormy weather, with rain, ice and snow, and much more variable temperatures, with rapid temperature rises and falls not uncommon. Areas in the southern U.S. (Florida, the Gulf Coast, the Desert Southwest, and southern California) however, often have more stable weather, as the polar jet stream's impact does not usually reach that far south.
Weather systems, be they high-pressure systems (anticyclones), low-pressure systems (cyclones) or fronts (boundaries between air masses of differing temperature, humidity and most commonly, both) are faster-moving and more intense in the winter/colder months than in the summer/warmer months, when the belt of lows and storms generally moves into southern Canada.
The Gulf of Alaska is the origination area of many storms that enter the United States. Such "North Pacific lows" enter the U.S. through the Pacific Northwest, then move eastward across the northern Rocky Mountains, northern Great Plains, upper Midwest, Great Lakes and New England states. Across the central states from late fall to spring, "Panhandle hook" storms move from the central Rockies into the Oklahoma/Texas panhandle areas, then northeast toward the Great Lakes. They generate unusually large temperature contrasts, and often bring copious Gulf moisture northward, resulting sometimes in cold conditions and possibly-heavy snow or ice north and west of the storm track, and warm conditions, heavy rains and potentially-severe thunderstorms south and east of the storm track – often simultaneously.
As a result of global warming, average springtime temperatures have risen in the 48 contiguous states since the middle of the 20th century.
Across the northern states in winter usually from Montana eastward, "Alberta clipper" storms track east and bring light to moderate snowfalls from Montana and the Dakotas across the upper Midwest and Great Lakes states to New England, and often, windy and severe Arctic outbreaks behind them. When winter-season Canadian cold air masses drop unusually far southward, "Gulf lows" can develop in or near the Gulf of Mexico, then track eastward or northeastward across the Southern states, or nearby Gulf or South Atlantic waters. They sometimes bring rain, but can bring snow or ice across the South, mostly in interior or northern areas.
In the cold season (generally November to March), most precipitation occurs in conjunction with organized low-pressure systems and associated fronts. In the summer, storms are much more localized, with short-duration thunderstorms common in many areas east of 100°W and south of 40°N.
In the warm season, storm systems affecting a large area are less frequent, and weather conditions are more solar controlled, with the greatest chance for thunderstorm and severe weather activity during peak heating hours, mostly between 3 PM and 9 PM local time. From May to August especially, often-overnight mesoscale-convective-system (MCS) thunderstorm complexes, usually associated with frontal activity, can deliver significant to flooding rainfall amounts from the Dakotas/Nebraska eastward across Iowa/Minnesota to the Great Lakes states.
From late summer into fall (mostly August to October), tropical cyclones (hurricanes, tropical storms and tropical depressions) sometimes approach or cross the Gulf and Atlantic states, bringing high winds, heavy rainfall, and storm surges (often topped with battering waves) to Gulf and Atlantic lowlands and coastal areas.
Record one day precipitation by county between 1979 and 2011.A map of the average annual high temperatures in the United States.
Regional overview
Southwest
The Southwest has a hot desert climate, at lower elevations. Cities like Phoenix, Las Vegas, Yuma, and Palm Springs have average highs over 100°F (38°C) during the summer months and lows in the 70s or even 80s. In winter, daily temperatures in the Southwest are cooler with highs in the 50s and 60s F, and lows in the 40s F.
In Phoenix, Las Vegas and similar Southwestern desert areas, on average June is the driest month, after Pacific-originating winter storms have concluded and before the Southwestern summer "monsoon" begins. The Southwest and the Great Basin are affected by said monsoon from the Gulf of California from July–September. This results in some increase in humidity and cloud cover, bringing higher nighttime low temperatures and localized thunderstorms to the region, which can result in flash flooding. Further eastward in the desert Southwest (Tucson, Arizona eastward toward El Paso, Texas), winter-season precipitation decreases, while the summer monsoon increasingly provides a summer precipitation maximum. For example, El Paso and Albuquerque, New Mexico have a pronounced July to September precipitation maximum. Still, drought has been frequent in the region, often lasting for periods of years or longer. Forest fires across the Western United States (especially the southwest) occur many years, and can be severe to extreme in especially hot, dry summer seasons.
Northern Arizona and New Mexico, central and northern Nevada and most of Utah (outside higher mountain areas) have a temperate semi-desert to desert climate, but with colder and snowier winters than in Phoenix and similar areas, and less-hot summers (as at Salt Lake City, Utah). Summer high temperatures often reach the 90s, but low temperatures drop into the low 60s and even 50s. As in other temperate desert climates, the dry air results in large differences (sometimes over 40 degrees) between daytime high and nighttime low temperatures. Precipitation, though scarce, often falls year-round, influenced both by summer thunderstorms brought by the Southwestern monsoon (primarily in southern areas), and by winter-season storms from the Pacific Ocean.
The coast of California has a Mediterranean climate. Daily high temperatures range from 70 to 80°F (21 to 27°C) in the summer to 50 to 65°F (10 to 16°C) in winter, with low temperatures from the 60°F (16°C)s in summer to the mid 40s F in winter.[citation needed] Like most Mediterranean climates, much of coastal California has a wet winter and dry summer. Early summers can often bring cool, overcast weather (fog and low stratus clouds) to coastal California. As such, the warmest summer weather is delayed until August, even September in many areas of the California coast; on average, September is the warmest month in San Francisco. Upwelling of cold Pacific waters also contributes to the frequent cool spring and early summer weather in coastal California. In California's inland river valleys (Bakersfield, Sacramento areas), the wet-winter, dry-summer pattern remains, but winters are cooler and more prone to occasional frost or freeze, while summers are much hotter, with blazing sunshine and daytime high temperatures not uncommonly in the 90s to over 100°F (38°C).
Gulf Coast/Lower Mississippi Valley/South Atlantic states
The Gulf and South Atlantic states have a humid subtropical climate with mostly mild winters and hot, humid summers. Most of the Florida peninsula including Tampa and Jacksonville, along with other coastal cities like Houston, New Orleans, Savannah, Charleston and Wilmington all have average summer highs from near 90 to the lower 90s F, and lows generally from 70 to 75°F (21 to 24°C); combined with moist tropical air, this creates the sultry summer weather conditions that prevail here.
In the interior South, in cities like Raleigh, Atlanta, Birmingham, Nashville, Lexington, and Jackson, average summer highs and lows are similar to coastal areas, while some areas of interior eastern and central Texas (i.e. Dallas, Austin and San Antonio areas) have average daily highs in the mid to upper 90s F. In winter, average daily high temperatures range from the 40°F (4°C)s (upper South: northern Arkansas, Kentucky and Virginia), to the 60°F (16°C)s along the Gulf Coast and South Atlantic coast (Charleston southward), with 70°F (21°C)s in central Florida and far southern Texas. Average daily lows in winter range from 20°F (−7°C)s north to 40°F (4°C)s along the Gulf and far South Atlantic coasts, with 50°F (10°C)s in Florida and coastal south Texas, both regions bordering the tropical climate zone.
Much of the interior South (Tennessee, Kentucky and the northern Gulf states) has a winter or spring maximum in precipitation, with December, March or April typically the wettest month, and August to October the driest months – for example, at Birmingham, Huntsville, Tupelo and Memphis. From November to April, these areas commonly experience sharp conflicts between cold, dry air from Canada and warm, moist air from the Gulf of Mexico. These air-mass clashes often bring heavy winter and spring precipitation to the Mid-South. Given the tropical air masses, summer-season thunderstorms can occur throughout the South, but they are heavier and more frequent along the Gulf Coast, South Atlantic coast (Norfolk, Virginia area southward), and in peninsular Florida. Along most of the Gulf coast (i.e. New Orleans, Mobile and Pensacola areas), and in South Atlantic coastal and sandhills areas (i.e. Columbia, Fayetteville, Raleigh, Wilmington, and Norfolk), July and August are usually the wettest months, and precipitation is fairly evenly distributed the rest of the year. Primarily from August to early October, the coastal Gulf and South Atlantic states are susceptible to being struck by tropical weather systems (tropical depressions, tropical storms, and hurricanes). Even in winter, most precipitation falls as rain. However, occasionally frozen precipitation (snow, sleet and/or freezing rain) can occur (more commonly in interior and northern areas) when southerly-tracking storms throw Gulf or Atlantic moisture over cold air at ground level.
Southern Florida has a tropical climate, with all months having a mean temperature of higher than 65°F (18°C), a wet season from May through October, and a dry season from November through April. In cities like Fort Lauderdale, Miami, Key West, Naples, and Palm Beach average daily highs range from the mid 70°F (21°C)s in winter to near 90°F (32-33°C) in summer. Average overnight lows range from the upper 50°F (10°C)s in winter to the mid and upper 70°F (21°C)s in summer. Southern Florida is the warmest region of the U.S. mainland in winter.
Southern Plains/Lower Midwest/Middle East Coast/Mid-Atlantic
The region from the southern Plains, to the lower Midwest, eastward to parts of the Upper South, and the central East Coast (the New York City/coastal Connecticut region southward to Virginia) has a humid temperate climate, transitional between the humid continental and humid subtropical climate zones, becoming semi-arid in the western plains. This region has cool to cold winters and hot, humid summers. Daytime highs range from 80 to 90°F (27 to 32°C) in summer to 35 to 50°F (2 to 10°C) in winter. Lows range from the 60°F (16°C)s in summer to 25 to 35°F (−4 to 2°C) in winter. Cities in this region include Louisville, Kentucky, Wichita, Kansas, Cincinnati, St. Louis, Missouri, Springfield, Illinois, Indianapolis, Columbus, Ohio, Pittsburgh, Philadelphia, Washington, D.C., Richmond, Virginia, New York City, New Haven, Connecticut, and Atlantic City, New Jersey. Precipitation is spread fairly evenly throughout the year, though as one travels from Indiana westward there is an increasingly prominent early-summer concentration, with a May maximum in northern Texas and Oklahoma, and a June maximum increasingly evident from (central/northern) Indiana westward to Kansas. As one travels from east to west across Texas, Oklahoma and Kansas, average annual precipitation steadily decreases. Far western Texas (El Paso area) is desert, and average annual precipitation is less than twenty inches (510mm) in westernmost Kansas and the Oklahoma Panhandle, where the climate qualifies as semi-arid.
In the lower Midwest (and southern Plains states, especially), temperatures can rise or drop rapidly; winds can be extreme; and clashing air masses, including hot, dry air of Mexican and/or Southwestern origin, warm, moist air from the Gulf of Mexico and cold, dry air from Canada can spawn severe thunderstorms and tornadoes, particularly from April to June. The "dryline", separating hot, dry air of Mexican/Southwestern U.S. origin from warm, moist air from the Gulf of Mexico, often causes severe, occasionally violent, thunderstorms to fire in central and eastern Texas, Oklahoma and Kansas; these sometimes contribute toward the hailstorms and tornado outbreaks that the Southern Plains are well known for. Reflecting these air-mass conflicts, central Oklahoma, including the Oklahoma City and Moore–Norman areas, has the highest frequency of tornadoes per unit land area on planet Earth, with May the highest-risk month for tornadoes throughout "Tornado Alley", from northern Texas north-northeastward toward western and central Iowa.
Northern Great Plains/North-Central/Great Lakes/New England
The northern half of the Great Plains (Nebraska northward), Midwest, Great Lakes, and New England states have a variety of humid continental climates, and the western plains have a semi-arid climate. Here there are four distinct seasons, with warm to hot summers, and cold and often-snowy winters. Average daily high temperatures range from 10°F (−12°C) (in North Dakota, and central and northern Minnesota) to 30°F (−1°C) in winter to 70 to 80°F (21 to 27°C)s in summer, while overnight lows range from below 0°F (−18°C) in winter (in North Dakota and much of Minnesota) to 50 to 60°F (10 to 16°C) in summer. In the New England states, precipitation is evenly distributed around the year, with a slight late fall-early winter (November–December) maximum along the New England coast from Boston northward due to intense early-winter storms. In the Great Lakes states, cold Arctic air in winter crossing the relatively warmer lake waters can result in frequent and sometimes very heavy lake-effect snow, especially on the eastern and southern shores of the Great Lakes (for example, in western Michigan's Lower Peninsula and in the Buffalo, New York area). Cities in this area include Minneapolis, Omaha, Sioux Falls, Fargo, Chicago, Cleveland, Buffalo, Albany, Boston, Concord and Augusta. As one travels from east to west across Nebraska, South Dakota and North Dakota, average annual precipitation steadily decreases, and the westernmost counties of these states have a semi-arid climate, with about or just over 15 inches of precipitation per year, on average (see climate data for Williston, North Dakota, Rapid City, South Dakota and Scottsbluff, Nebraska).
In the upper Midwest and northern Plains states, temperatures may rise or fall rapidly, and winds (from warm-season thunderstorms or larger-scale low-pressure systems) can be strong to extreme. Here, air-mass conflicts primarily involve warm, moist air from the Gulf of Mexico, clashing with cool to cold, dry air from Canada, with only occasional intrusions of hot, dry air from the southwest. The conflicts between Canadian and Gulf air commonly produce severe thunderstorms (including hailstorms, especially on the western Plains) and tornadoes, particularly in May and June. In the northern Plains and North Central states generally, June is the year's wettest month on average, owing to maximum shower and thunderstorm activity. Also, June is the highest-risk month for severe weather throughout North Dakota, South Dakota, Minnesota, Iowa, Wisconsin and northern Illinois.[citation needed]
The Pacific Northwest has an oceanic climate. The climate is wet and cool in autumn, winter, and spring, and stable and dry in the summer months, especially July and August. On average, the wettest month is typically November or December; the driest, July. In the summer months, average highs in cities like Seattle and Portland are from 70 to 75°F (21 to 26°C) with lows from 50 to 59°F (10 to 15°C), while in winter daily highs are from 40 to 45°F (4 to 9°C) and overnight lows from 30 to 38°F (−1 to 4°C).[citation needed]
In winter, the Pacific Northwest (especially coastal districts and other areas west, i.e. on the prevailing windward side, of the Olympic and Cascade mountain ranges), experiences a mostly overcast, wet and cool climate, but without severe cold like that found in the interior northern U.S. (i.e. Minnesota/North Dakota). At lower elevations, winter precipitation falls mostly as rain. However, snow does occur even at the lowest elevations, primarily when Pacific moisture interacts with cold air intruding into the Pacific Northwest from western Canada (i.e. Alberta and interior British Columbia). Summers in the Pacific Northwest are generally cool, especially along the coastline. The Great Basin and Columbia Plateau (the Intermontane Plateaus) are arid or semiarid regions, with high summer temperatures in the 90s to occasionally over 100 at lower elevations (e.g. at Boise, Idaho), with annual precipitation averaging less than 15 inches (380mm) as a result of the rain shadow of the Sierra Nevada and Cascades.[citation needed] Both coastal and interior areas of Oregon and Washington, and southern Idaho, have a wet-winter, dry-summer precipitation pattern, but traveling eastward into Montana and Wyoming, this transitions progressively (for example, at Missoula, Montana) toward relatively drier winters and a May and eventually June precipitation maximum, the latter characteristic of the Northern Plains and much of the upper Midwest (i.e. both Dakotas, Nebraska, Iowa and Minnesota).
The climate in Juneau and the southeast panhandle is a mid-latitude oceanic climate (Köppen Cfb).[3] The climate in the extreme north of Alaska is what would be expected for an area north of the Arctic Circle — it is an Arctic climate (Köppen ET) with long, very cold winters and short, cool summers.[4] Akclimate.org says the following: "The altitude above sea level influences the climate of a given area [in Alaska]. Lower elevations in interior Alaska, such as the Yukon Flats and the Tanana Valley experience extreme cold in the winter as well as high summertime temperatures."[5]
Hawaii has 11 different climate zones, influenced by altitude and topographical effect on wind and rainfall. These include tropical at sea level, arid, semi-arid, temperate, and alpine at the highest elevations.[6]Snow sometimes occurs in high mountain areas.[7]
Puerto Rico has different climatic zones, all tropical. The northeastern part of the territory is very wet, with a tropical rainforest climate (KöppenAf). This supports rainforests like El Yunque. The southern part is drier, mostly a savanna climate (Köppen Aw) with small locations on the southern coast dry enough to have a hot-semi arid climate (Koppen BSh).
The U.S. Virgin Islands have a tropical savanna climate, with warm, dry winters, and rainy summers (Köppen Aw), typical of the Caribbean. The wet season is from May to October.
Guam and the Northern Mariana Islands both have a trade-wind tropical rainforest climate (Köppen Af). The dry season is from January to May, and the wet season from July to November.
American Samoa is south of the equator, and therefore its wet/dry seasons are reversed. The wet season is from December–March, and the dry season is from April–September. Rainmaker Mountain on Tutuila traps trade-wind rainclouds, leading to very high rainfall and a tropical rainforest climate (Köppen Af).
Extreme precipitation events have become more common over recent decades.[9]
Precipitation (whether by annual amount, annual distribution or characteristic[s]) varies significantly across the United States and its possessions. Late summer and fall extratropical cyclones bring a majority of the precipitation which falls across western, southern, and southeast Alaska annually. During the fall, winter, and spring, Pacific storm systems bring most of Hawaii and the western United States much of their precipitation. Most of Florida has a subtropical monsoon rainfall pattern (wet summer and dry winter).[10]
In the central and upper eastern United States, precipitation is evenly distributed throughout the year, although summer rainfall increases as one moves southeastward. Lake-effect snows add to precipitation potential downwind of the Great Lakes,[11] as well as Great Salt Lake and the Finger Lakes during the cold season. The average snow to liquid ratio across the contiguous United States is 13:1, meaning 13 inches (330mm) of snow melts down to 1 inch (25mm) of water.[12] The El Niño-Southern Oscillation affects the precipitation distribution, by altering rainfall patterns across the West, Midwest, the Southeast, and throughout the tropics.[13][14][15][16]
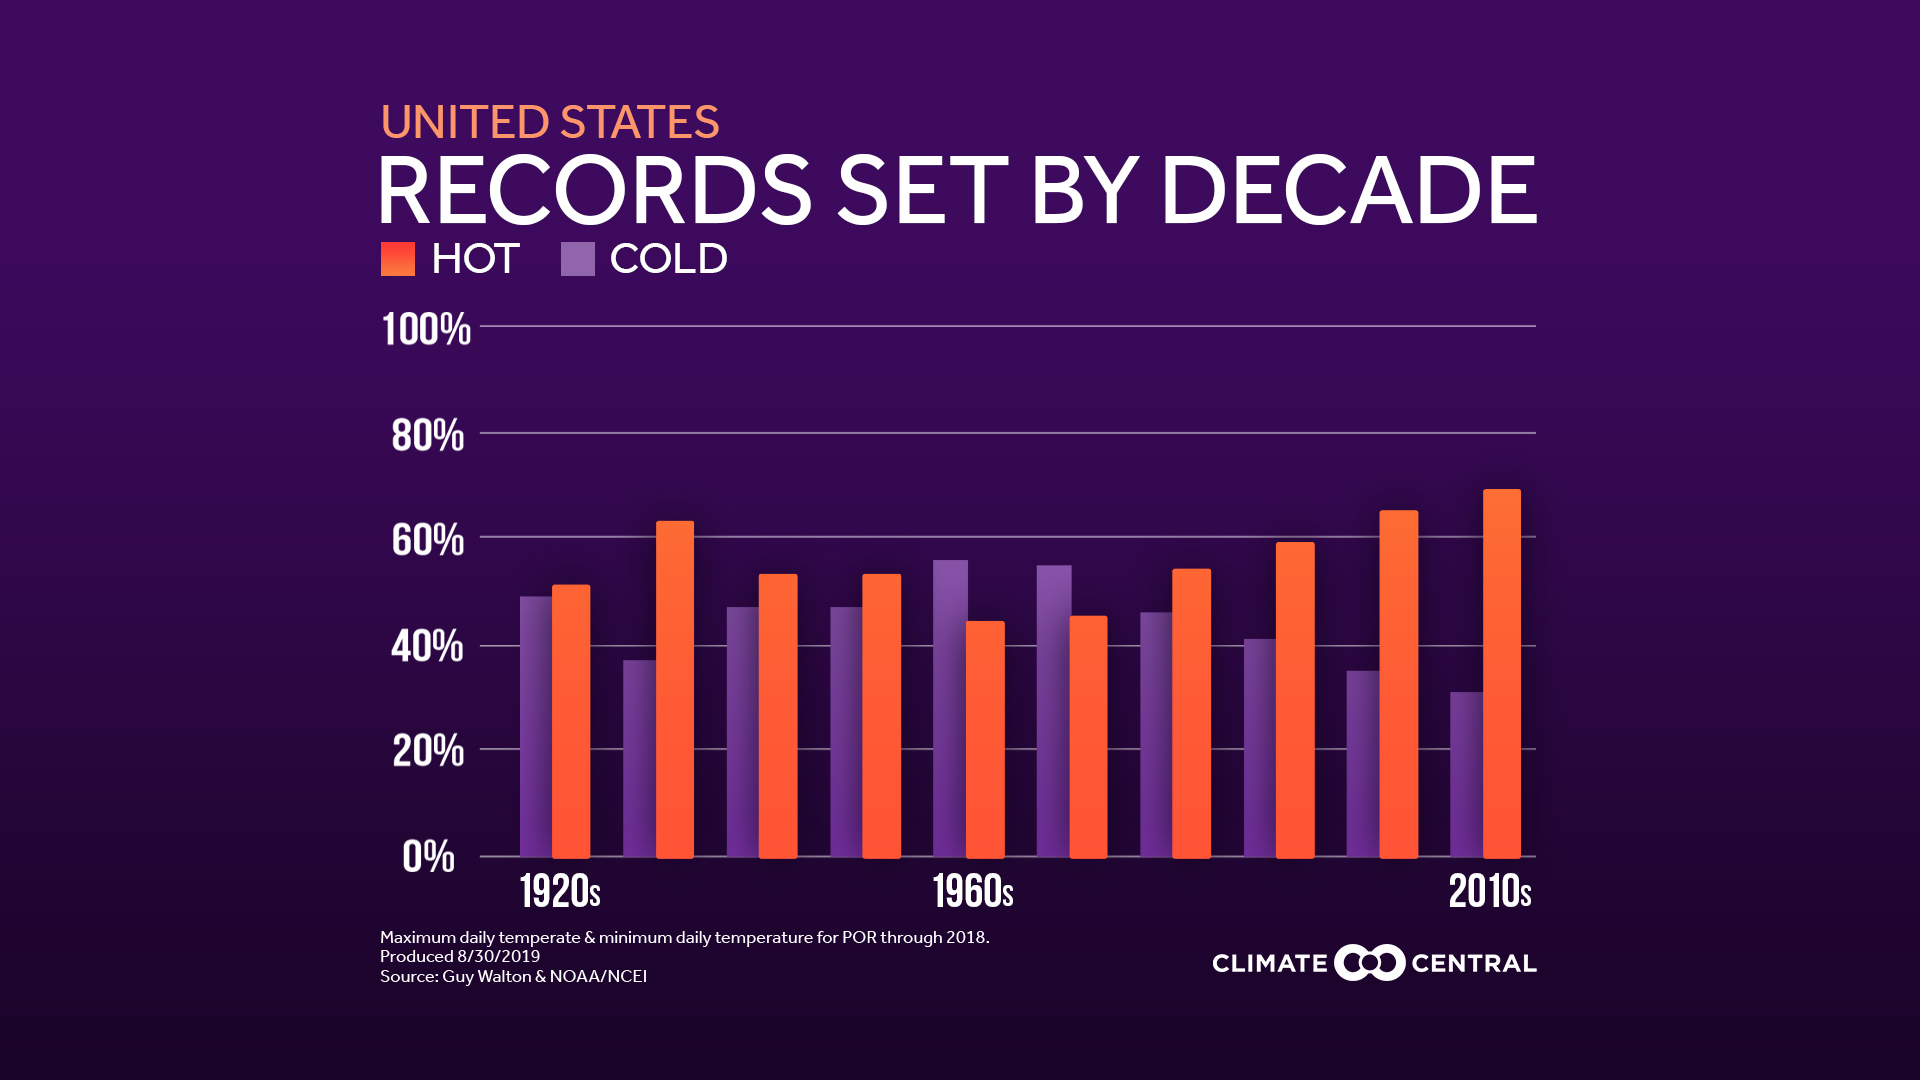
In recent decades, record high daily temperatures have predominated over record daily low temperatures, with record daily highs now numbering more than twice that of record daily lows.[20]
The 20-year average of the number of annual Category 4 and 5 hurricanes in the Atlantic region has approximately doubled since the year 2000.[21]
Category 5 hurricanes have become much more common in recent decades.[22]
In northern Alaska, tundra and arctic conditions predominate, and the temperature has fallen as low as −80°F (−62°C).[23] On the other end of the spectrum, Death Valley, California once reached 134°F (56.7°C), officially the highest temperature ever recorded on Earth.[24]
On average, the mountains of the western states receive the highest levels of snowfall on Earth. The greatest annual snowfall level is at Mount Rainier in Washington, at 692 inches (1,758cm); the record there was 1,122 inches (2,850cm) in the winter of 1971–72. This record was broken by the Mt. Baker Ski Area in northwestern Washington which reported 1,140 inches (2,896cm) of snowfall for the 1998–99 snowfall season. Other places with significant snowfall outside the Cascade Range are the Wasatch Range, near the Great Salt Lake and the Sierra Nevada, near Lake Tahoe.
Along the coastal mountain ranges in the Pacific Northwest, rainfall is greater than anywhere else in the continental U.S., with Quinault Ranger Station in Washington having an average of 137 inches (3,480mm).[25] Hawaii receives even more, with 404 inches (10,262mm) measured annually, on average, at the Big Bog, in Maui.[26]Pago Pago Harbor in American Samoa is the rainiest harbor in the world (because of the 523 meter Rainmaker Mountain).[27] The Sonoran Desert in the southwest is home to the driest locale in the US. Yuma, Arizona, has an average of 2.63 inches (67mm) of precipitation each year.[28]
Because of contrasting air masses, the Great Plains, the Midwest, and the southern United States have frequent severe thunderstorms and tornado outbreaks during both the spring and the summer. In central portions of the U.S., tornadoes are more common than anywhere else in the world.[31] They usually can touch down during the spring and the summer. The strip of land from north Texas north to Nebraska and east into Southern Michigan is known as Tornado Alley, where many houses have tornado shelters and where many towns have tornado sirens. Stretching across Mississippi and Alabama, Dixie Alley has experienced both tornadoes and violent thunderstorms, with peak tornado season coming on as early as February and waning by May. Florida also reports many tornadoes, but these rarely are very strong. The southern US has a second tornado season during the autumn. Generally, the area at greatest risk for tornadoes migrates northward from February to June, peaking in the Gulf States in February and March, the Ohio Valley and lower Midwest in April, southern and central Plains and central Midwest in May, and Northern Plains and upper Midwest (Dakotas, Minnesota, and Wisconsin) in June. Eastern and Gulf Coastal states suffer from frequent Hurricanes and tropical storms from late summer into autumn.
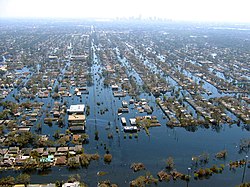
Both the Appalachian region and the Midwest experience the worst floods. Widespread severe flooding is rare. Some exceptions include the Great Mississippi Flood of 1927, the Great Flood of 1993, and widespread flooding and mudslides caused by the 1982–83 El Niño event in the western United States. Localized flooding can, however, occur anywhere. Mudslides from heavy rain can even cause problems in any mountainous areas, particularly in the Southwest. The narrow canyons of many mountain areas in the west and severe thunderstorm activity during the monsoon season in summer leads to sometimes devastating flash floods as well. On the other hand, Nor'easter snowstorms can bring activity to a halt in both the New England and Great Lakes regions.
In 2013, the US sustains $10 billion annually in damage from floods.[32]
The Southwest has the worst droughts; one is thought to have lasted over 500 years and to have decimated the Anasazi people.[33] Large stretches of desert shrub in the west can fuel the spreads of wildfires. Although severe drought is rare, it has occasionally caused some major problems, such as those during the Dust Bowl (1931–1942), which coincided with the Great Depression. Farmland failed throughout the Plains, entire regions were virtually depopulated, and dust storms ravaged the land. More recently, the western US experienced widespread drought from 1999 to 2004.
In terms of deaths from heat waves, 7,415 losses occurred between 1999 and 2010, a mean of 618 per year. A disproportionate number of men, a full 68% of deaths, versus women have been affected. The highest yearly total of heat-related deaths during that time frame was in 1999. The lowest was in 2004.[34] In terms of deaths caused by cold waves, the same gender inequality exists; 66% of hypothermia-related deaths in 2002 were of males. From 1979 to 2002, 16,555 deaths occurred due to exposure to excessive cold temperatures, a mean of 689 per year.[35]
Approximately 43 people die by lightning strike each year in the United States, and 90 percent of those struck will survive. Americans have a one in 15,300 chance of being struck by lightning in their lifetime.[36]
↑"World: Highest Temperature". World Weather / Climate Extremes Archive. Arizona State University. 2012. Archived from the original on January 4, 2013. Retrieved January 15, 2013.
↑Longman, R.J.; Giambelluca, T.W. (2015). "Climatology of Haleakalā". Climatology of Haleakalā Technical Report No. 193. 1 (1): 105–106. hdl:10125/36675. Archived from the original on September 12, 2023. Retrieved April 8, 2020.
This page is based on this Wikipedia article Text is available under the CC BY-SA 4.0 license; additional terms may apply. Images, videos and audio are available under their respective licenses.


