
Missouri generally has a variety of seasonal humid subtropical climate, with cool winters and long, hot summers. In the southern part of the state, particularly in the Bootheel, the climate borders on a more mild-type humid subtropical climate, and in the northern third, the state transitions into a humid continental climate. Because of its location in the interior United States, Missouri often experiences extremes in temperatures. Lacking either large mountains or oceans nearby to moderate its temperature, its climate is alternately influenced by air from the cold Arctic and the hot and humid Gulf of Mexico.

The climate of Virginia, a state on the east coast of the United States, is mild compared to more northern areas of the United States such as New England and the Midwest. Most of Virginia east of the Blue Ridge mountains, the southern part of the Shenandoah Valley, and the Roanoke Valley, has a humid subtropical climate. In the mountainous areas west of the Blue Ridge, the climate is warm-summer humid continental or oceanic climate. Severe weather, in the form of tornadoes, tropical cyclones, and winter storms, impacts the state on a regular basis. Central Virginia received significant snowfall of 20 inches in December 2009.
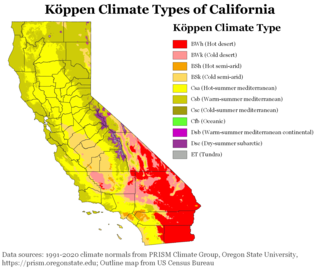
The climate of California varies widely from hot desert to alpine tundra, depending on latitude, elevation, and proximity to the Pacific Coast. California's coastal regions, the Sierra Nevada foothills, and much of the Central Valley have a Mediterranean climate, with warmer, drier weather in summer and cooler, wetter weather in winter. The influence of the ocean generally moderates temperature extremes, creating warmer winters and substantially cooler summers in coastal areas.
The climate of San Diego, California is classified as a hot-summer Mediterranean climate. The basic climate features hot, sunny, and dry summers, and cooler, wetter winters. However, San Diego is much more arid than typical Mediterranean climates, and winters are still dry compared with most other zones with this type of climate. The climate at San Diego International Airport, the location for official weather reports for San Diego, as well as the climate at most beach areas, straddles the border between BSh and BSk due to the mild winters and cool summers in these locations.
Columbus, Ohio has a humid continental climate, characterized by humid, hot summers and cold winters, with no dry season. The Dfa climate has average temperatures above 22 °C during the warmest months, with at least four months averaging above 10 °C, and below 0 °C during the coldest. The climate is transitional with the Cfa humid subtropical climate to the south, characterized by humid, hot summers and cool winters.
The Climate of Grand Forks, North Dakota is a warm summer continental typical of cities located in the Great Plains, with four very distinct seasons and great variation in temperatures over very short periods of time. The city's climate is characterized by long, cold winters with moderate snowfall and warm summers which are typically humid.
Dallas is located in North Texas, built along the Trinity River. It has a humid subtropical climate that is characteristic of the southern plains of the United States. Dallas experiences mild winters and hot summers.

North Dakota's climate is typical of a continental climate with cold winters and warm-hot summers. The state's location in the Upper Midwest allows it to experience some of the widest variety of weather in the United States, and each of the four seasons has its own distinct characteristics. The eastern half of the state has a humid continental climate with warm to hot, somewhat humid summers and cold, windy winters, while the western half has a semi-arid climate with less precipitation and less humidity but similar temperature profiles. The areas east of the Missouri River get slightly colder winters, while those west of the stream get higher summer daytime temperatures. In general, the diurnal temperature difference is prone to be more significant in the west due to higher elevation and less humidity.
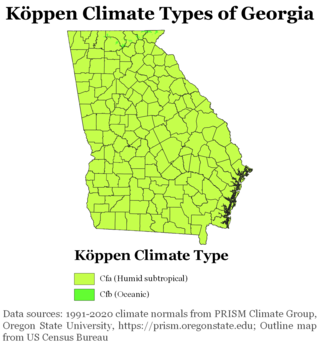
The climate of Georgia is a humid subtropical climate, with most of the state having short, mild winters and long, hot summers. The Atlantic Ocean on the east coast of Georgia and the hill country in the north impact the state's climate. Also, the Chattahoochee River divides Georgia into separate climatic regions with the mountain region to the northwest being cooler than the rest of the state; the average temperatures for the mountain region in January and July are 39 °F (4 °C) and 78 °F (26 °C) respectively. Winter in Georgia is characterized by mild temperatures and little snowfall around the state, with the potential for snow and ice increasing in the northern parts of the state. Summer daytime temperatures in Georgia often exceed 95 °F (35 °C). The state experiences widespread precipitation. Tornadoes and tropical cyclones are common.

North Carolina's climate is varying, from the Atlantic coast in the east to the Appalachian Mountain range in the west. The mountains often act as a "shield", blocking low temperatures and storms from the Midwest from entering the Piedmont and Coastal Plain of North Carolina.

The climate of Pennsylvania is diverse due to the multitude of geographic features found within the state. Straddling two major climate zones, the southeastern corner of Pennsylvania has the warmest climate. A portion of Greater Philadelphia lies at the southernmost tip of the humid continental climate zone, with the city proper being in the humid subtropical climate zone. Still, Philadelphia features colder, snowier winters than most locations with a humid subtropical climate. Moving west toward the mountainous interior of the state, the climate becomes markedly colder, the number of cloudy days increases, and winter snowfall amounts are greater.
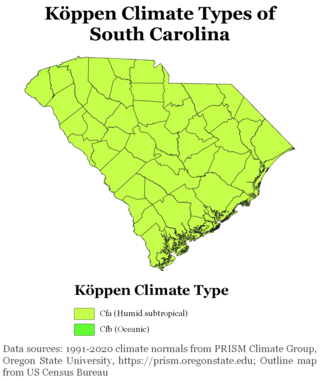
South Carolina has a humid subtropical climate, with hot summers throughout most of the state. But, an exception does occur in the Blue Ridge Mountains, as outlier pockets of an Oceanic Climate do exist. Mild winters predominate in the eastern and southern part of the state, but cool to occasionally cold winters are the standard in the northwestern area of the state, especially areas at or above 600 feet in elevation. On average, between 40 and 80 inches of precipitation falls annually across the state, potentially even in excess of 100 inches in portions of the Appalachian temperate rainforest. Tropical cyclones, and afternoon thunderstorms due to hot and humid conditions, contribute to precipitation during the summer and sometimes fall months, while extratropical cyclones contribute to precipitation during the fall, winter, and spring months. The coast experiences nearly all of their tropical weather impacts from storms coming directly from the Atlantic coast. The northwestern area of the state can receive impacts from both Atlantic basin storms moving westward from the coast and also occasionally very heavy rainfall and flooding from storms originating from the Gulf of Mexico that move inland towards the northeast after making landfall from the Florida Panhandle to Louisiana.
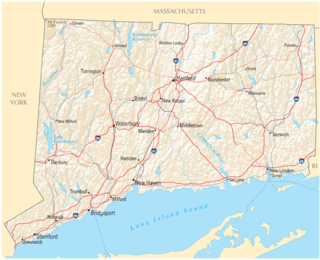
The U.S. state of Connecticut is bordered on the south by Long Island Sound, on the west by New York, on the north by Massachusetts, and on the east by Rhode Island. The state capital and fourth largest city is Hartford, and other major cities and towns include Bridgeport, New Haven, Stamford, Waterbury, Norwalk, Danbury, New Britain, Greenwich, and Bristol. There are 169 incorporated towns in Connecticut, with cities and villages included within some towns.

The climate of New York (state) is generally humid continental, while the extreme southeastern portion of the state lies in the warmer humid subtropical climate zone. Winter temperatures average below freezing during January and February in much of the state of New York, but several degrees above freezing along the Atlantic coastline, including New York City.

The climate of Massachusetts is mainly a humid continental climate, with hot, humid summers, cold, snowy winters and abundant precipitation. Massachusetts is a state located in the New England region of the northeastern United States. Most of its population of 7 million live in the Boston metropolitan area. The eastern half of this relatively small state is mostly urban and suburban. Massachusetts is the most populous of the six New England states and ranks third in the nation by population density and fourth by GDP per capita. Massachusetts receives about 43 inches or 1,090 millimetres of rain annually, fairly evenly distributed throughout the years, slightly wetter during the winter. Summers are warm with average high temperatures in July above 80 °F or 26.7 °C and overnight lows above 60 °F or 15.6 °C common throughout the state. Winters are cold, but generally less extreme on the coast with high temperatures in the winter averaging above freezing even in January, although areas further inland are much colder. The state does have extreme temperatures from time to time with 100 °F or 37.8 °C in the summer and temperatures below 0 °F or −17.8 °C in the winter not being unusual.

The climate of Los Angeles is mild to hot year-round, and mostly dry. It is classified as borderline Mediterranean and semi-arid. The city is characterized by seasonal changes in rainfall—with a dry summer and a winter rainy season. Under the Köppen climate classification, the coastal areas are classified as BSh and Csb, while the inland areas are classified as BSh and Csa.

The climate of Miami is classified as having a tropical monsoon climate with hot and humid summers; short, warm winters; and a marked drier season in the winter. Its sea-level elevation, coastal location, position just above the Tropic of Cancer, and proximity to the Gulf Stream shape its climate.

The climate of New England varies greatly across its 500-mile (800 km) span from northern Maine to southern Connecticut.

The 2014–15 North American winter was frigid and prolifically wintry, especially across the eastern half of North America in the months of January–March. The season began early, with many places in North America experiencing their first wintry weather during mid-November. A period of below-average temperatures affected much of the contiguous United States, and several records were broken. An early trace of snowfall was recorded in Arkansas. There were greater accumulations of snow across parts of Oklahoma as well. A quasi-permanent phenomenon referred to as the polar vortex may have been partly responsible for the cold weather. Temperatures in much of the United States dropped 15 to 35 °F below average by November 19, following a southward "dip" of the polar vortex into the eastern two-thirds of the country. The effects of this dip were widespread, bringing about temperatures as low as 28 °F (−2 °C) in Pensacola, Florida. Following a significant snowstorm there, Buffalo, New York received several feet of snow from November 17–21. In addition, significant winter weather occurred throughout the season, including a major blizzard that struck the Northeastern United States at the end of January, another blizzard that affected much of the Northern United States days later in early February, and several significant snow events paired with very frigid temperatures for much of February.

The climate of Seattle is temperate, classified in the warm-summer (in contrast to hot-summer) subtype of the Mediterranean zone by the most common climate classification although some sources put the city in the oceanic zone. It has cool, wet winters and warm, dry summers, covering characteristics of both. The climate is sometimes characterized as a "modified Mediterranean" climate because it is cooler and wetter than a "true" Mediterranean climate, but shares the characteristic dry summer and the associated reliance upon cooler-season precipitation. The city is part of USDA hardiness zone 9a, with surrounding pockets falling under 8b.


