
Extreme weather includes unexpected, unusual, severe, or unseasonal weather; weather at the extremes of the historical distribution—the range that has been seen in the past. Extreme events are based on a location's recorded weather history. They are defined as lying in the most unusual ten percent. The main types of extreme weather include heat waves, cold waves and heavy precipitation or storm events, such as tropical cyclones. The effects of extreme weather events are economic costs, loss of human lives, droughts, floods, landslides. Severe weather is a particular type of extreme weather which poses risks to life and property.

A heat wave or heatwave, sometimes described as extreme heat, is a period of abnormally hot weather. A time period of five consecutive days is often used to define a heat wave but the exact definition of a heat waves can vary for different countries. A heat wave is usually measured relative to the usual climate in the area and to normal temperatures for the season. Temperatures that humans from a hotter climate consider normal, can be regarded as a heat wave in a cooler area. This would be the case if the warm temperatures are outside the normal climate pattern for that area. High humidity often occurs during heat waves as well. This is especially the case in oceanic climate countries. Heat waves have become more frequent, and more intense over land, across almost every area on Earth since the 1950s, the increase in frequency and duration being caused by climate change.
The July 1995 Chicago heat wave led to 739 heat-related deaths in Chicago over a period of five days. Most of the victims of the heat wave were elderly poor residents of the city, who did not have air conditioning, or had air conditioning but could not afford to turn it on, and did not open windows or sleep outside for fear of crime. The heat wave also heavily impacted the wider Midwestern region, with additional deaths in both St. Louis, Missouri and Milwaukee, Wisconsin.

The following table lists the highest and lowest temperatures recorded in the 50 U.S. states, the District of Columbia, and the 5 inhabited U.S. territories during the past two centuries, in both Fahrenheit and Celsius. If two dates have the same temperature record, only the most recent date is shown.

During the late afternoon and evening of April 2, 2006, a series of tornadoes broke out in the central United States. It was the second major outbreak of 2006, in the same area that suffered considerable destruction in a previous outbreak on March 11 and 12, as well as an outbreak on November 15, 2005. The most notable tornadoes of the outbreak struck northeastern Arkansas, the Missouri Bootheel, and West Tennessee, where several communities – including Marmaduke, Arkansas, Caruthersville, Missouri, and Newbern, Tennessee suffered devastating damage. In total, 66 tornadoes touched down across seven states, which is the most in a single day in 2006. In addition, there were over 850 total severe weather reports, including many reports of straight-line winds exceeding hurricane force and hail as large as softballs, which caused significant additional damage in a nine-state region.

The State of the Climate is an annual report that is primarily led by the National Oceanic and Atmospheric Administration National Climatic Data Center (NOAA/NCDC), located in Asheville, North Carolina, but whose leadership and authorship spans roughly 100 institutions in about 50 countries.

Minnesota has a humid continental climate, with hot summers and cold winters. Minnesota's location in the Upper Midwest allows it to experience some of the widest variety of weather in the United States, with each of the four seasons having its own distinct characteristics. The area near Lake Superior in the Minnesota Arrowhead region experiences weather unique from the rest of the state. The moderating effect of Lake Superior keeps the surrounding area relatively cooler in the summer and warmer in the winter, giving that region a smaller yearly temperature variation. On the Köppen climate classification, much of the southern third of Minnesota—roughly from the Twin Cities region southward—falls in the hot summer zone (Dfa), and the northern two-thirds of Minnesota falls in the warm summer zone (Dfb).
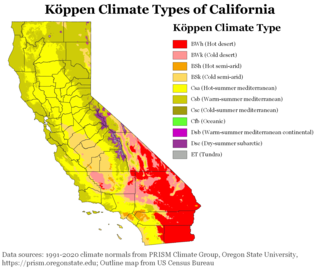
The climate of California varies widely from hot desert to alpine tundra, depending on latitude, elevation, and proximity to the Pacific Coast. California's coastal regions, the Sierra Nevada foothills, and much of the Central Valley have a Mediterranean climate, with warmer, drier weather in summer and cooler, wetter weather in winter. The influence of the ocean generally moderates temperature extremes, creating warmer winters and substantially cooler summers in coastal areas.
The 2007 North American heat wave started at the end of July and lasted into the first weeks of August. It was associated with severe drought over regions of the southeastern United States and parts of the Great Lakes region.

North Dakota's climate is typical of a continental climate with cold winters and warm-hot summers. The state's location in the Upper Midwest allows it to experience some of the widest variety of weather in the United States, and each of the four seasons has its own distinct characteristics. The eastern half of the state has a humid continental climate with warm to hot, somewhat humid summers and cold, windy winters, while the western half has a semi-arid climate with less precipitation and less humidity but similar temperature profiles. The areas east of the Missouri River get slightly colder winters, while those west of the stream get higher summer daytime temperatures. In general, the diurnal temperature difference is prone to be more significant in the west due to higher elevation and less humidity.

Washington is the northwesternmost state of the contiguous United States. It borders Idaho to the east, bounded mostly by the meridian running north from the confluence of the Snake River and Clearwater River, except for the southernmost section where the border follows the Snake River. Oregon is to the south, with the Columbia River forming the western part and the 46th parallel forming the eastern part of the Oregon–Washington border. During Washington's partition from Oregon, the original plan for the border followed the Columbia River east until the confluence with the Snake river, and then would have followed the Snake River east; this was changed to keep Walla Walla's fertile farmland in Washington.

The 1994 North American cold wave occurred over the midwestern and eastern regions of the United States and southern Canada in January 1994. The cold wave caused over 100 deaths in the United States. Two notable cold air events took place from January 18–19 and January 21–22. There were 67 minimum temperature records set on January 19. During this time, much of the United States experienced its coldest temperatures since a major storm on February 20, 1934.

The 2013–14 North American winter was one of the most significant for the United States, due in part to the breakdown of the polar vortex in November 2013, which allowed very cold air to travel down into the United States, leading to an extended period of very cold temperatures. The pattern continued mostly uninterrupted throughout the winter and numerous significant winter storms affected the Eastern United States, with the most notable one being a powerful winter storm that dumped ice and snow in the Southeastern United States and the Northeastern United States in mid-February. Most of the cold weather abated by the end of March, though a few winter storms did affect the Western United States towards the end of the winter.

Storm Data and Unusual Weather Phenomena (SD) is a monthly NOAA publication with comprehensive listings and detailed summaries of severe weather occurrences in the United States. Included is information on tornadoes, high wind events, hail, lightning, floods and flash floods, tropical cyclones (hurricanes), ice storms, snow, extreme temperatures such as heat waves and cold waves, droughts, and wildfires. Photographs of weather and attendant damage are used as much as possible. Maps of significant weather are also included.
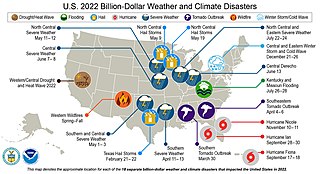
The following is a list of weather events that occurred on Earth in the year 2022. The year began with a La Niña. There were several natural disasters around the world from various types of weather, including blizzards, cold waves, droughts, heat waves, wildfires, floods, tornadoes, and tropical cyclones. The deadliest weather event of the year were the European heat waves, which killed over 26,000 people, 11,000 of which were in France. The costliest weather event of the year was Hurricane Ian, which caused at least $112.9 billion in damages in Florida and Cuba. Another significant weather event was the Pakistan floods, which killed 1,739 people and a total of $14.9 billion in damages.
Starting in May 2023, a heat wave affected Western North America. The heat wave entailed wildfires in Alberta, record temperatures across Canada and the US, and over 100 deaths in Mexico. The heat also accelerated snow melt in mountain ranges, causing flooding and mudslides. According to scientists, climate change increased the strength of the 2023 heatwaves including in North America.
The following is a list of weather events that occurred on Earth in the year 2003. The most common weather events to have a significant impact are blizzards, cold waves, droughts, heat waves, wildfires, floods, tornadoes, and tropical cyclones. The deadliest event of the year was a European heatwave that killed 72,210 people, which broke several nationwide temperature records.
