Climate of South Carolina

Last updated
Koppen climate types of South Carolina, using 1991-2020 climate normals. Koppen Climate Types South Carolina.png
Köppen climate types of South Carolina, using 1991-2020 climate normals.

South Carolina has a humid subtropical climate, with hot summers throughout most of the state. But, an exception does occur in the Blue Ridge Mountains, as outlier pockets of an Oceanic Climate do exist. Mild winters predominate in the eastern and southern part of the state, but cool to occasionally cold winters are the standard in the northwestern area of the state, especially areas at or above 600 feet in elevation. On average, between 40 and 80 inches (1,000 and 2,000 mm) of precipitation falls annually across the state, potentially even in excess of 100 inches in portions of the Appalachian temperate rainforest. Tropical cyclones, and afternoon thunderstorms due to hot and humid conditions, contribute to precipitation during the summer and sometimes fall months, while extratropical cyclones contribute to precipitation during the fall, winter, and spring months. The coast experiences nearly all of their tropical weather impacts from storms coming directly from the Atlantic coast. The northwestern area of the state can receive impacts from both Atlantic basin storms moving westward from the coast and also occasionally very heavy rainfall and flooding from storms originating from the Gulf of Mexico that move inland towards the northeast after making landfall from the Florida Panhandle to Louisiana.

Contents

Tornadoes happen mostly in the spring, with a secondary peak in November. Hail and damaging winds often occur in summertime thunderstorms. Tornadoes are very uncommon in the summer unless a tropical disturbance were to spawn one.

Temperatures

The USDA Hardiness Zones for South Carolina range from Zone 7A (0°F to 5°F) in the extreme northwest portion of the state, to Zone 9A (20°F to 25°F) along the southeastern coast.

South Carolina has a humid subtropical climate (Köppen climate classification Cfa), although high elevation areas in the "Upstate" area have less subtropical characteristics than areas on the Atlantic coastline. In the summer, South Carolina is hot and humid with temperatures during the day averaging near 90 °F (32 °C) across most of the state with overnight lows near 70 °F (21 °C). Winter temperatures are much less uniform. Coastal areas of the state have very mild winters with high temperatures averaging about 60 °F (16 °C) and overnight lows close to 38 °F (3 °C). Further inland in the Piedmont, temperatures average between 50 °F (10 °C) during the day and 32 °F (0 °C) at night.

EventMeasurementDateLocationCounty
Highest temperature [1] [2] 113 °F (45.0 °C)June 29, 2012 USC Columbia Richland
Lowest temperature [3] [4] −19 °F (−28.3 °C)January 21, 1985 Caesars Head Greenville

Precipitation

Annual average precipitation in South Carolina SCprecipitation.gif
Annual average precipitation in South Carolina

While precipitation is abundant the entire year in almost the entire state, the coastline tends to have a slightly wetter summer, while inland March tends to be the wettest month. During the cold season, extratropical cyclones is the main cause of precipitation, while during the summer, tropical cyclones and thunderstorms forming due to afternoon heating are the main causes of precipitation. A lee side rain shadow from the Appalachian Mountains lowers annual precipitation across central portions of the state. [5] Inland sections average 40 inches (1,000 mm) to 50 inches (1,300 mm) of rainfall, while near the coast 50 inches (1,300 mm) to 60 inches (1,500 mm), and the Piedmont receives 70 inches (1,800 mm) to 80 inches (2,000 mm) of precipitation. [6] Winter precipitation is determined in large by the El Niño-Southern Oscillation. During El Niño events, the jet stream is further south and east across the U.S., thus leading to cooler and wetter winters in South Carolina, while La Niña keeps the jet stream further north and west causing warmer and drier winters.

EventMeasurementDateLocationCounty
Most precipitation in a year for a single area123.45 inches (3,136 mm)2018 [7] Walhalla State Fish Hatchery Oconee
Least precipitation in a year for a single area22.69 inches (58 cm)[ citation needed ] ?
EventMeasurementDateLocationCounty
Greatest 24-hour rainfall [8] [9] [10] 14.80 inches (376 mm)September 16, 1999 Myrtle Beach Horry

Snowfall and ice

SCDOT Snow Plow in Columbia, February 2014 South Carolina Snow Plow.png
SCDOT Snow Plow in Columbia, February 2014
The SC Army National Guard assists in de-icing during Winter Storm Pax, 2014 2014 Southeastern Winter Storm Pax 140213-Z-XH297-006.jpg
The SC Army National Guard assists in de-icing during Winter Storm Pax, 2014

Annual snowfall across South Carolina varies greatly in frequency and amounts, from being quite rare with little to no accumulation in the southern coastal areas to being very common annually with 2 to 3 small snowfall events in the Upstate, particularly along and north of Interstate 85, which essentially is built along the 850 to 900 feet elevation contour. In the southern coastal area near and below Charleston, several years might pass without any measurable snowfall. In the Greenville, Spartanburg, and Anderson areas, total annual amounts range from 2 to 5 inches, with occasional annual totals reaching 8 or more inches (cumulatively). A year without at least one snow event in the Upstate is quite unusual. The Midlands is the least predictable area of the state in experiencing snowfall events. About 5 out of every 10 years, the region will have no snowfall at all; however in the 5 out of 10 years that the region receives snow, the accumulations are anywhere from under an inch to occasionally as much as 4 to 5 inches. The snowiest location in the state, above 2,000 feet in elevation, averages 12 inches (30 cm) of snow a year in the Blue Ridge Escarpment area. Freezing rain is more common than snow around and southeast of Columbia. Along the southern coastal barrier islands, frozen precipitation of any type is very rare, with only a few snow events on record.

EventMeasurementDateLocationCounty
Greatest 24-hour snowfall [11] 24 inches (61 cm)February 10–11, 1973 Rimini Clarendon
Most snowfall from one storm [12] 28.9 inches (73 cm)February 15–17, 1969 Caesars Head Greenville

Tropical cyclones

Hurricane Hugo (1989) Hugo 1989-09-21 1844Z.jpg
Hurricane Hugo (1989)

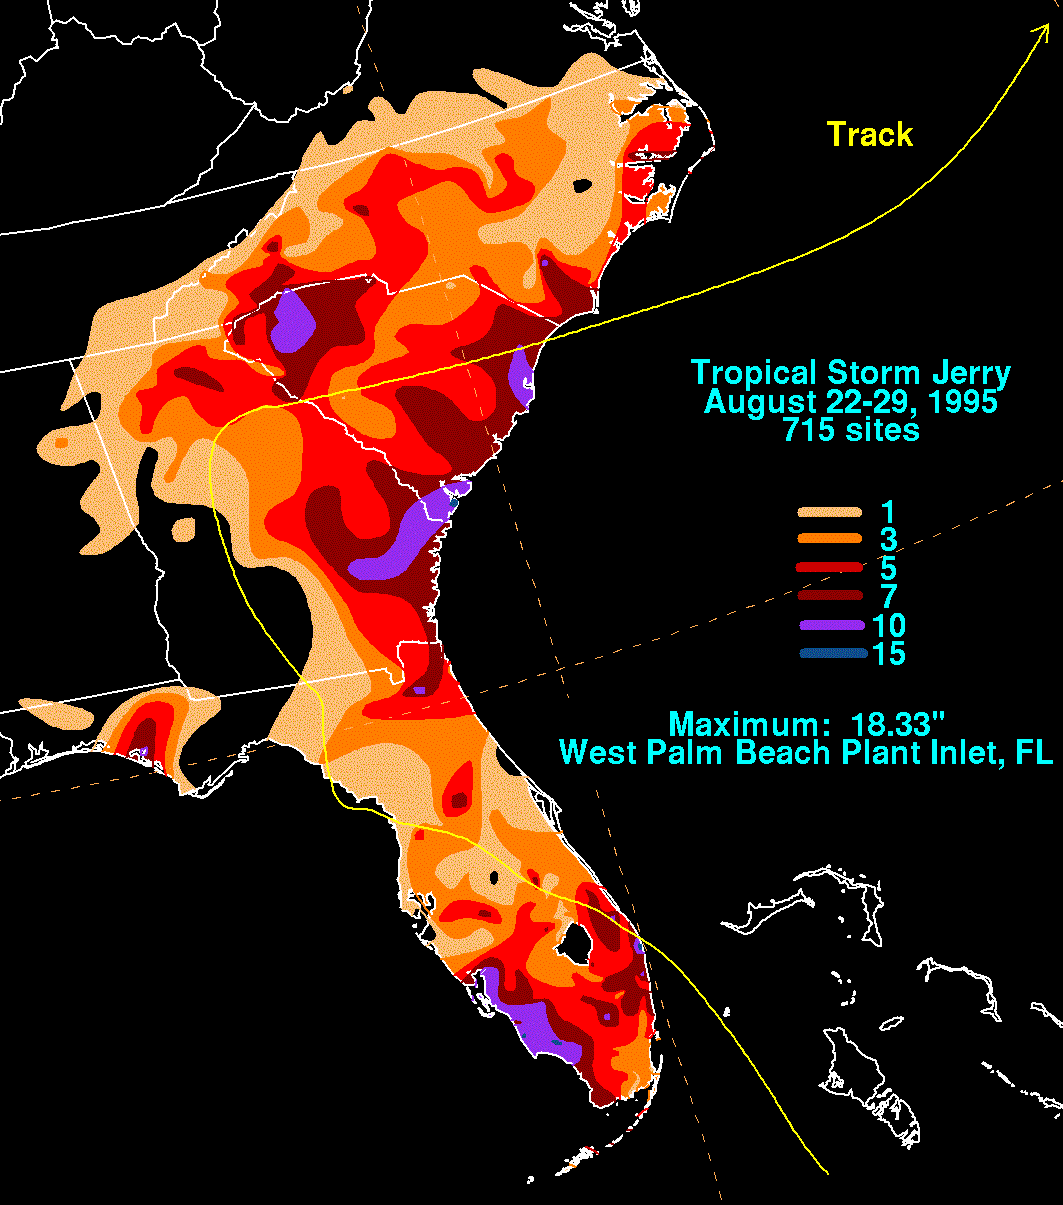
The state is prone to tropical cyclones. This is an annual concern during hurricane season, which is from June through November. The peak time of vulnerability for the southeast Atlantic coast is from early August to early October when tropical cyclone frequency is highest. [13] Major hurricanes can impact the Palmetto state, though there are no category 5 impacts on record. [14] Two of the stronger hurricanes to strike South Carolina in recent times are Hurricane Hazel (1954) and Hurricane Hugo (1989), which were of category 4 strength. For weaker systems, rainfall and spin-up tornadoes in the outer bands are the main impacts to the state. The wettest known tropical cyclone to impact South Carolina was a tropical depression named Jerry in 1995 which stalled nearby and had previously been a tropical storm across Florida. [15] Jerry brought nearly 19 inches (480 mm) of rainfall to upstate South Carolina. [16]

EventMeasurementDateLocationCounty
Wettest tropical cyclone [10] 17.00 inches (432 mm) Tropical Storm Jerry
(1995)
Antreville Abbeville

Thunderstorms and tornadoes

South Carolina averages around 64 days of thunderstorm activity per year. Most thunderstorms occur during the summer. South Carolina is vulnerable to tornadoes. Some notable tornadoes have struck South Carolina and the state averages around 14 tornadoes annually. [17] There have been no F-5/EF-5 tornadoes on record but over a dozen F-4/EF-4 tornadoes have occurred in many counties in South Carolina.

Monthly normals and extremes for select cities

Climate data for Greenville, South Carolina (Greenville–Spartanburg Int'l), 1991–2020 normals, [lower-alpha 1] extremes 1884–present [lower-alpha 2]
MonthJanFebMarAprMayJunJulAugSepOctNovDecYear
Record high °F (°C)82
(28)
81
(27)
91
(33)
94
(34)
100
(38)
105
(41)
107
(42)
105
(41)
101
(38)
98
(37)
86
(30)
79
(26)
107
(42)
Mean maximum °F (°C)70.3
(21.3)
73.2
(22.9)
81.2
(27.3)
85.8
(29.9)
90.6
(32.6)
95.1
(35.1)
97.3
(36.3)
95.9
(35.5)
92.1
(33.4)
85.1
(29.5)
77.0
(25.0)
70.6
(21.4)
98.3
(36.8)
Average high °F (°C)52.8
(11.6)
57.0
(13.9)
64.4
(18.0)
73.2
(22.9)
80.3
(26.8)
87.2
(30.7)
90.3
(32.4)
88.5
(31.4)
82.7
(28.2)
73.1
(22.8)
62.9
(17.2)
54.9
(12.7)
72.3
(22.4)
Daily mean °F (°C)42.5
(5.8)
45.9
(7.7)
52.8
(11.6)
61.0
(16.1)
68.9
(20.5)
76.3
(24.6)
79.7
(26.5)
78.4
(25.8)
72.5
(22.5)
61.7
(16.5)
51.6
(10.9)
44.8
(7.1)
61.3
(16.3)
Average low °F (°C)32.1
(0.1)
34.8
(1.6)
41.2
(5.1)
48.7
(9.3)
57.5
(14.2)
65.5
(18.6)
69.2
(20.7)
68.3
(20.2)
62.4
(16.9)
50.4
(10.2)
40.4
(4.7)
34.8
(1.6)
50.4
(10.2)
Mean minimum °F (°C)15.7
(−9.1)
20.3
(−6.5)
24.8
(−4.0)
33.5
(0.8)
43.7
(6.5)
56.3
(13.5)
63.0
(17.2)
61.6
(16.4)
50.6
(10.3)
35.1
(1.7)
26.1
(−3.3)
21.1
(−6.1)
13.7
(−10.2)
Record low °F (°C)−6
(−21)
−5
(−21)
11
(−12)
22
(−6)
27
(−3)
40
(4)
53
(12)
50
(10)
32
(0)
25
(−4)
11
(−12)
3
(−16)
−6
(−21)
Average precipitation inches (mm)4.12
(105)
3.84
(98)
4.48
(114)
4.04
(103)
4.07
(103)
3.90
(99)
4.82
(122)
4.66
(118)
3.73
(95)
3.59
(91)
3.84
(98)
4.58
(116)
49.67
(1,262)
Average snowfall inches (cm)1.6
(4.1)
1.0
(2.5)
0.6
(1.5)
0.0
(0.0)
0.0
(0.0)
0.0
(0.0)
0.0
(0.0)
0.0
(0.0)
0.0
(0.0)
0.0
(0.0)
0.1
(0.25)
0.6
(1.5)
3.9
(9.9)
Average precipitation days (≥ 0.01 in)10.49.410.29.79.710.812.011.18.07.18.510.0116.9
Average snowy days (≥ 0.1 in)1.10.70.30.00.00.00.00.00.00.00.10.42.6
Average relative humidity (%)65.862.662.160.768.570.574.075.675.870.968.267.768.5
Mean monthly sunshine hours 176.6182.7236.2264.7269.2270.8267.8253.9229.2235.2184.3169.42,740
Percent possible sunshine 56606468626261616267595562
Source: NOAA (relative humidity 1962–1990, sun 1961–1990) [18] [19] [20]
Climate data for Myrtle Beach (1991−2020 normals, extremes 1931–present)
MonthJanFebMarAprMayJunJulAugSepOctNovDecYear
Record high °F (°C)81
(27)
86
(30)
88
(31)
92
(33)
99
(37)
104
(40)
101
(38)
104
(40)
99
(37)
93
(34)
86
(30)
84
(29)
104
(40)
Average high °F (°C)55.5
(13.1)
57.8
(14.3)
63.7
(17.6)
71.5
(21.9)
78.8
(26.0)
84.5
(29.2)
87.4
(30.8)
86.5
(30.3)
83.0
(28.3)
75.6
(24.2)
66.4
(19.1)
58.6
(14.8)
72.4
(22.4)
Daily mean °F (°C)44.5
(6.9)
46.6
(8.1)
52.7
(11.5)
61.1
(16.2)
69.3
(20.7)
76.2
(24.6)
79.5
(26.4)
78.3
(25.7)
74.0
(23.3)
64.7
(18.2)
54.3
(12.4)
47.4
(8.6)
62.4
(16.9)
Average low °F (°C)33.6
(0.9)
35.5
(1.9)
41.8
(5.4)
50.6
(10.3)
59.7
(15.4)
67.9
(19.9)
71.6
(22.0)
70.0
(21.1)
65.0
(18.3)
53.8
(12.1)
42.2
(5.7)
36.3
(2.4)
52.3
(11.3)
Record low °F (°C)10
(−12)
9
(−13)
18
(−8)
25
(−4)
36
(2)
48
(9)
54
(12)
54
(12)
43
(6)
25
(−4)
16
(−9)
10
(−12)
9
(−13)
Average precipitation inches (mm)3.43
(87)
3.76
(96)
3.71
(94)
3.38
(86)
3.80
(97)
4.85
(123)
6.61
(168)
6.27
(159)
6.77
(172)
4.11
(104)
3.06
(78)
3.81
(97)
53.56
(1,360)
Source: NOAA [21] [22]
Climate data for Charleston Int'l, South Carolina (1991–2020 normals, [23] extremes 1938–present)
MonthJanFebMarAprMayJunJulAugSepOctNovDecYear
Record high °F (°C)83
(28)
87
(31)
90
(32)
95
(35)
101
(38)
103
(39)
104
(40)
105
(41)
99
(37)
94
(34)
88
(31)
83
(28)
105
(41)
Mean maximum °F (°C)76.7
(24.8)
78.7
(25.9)
84.2
(29.0)
88.0
(31.1)
93.0
(33.9)
96.4
(35.8)
97.7
(36.5)
96.6
(35.9)
92.9
(33.8)
87.4
(30.8)
82.2
(27.9)
77.2
(25.1)
98.9
(37.2)
Average high °F (°C)60.2
(15.7)
63.8
(17.7)
70.1
(21.2)
77.1
(25.1)
83.6
(28.7)
88.5
(31.4)
91.3
(32.9)
89.8
(32.1)
85.4
(29.7)
77.9
(25.5)
69.4
(20.8)
62.7
(17.1)
76.6
(24.8)
Daily mean °F (°C)49.5
(9.7)
52.7
(11.5)
58.7
(14.8)
65.8
(18.8)
73.3
(22.9)
79.4
(26.3)
82.5
(28.1)
81.4
(27.4)
76.9
(24.9)
67.8
(19.9)
58.3
(14.6)
52.2
(11.2)
66.5
(19.2)
Average low °F (°C)38.9
(3.8)
41.6
(5.3)
47.3
(8.5)
54.5
(12.5)
63.0
(17.2)
70.4
(21.3)
73.7
(23.2)
73.1
(22.8)
68.3
(20.2)
57.7
(14.3)
47.1
(8.4)
41.6
(5.3)
56.4
(13.6)
Mean minimum °F (°C)22.0
(−5.6)
26.2
(−3.2)
30.8
(−0.7)
39.7
(4.3)
50.2
(10.1)
61.7
(16.5)
68.2
(20.1)
66.4
(19.1)
57.0
(13.9)
41.7
(5.4)
31.7
(−0.2)
26.0
(−3.3)
20.3
(−6.5)
Record low °F (°C)6
(−14)
12
(−11)
15
(−9)
29
(−2)
36
(2)
50
(10)
58
(14)
56
(13)
42
(6)
27
(−3)
15
(−9)
8
(−13)
6
(−14)
Average precipitation inches (mm)3.37
(86)
3.05
(77)
3.35
(85)
3.29
(84)
3.32
(84)
6.21
(158)
6.60
(168)
6.97
(177)
6.01
(153)
4.33
(110)
2.66
(68)
3.35
(85)
52.51
(1,334)
Average snowfall inches (cm)0.2
(0.51)
0.1
(0.25)
0.0
(0.0)
0.0
(0.0)
0.0
(0.0)
0.0
(0.0)
0.0
(0.0)
0.0
(0.0)
0.0
(0.0)
0.0
(0.0)
0.0
(0.0)
0.0
(0.0)
0.3
(0.76)
Average precipitation days (≥ 0.01 in)8.98.58.27.98.112.113.213.110.27.36.99.3113.7
Average snowy days (≥ 0.1 in)0.10.10.00.00.00.00.00.00.00.00.00.00.2
Average relative humidity (%)69.867.468.167.572.575.176.678.978.274.172.771.672.7
Average dew point °F (°C)36.0
(2.2)
37.4
(3.0)
44.8
(7.1)
51.3
(10.7)
61.0
(16.1)
67.8
(19.9)
71.4
(21.9)
71.4
(21.9)
66.9
(19.4)
55.9
(13.3)
47.5
(8.6)
39.9
(4.4)
54.3
(12.4)
Mean monthly sunshine hours 179.3186.7243.9275.1294.8279.5287.8256.7219.7224.5189.5171.32,808.8
Percent possible sunshine 56616671696566625964605563
Average ultraviolet index 2.43.65.47.38.59.39.58.66.94.72.92.25.9
Source 1: NOAA (relative humidity and sun 1961–1990) [24] [25] [26]
Source 2: UV Index Today (1995 to 2022) [27]
Climate data for Charleston, South Carolina (Downtown), 1991–2020 normals, [23] extremes 1893–present
MonthJanFebMarAprMayJunJulAugSepOctNovDecYear
Record high °F (°C)82
(28)
83
(28)
94
(34)
94
(34)
100
(38)
104
(40)
103
(39)
103
(39)
100
(38)
95
(35)
87
(31)
81
(27)
104
(40)
Mean maximum °F (°C)72.4
(22.4)
74.8
(23.8)
80.0
(26.7)
83.8
(28.8)
90.1
(32.3)
93.4
(34.1)
95.3
(35.2)
93.9
(34.4)
90.8
(32.7)
85.2
(29.6)
79.2
(26.2)
74.3
(23.5)
96.8
(36.0)
Average high °F (°C)58.0
(14.4)
60.3
(15.7)
65.6
(18.7)
72.3
(22.4)
79.0
(26.1)
84.3
(29.1)
87.5
(30.8)
86.4
(30.2)
82.6
(28.1)
75.6
(24.2)
67.1
(19.5)
60.9
(16.1)
73.3
(22.9)
Daily mean °F (°C)50.8
(10.4)
53.2
(11.8)
58.8
(14.9)
66.0
(18.9)
73.5
(23.1)
79.2
(26.2)
82.3
(27.9)
81.4
(27.4)
77.6
(25.3)
69.4
(20.8)
60.1
(15.6)
53.8
(12.1)
67.2
(19.6)
Average low °F (°C)43.6
(6.4)
46.1
(7.8)
52.0
(11.1)
59.7
(15.4)
68.0
(20.0)
74.2
(23.4)
77.1
(25.1)
76.5
(24.7)
72.5
(22.5)
63.2
(17.3)
53.1
(11.7)
46.8
(8.2)
61.1
(16.2)
Mean minimum °F (°C)28.6
(−1.9)
32.3
(0.2)
37.2
(2.9)
46.1
(7.8)
56.3
(13.5)
67.1
(19.5)
71.7
(22.1)
70.8
(21.6)
63.4
(17.4)
48.6
(9.2)
38.9
(3.8)
33.1
(0.6)
26.9
(−2.8)
Record low °F (°C)10
(−12)
7
(−14)
22
(−6)
36
(2)
45
(7)
52
(11)
61
(16)
59
(15)
50
(10)
37
(3)
17
(−8)
12
(−11)
7
(−14)
Average precipitation inches (mm)2.56
(65)
2.56
(65)
3.03
(77)
2.96
(75)
2.58
(66)
4.85
(123)
5.08
(129)
6.11
(155)
5.25
(133)
4.07
(103)
2.30
(58)
2.91
(74)
44.26
(1,124)
Average precipitation days (≥ 0.01 in)8.48.07.97.06.810.511.611.78.66.86.18.5101.9
Source: NOAA [24] [28] [29]

Statewide climate data

Climate data for South Carolina
MonthJanFebMarAprMayJunJulAugSepOctNovDecYear
Record high °F (°C)88
(31)
89
(32)
99
(37)
99
(37)
106
(41)
113
(45)
110
(43)
110
(43)
111
(44)
103
(39)
93
(34)
89
(32)
113
(45)
Record low °F (°C)−19
(−28)
−11
(−24)
−8
(−22)
17
(−8)
28
(−2)
37
(3)
45
(7)
45
(7)
28
(−2)
16
(−9)
−1
(−18)
−6
(−21)
−19
(−28)
Source: "South Carolina Monthly Temperature Extremes".

Climate change

Climate change in South Carolina encompasses the effects of climate change, attributed to man-made increases in atmospheric carbon dioxide, in the U.S. state of South Carolina.

Studies show that South Carolina is among a string of "Deep South" states that will experience the worst effects of climate change. [30] According to the United States Environmental Protection Agency:

South Carolina's climate is changing. Most of the state has warmed by one-half to one degree (F) in the last century, and the sea is rising about one to one-and-a-half inches every decade. Higher water levels are eroding beaches, submerging low lands, and exacerbating coastal flooding. Like other southeastern states, South Carolina has warmed less than most of the nation. But in the coming decades, the region's changing climate is likely to reduce crop yields, harm livestock, increase the number of unpleasantly hot days, and increase the risk of heat stroke and other heat-related illnesses. [31]

As of January 2020, "South Carolina's failure to develop a comprehensive climate plan means the state has no overall effort to cut greenhouse gas pollution, limit sprawl or educate the public on how to adapt to the changing climate." [32]

See also

Notes

  1. Mean monthly maxima and minima (i.e. the expected highest and lowest temperature readings at any point during the year or given month) calculated based on data at said location from 1991 to 2020.
  2. Official records for Greenville kept April 1884 to 10 December 1941 at downtown, 11 December 1941 to 14 October 1962 at Greenville Downtown Airport, and at Greenville–Spartanburg Int'l near Greer since 15 October 1962. For more information, see Threadex

Related Research Articles

<span class="mw-page-title-main">Climate of Missouri</span>

Missouri generally has a variety of seasonal humid subtropical climate, with cool winters and long, hot summers. In the southern part of the state, particularly in the Bootheel, the climate borders on a more mild-type humid subtropical climate, and in the northern third, the state transitions into a humid continental climate. Because of its location in the interior United States, Missouri often experiences extremes in temperatures. Lacking either large mountains or oceans nearby to moderate its temperature, its climate is alternately influenced by air from the cold Arctic and the hot and humid Gulf of Mexico.

<span class="mw-page-title-main">Climate of Virginia</span> Overview of the climate of the U.S. state of Virginia

The climate of Virginia, a state on the east coast of the United States, is considered mild compared to more northern areas of the United States such as New England and the Midwest. Most of Virginia east of the Blue Ridge mountains, the southern part of the Shenandoah Valley, and the Roanoke Valley, has a humid subtropical climate. In the mountainous areas west of the Blue Ridge, the climate is warm-summer humid continental or oceanic climate. Severe weather, in the form of tornadoes, tropical cyclones, and winter storms, impacts the state on a regular basis. Central Virginia received significant snowfall of 20 inches in December 2009.

The climate of Salt Lake City, Utah features cold and snowy winters, hot and dry summers, and modest to light seasonal rainfall. Lying in the Salt Lake Valley, the city is surrounded by mountains and the Great Salt Lake. Under the Köppen climate classification, Salt Lake City has either a Mediterranean climate (Csa) or dry-summer continental climate (Dsa) depending on which variant of the system is used, though it borders on a cold semi-arid climate (BSk) due to the city's relatively low precipitation.

<span class="mw-page-title-main">Climate of Minneapolis–Saint Paul</span>

The climate of Minneapolis–Saint Paul is the long term weather trends and historical events of the Minneapolis–Saint Paul metropolitan area in east central Minnesota. Minneapolis and St. Paul, together known as the Twin Cities, are the core of the 15th largest metropolitan area in the United States. With a population of 3.6 million people, the region contains approximately 60% of the population of Minnesota. Due to its location in the northern and central portion of the U.S., the Twin Cities has the coldest average temperature of any major metropolitan area in the nation. Winters are very cold, summer is warm and humid, snowfall is common in the winter and thunderstorms with heavy rainfall occur during the spring, summer and autumn. Though winter can be cold, the area receives more sunlight hours in mid-winter than many other warmer parts of the country, including all of the Great Lakes states, the Pacific Northwest, parts of the South, and almost all of the Northeast. Unless otherwise indicated, all normals data presented below are based on data at Minneapolis/St. Paul International Airport, the official Twin Cities climatology station, from the 1981−2010 normals period.

<span class="mw-page-title-main">Climate of Puerto Rico</span> Predominantly tropical rainforest in the Köppen climate classification

The climate of Puerto Rico in the Köppen climate classification is predominantly tropical rainforest. Temperatures throughout the year are warm to hot, averaging near 85 °F (29 °C) in lower elevations and 70 °F (21 °C) in the mountains. Easterly trade winds pass across the island year round while the rainy season stretches from April into November. The relatively cool trade winds are blocked by the mountains of the Cordillera Central which causes rain shadows and sharp variations in the temperature and wind speed over short distances. About a quarter of the average annual rainfall for Puerto Rico occurs during tropical cyclones, which are more frequent during La Niña years.

<span class="mw-page-title-main">Climate of Minnesota</span> Climatic conditions of Minnesota

Minnesota has a humid continental climate, with hot summers and cold winters. Minnesota's location in the Upper Midwest allows it to experience some of the widest variety of weather in the United States, with each of the four seasons having its own distinct characteristics. The area near Lake Superior in the Minnesota Arrowhead region experiences weather unique from the rest of the state. The moderating effect of Lake Superior keeps the surrounding area relatively cooler in the summer and warmer in the winter, giving that region a smaller yearly temperature variation. On the Köppen climate classification, much of the southern third of Minnesota—roughly from the Twin Cities region southward—falls in the hot summer zone (Dfa), and the northern two-thirds of Minnesota falls in the warm summer zone (Dfb).

<span class="mw-page-title-main">United States rainfall climatology</span> Characteristics of weather in U.S.

The characteristics of United States rainfall climatology differ significantly across the United States and those under United States sovereignty. Summer and early fall bring brief, but frequent thundershowers and tropical cyclones which create a wet summer and drier winter in the eastern Gulf and lower East Coast. During the winter, and spring, Pacific storm systems bring Hawaii and the western United States most of their precipitation. Low pressure systems moving up the East Coast and through the Great Lakes, bring cold season precipitation to from the Midwest to New England, as well as Great Salt Lake. The snow to liquid ratio across the contiguous United States averages 13:1, meaning 13 inches (330 mm) of snow melts down to 1 inch (25 mm) of water.

<span class="mw-page-title-main">Climate of Florida</span> Climate

The climate of the north and central parts of the US state of Florida is humid subtropical. South Florida has a tropical climate. There is a defined rainy season from May through October when air mass thundershowers that build in the heat of the day drop heavy but brief summer rainfall.

<span class="mw-page-title-main">Climate of Texas</span> Overview of the climate of the U.S. state of Texas

Texas' weather varies widely, from arid in the west to humid in the east. The huge expanse of Texas encompasses several regions with distinctly different climates: Northern Plains, Trans-Pecos Region, Texas Hill Country, Piney Woods, and South Texas. Generally speaking, the part of Texas that lies to the east of Interstate 35 is subtropical, while the portion that lies to the west of Interstate 35 is arid desert.

<span class="mw-page-title-main">Climate of Georgia (U.S. state)</span> Overview of the climate of the U.S. state of Georgia

The climate of Georgia is a humid subtropical climate, with most of the state having short, mild winters and long, hot summers. The Atlantic Ocean on the east coast of Georgia and the hill country in the north impact the state's climate. Also, the Chattahoochee River divides Georgia into separate climatic regions with the mountain region to the northwest being cooler than the rest of the state; the average temperatures for the mountain region in January and July are 39 °F (4 °C) and 78 °F (26 °C) respectively. Winter in Georgia is characterized by mild temperatures and little snowfall around the state, with the potential for snow and ice increasing in the northern parts of the state. Summer daytime temperatures in Georgia often exceed 95 °F (35 °C). The state experiences widespread precipitation. Tornadoes and tropical cyclones are common.

<span class="mw-page-title-main">Climate of the United States</span> Varies due to changes in latitude, and a range of geographic features

The climate of the United States varies due to changes in latitude, and a range of geographic features, including mountains and deserts. Generally, on the mainland, the climate of the U.S. becomes warmer the further south one travels, and drier the further west, until one reaches the West Coast.

<span class="mw-page-title-main">Climate of North Carolina</span> Overview of the climate of the U.S. state of North Carolina

North Carolina's climate varies from the Atlantic coast in the east to the Appalachian Mountain range in the west. The mountains often act as a "shield", blocking low temperatures and storms from the Midwest from entering the Piedmont of North Carolina.

<span class="mw-page-title-main">Climate of Pennsylvania</span> Overview of the climate of the U.S. state of Pennsylvania

The climate of Pennsylvania is diverse due to the multitude of geographic features found within the state. Straddling two major climate zones, the southeastern corner of Pennsylvania has the warmest climate. A portion of Greater Philadelphia lies at the southernmost tip of the humid continental climate zone, with the city proper being in the humid subtropical climate zone. Still, Philadelphia features colder, snowier winters than most locations with a humid subtropical climate. Moving west toward the mountainous interior of the state, the climate becomes markedly colder, the number of cloudy days increases, and winter snowfall amounts are greater.

<span class="mw-page-title-main">Climate of Illinois</span>

The Climate of Illinois describes the weather conditions, and extremes, noted within the state of Illinois, United States, over time.

<span class="mw-page-title-main">Climate of New York (state)</span> Overview of the climate of the U.S. state of New York

The climate of New York (state) is generally humid continental, while the extreme southeastern portion of the state lies in the warmer humid subtropical climate zone. Winter temperatures average below freezing during January and February in much of the state of New York, but several degrees above freezing along the Atlantic coastline, including New York City.

<span class="mw-page-title-main">Climate of the Tampa Bay area</span>

The Tampa Bay area has a humid subtropical climate, closely bordering a tropical climate near the waterfront areas. There are two basic seasons in the Tampa Bay area, a hot and wet season from May through October, and a mild and dry season from November through April.

<span class="mw-page-title-main">Climate of Alabama</span> Overview of the climate of the U.S. state of Alabama

The state of Alabama is classified as humid subtropical (Cfa) under the Köppen climate classification. The state's average annual temperature is 64 °F (18 °C). Temperatures tend to be warmer in the state's southern portion with its proximity to the Gulf of Mexico, while its northern portions, especially in the Appalachian Mountains in the northeast, tend to be slightly cooler. Alabama generally has hot, humid summers and mild winters with copious precipitation throughout the year. The state receives an average of 56 inches (1,400 mm) of rainfall each year and experiences a lengthy growing season of up to 300 days in its southern portion. Hailstorms occur occasionally during the spring and summer here, but they are seldom destructive. Heavy fogs are rare, and they are confined chiefly to the coast. Thunderstorms also occur year-around. They are most common in the summer, but they are most commonly severe during the spring and late autumn. That is when destructive winds and tornadoes occur frequently, especially in the northern and central parts of the state. Central and northern Alabama are squarely within Dixie Alley, the primary area in the U.S. outside the Southern Plains with relatively high tornado risk. Alabama is ranked second in the U.S for the deadliest tornadoes. Hurricanes are quite common in the state, especially in the southern part. Major hurricanes occasionally strike the coast, such as Hurricane Frederic in September 1979 and Hurricane Ivan in September 2004; both storms resulted in significant to devastating damage in the Mobile area.

<span class="mw-page-title-main">Climate of New Jersey</span> Overview of the climate of the U.S. state of New Jersey

The climate of New Jersey classification of the U.S. state of New Jersey is humid subtropical in South Jersey with a humid continental climate in North Jersey, particularly in the northwestern area of the state. The northwest part of New Jersey is the snowiest due to the higher elevations that earn it a Dfb classification. During the winters, New Jersey can experience Nor'easters, which are snowstorms that affect the Northeastern United States, and Atlantic Canada. However, many would-be snow events in the state end up turning to rain due to warm ocean air being brought in by the storm. New Jersey's climate is shaped by its proximity to the Atlantic Ocean which provides moisture and moderates temperatures. According to climatology research by the U.S. National Oceanic and Atmospheric Administration, New Jersey has been the fastest-warming state by average air temperature over a 100-year period beginning in the early 20th century, related to global warming.

<span class="mw-page-title-main">Climate of Allentown, Pennsylvania</span> Overview of the climate of Allentown, Pennsylvania, United States

The climate of Allentown, Pennsylvania is classified as a humid continental climate. Allentown's warmest month is July with a daily average temperature of 74.7 °F (23.7 °C) and the coldest month being January with a daily average of 29.4 °F (−1.4 °C). The average precipitation of Allentown is 45.35 inches (1,152 mm) per year.

<span class="mw-page-title-main">Climate of New England</span> Overview of the climate of New England

The climate of New England varies greatly across its 500-mile (800 km) span from northern Maine to southern Connecticut.

References

  1. "South Carolina Record Maximum Temperatures and Date". South Carolina State Climatology Office. South Carolina Department of Natural Resources . Retrieved 4 February 2010.
  2. "Map of South Carolina Record Maximum Temperatures and Year". South Carolina State Climatology Office. South Carolina Department of Natural Resources . Retrieved 4 February 2010.
  3. "South Carolina Record Minimum Temperatures and Date". South Carolina State Climatology Office. South Carolina Department of Natural Resources . Retrieved 4 February 2010.
  4. "Map of South Carolina Record Minimum Temperatures and Year". South Carolina State Climatology Office. South Carolina Department of Natural Resources . Retrieved 4 February 2010.
  5. South Carolina State Climatology Office. South Carolina Climate. Retrieved on 2008-03-18.
  6. National Atlas.gov. Average annual precipitation for South Carolina. Archived 2008-08-16 at the Wayback Machine Retrieved on 2008-03-08.
  7. "New Record Annual Rainfall Total Set in South Carolina" . Retrieved 4 May 2019.
  8. "South Carolina Maximum 24-Hour Precipitation". South Carolina State Climatology Office. South Carolina Department of Natural Resources . Retrieved 5 May 2019.
  9. "South Carolina County 24-Hour Precipitation Records". South Carolina State Climatology Office. South Carolina Department of Natural Resources . Retrieved 5 May 2019.
  10. 1 2 "September 16, 1999". South Carolina State Climatology Office. South Carolina Department of Natural Resources . Retrieved 5 May 2019.
  11. "South Carolina Maximum 24-Hour Snow". South Carolina State Climatology Office. South Carolina Department of Natural Resources . Retrieved 4 February 2010.
  12. "South Carolina Historical Maximum Snowfall events". South Carolina State Climatology Office. South Carolina Department of Natural Resources . Retrieved 7 November 2011.
  13. National Hurricane Center. Graphic showing seasonal activity by date. Retrieved on 2008-03-18.
  14. Eric S. Blake, Edward N. Rappaport, and Chris Landsea. The Deadliest, Costliest, and Most Intense United States Tropical Cyclones From 1851 to 2006 (and other frequently requested hurricane facts).
  15. National Hurricane Center. Atlantic Hurricane Track Database. Retrieved on 2008-03-18.
  16. David M. Roth. Tropical Storm Jerry Color-Filled Rainfall Graphic. Retrieved on 2008-03-18.
  17. National Climatic Data Center. Annual average number of tornadoes. Retrieved on 2006-10-24.
  18. "NowData: NOAA Online Weather Data". National Oceanic and Atmospheric Administration . Retrieved May 14, 2021.
  19. "Station: Greer, SC". U.S. Climate Normals 2020: U.S. Monthly Climate Normals (1991–2020). National Oceanic and Atmospheric Administration. Retrieved May 14, 2021.
  20. "WMO Climate Normals for GREENVILLE/G-SPARTANBURG, SC 1961–1990". National Oceanic and Atmospheric Administration. Retrieved September 4, 2016.
  21. "NowData – NOAA Online Weather Data". National Oceanic and Atmospheric Administration. Retrieved May 14, 2021.
  22. "Station: Myrtle Beach, SC". U.S. Climate Normals 2020: U.S. Monthly Climate Normals (1991-2020). National Oceanic and Atmospheric Administration. Retrieved May 14, 2021.
  23. 1 2 Mean monthly maxima and minima (i.e. the expected highest and lowest temperature readings at any point during the year or given month) calculated based on data at said location from 1991 to 2020.
  24. 1 2 "NowData - NOAA Online Weather Data". National Oceanic and Atmospheric Administration . Retrieved May 5, 2021.
  25. "Summary of Monthly Normals 1991–2020". National Oceanic and Atmospheric Administration. Retrieved May 5, 2021.
  26. "WMO Climate Normals for CHARLESTON/MUNICIPAL, SC 19611990". National Oceanic and Atmospheric Administration. Retrieved May 5, 2021.
  27. "Historical UV Index Data - Charleston, SC". UV Index Today. Retrieved April 23, 2023.
  28. "Summary of Monthly Normals 1991–2020". National Oceanic and Atmospheric Administration. Retrieved May 5, 2021.
  29. "SC ACIS". Applied Climate Information System. Retrieved May 29, 2021.
  30. Meyer, Robinson (June 29, 2017). "The American South Will Bear the Worst of Climate Change's Costs". The Atlantic .
  31. "What Climate Change Means for South Carolina" (PDF). United States Environmental Protection Agency. August 2016.
  32. Fretwell, Sammy (January 26, 2020). "As heat rises, SC watches quietly. Will state suffer from lack of climate action?". The State . Archived from the original on 2020-01-26. Retrieved 2020-02-11.