Oconee County was named after a historic Cherokee town and the word "Ae-quo-nee", meaning "land beside the water." Oconee (Cherokee: ᎤᏊᏄ, romanized:Uquunu)[citation needed] town developed on the Cherokee trading path near present-day Oconee Station State Historic Site along Oconee Creek. The town was located along the Cherokee trading path of the early 18th century between the English colonial Atlantic port of Charleston and the Mississippi River to the west.
Oconee Town did not develop around an ancient platform mound like those built by ancestral peoples during the period of the Southern Appalachian Mississippian culture, approximately 1000CE to 1500CE. In their public architecture, the historic Cherokee built communal town houses around a central ceremonial pole and council house. The council house was a meeting place for the larger community and council. Through the centuries of their long occupancy, the Cherokee would replace the council house, and maintain and add to nearby mounds, building in distinctly colored layers of earth that are visible to archeologists.[4][5]
Due to its geographic position, the town was at the intersection of the trading path and the Cherokee treaty boundary of 1777. In 1792, the newly formed South Carolina State Militia built a frontier outpost near the town site, and named it Oconee Station.
European-American settlement in this far western area of the colony did not begin until the late eighteenth century. Most did not take place until decades after the American Revolutionary War. South Carolina jurisdictions were successively called parishes, counties, judicial districts and counties again. Oconee County was not created until 1868, after the American Civil War and during the Reconstruction era. It was taken from part of the Pickens District and named after Oconee Town.
Post-Revolutionary and 19th-century history
1780s - The rare American wildflower, Oconee Bell, was first recorded by French botanist André Michaux.
1780s - Colonel Benjamin Cleveland and a group of Revolutionary veterans received land grants from the state of Georgia (which then claimed this area according to their colonial charter), in lieu of payment for service, and settled in present-day Oconee County.
1787 - Georgia withdrew its claims to the land between the Tugaloo and Keowee rivers by the Treaty of Beaufort with South Carolina.
1816 - Under pressure from encroaching European Americans, the Cherokee sold their remaining South Carolina land.
1868 - Oconee County was formed by the state legislature dividing Pickens County. Walhalla was designated as the county seat.
1870 - Air Line Railroad built a railroad through the county; it stimulated development at stops known as Seneca and Westminster
1893 - Newry was established as a mill village to house workers of the Courtenay Manufacturing Company, a textile mill that produced cotton, wool, and other textile products.[6]
Present day
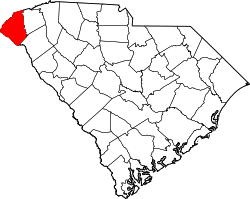
Current residents refer to Oconee County as the "Golden Corner" due to its status as South Carolina's most north-western county.[7]
Geography
Interactive map of Oconee County
According to the U.S. Census Bureau, the county has a total area of 673.57 square miles (1,744.5km2), of which 626.56 square miles (1,622.8km2) is land and 47.01 square miles (121.8km2) (6.98%) is water.[8] Three large man-made lakes provide residents with sport fishing, water skiing, and sailing as well as hydroelectric power. The largest lake is Lake Hartwell, built by the U.S. Army Corps of Engineers between 1955 and 1963. Lake Keowee is the second-largest lake and the Oconee Nuclear Station operates by the lake. Lake Jocassee is the third-largest and is a source of hydroelectric energy, but is also popular for its scenery and numerous waterfalls.
Bad Creek Reservoir, located in the mountains above Jocassee, is also used for generating electricity during peak hours. The water level can fall by tens of feet per hour and, during off-peak times, water is pumped back into the lake for the next peak period. Because of the dramatic changes in water level due to these uses, boating and swimming are prohibited in this reservoir.
As of the 2020 census, the county had a population of 78,607. The median age was 47.1 years. 19.1% of residents were under the age of 18 and 24.5% of residents were 65 years of age or older. For every 100 females there were 96.9 males, and for every 100 females age 18 and over there were 95.5 males age 18 and over.[16] There were 21,214 families residing in the county.[2]
There were 33,241 households in the county, of which 24.4% had children under the age of 18 living with them and 25.5% had a female householder with no spouse or partner present. About 27.7% of all households were made up of individuals and 13.0% had someone living alone who was 65 years of age or older.[16]
There were 40,788 housing units, of which 18.5% were vacant. Among occupied housing units, 75.0% were owner-occupied and 25.0% were renter-occupied. The homeowner vacancy rate was 1.8% and the rental vacancy rate was 9.7%.[16]
36.3% of residents lived in urban areas, while 63.7% lived in rural areas.[17]
Oconee County, South Carolina – racial and ethnic composition Note: the US Census treats Hispanic/Latino as an ethnic category. This table excludes Latinos from the racial categories and assigns them to a separate category. Hispanics/Latinos may be of any race.
At the 2010 census,[15] there were 74,273people, 30,676households, and 21,118families living in the county.[22] The population density was 118.6 inhabitantsper square mile (45.8 inhabitants/km2). There were 38,763 housing units at an average density of 61.9 unitsper square mile (23.9 units/km2).[23] The racial makeup of the county was 87.8% white, 7.6% black or African American, 0.6% Asian, 0.2% American Indian, 2.3% from other races, and 1.6% from two or more races. Those of Hispanic or Latino origin made up 4.5% of the population.[22] In terms of ancestry,[24]
Of the 30,676households, 28.2% had children under the age of 18 living with them, 53.8% were married couples living together, 11.2% had a female householder with no husband present, 31.2% were non-families, and 26.2% of all households were made up of individuals. The average household size was 2.40 and the average family size was 2.86. The median age was 43.4 years.[22]
The median income for a household in the county was $42,266 and the median income for a family was $52,332. Males had a median income of $40,943 versus $29,841 for females. The per capita income for the county was $24,055. About 11.8% of families and 16.6% of the population were below the poverty line, including 22.7% of those under age 18 and 9.4% of those age 65 or over.[25]
2000 census
At the 2000 census,[26] there were 66,215 people, 27,283 households, and 19,589 families living in the county. The population density was 106 peopleper square mile (41 people/km2). There were 32,383 housing units at an average density of 52 unitsper square mile (20 units/km2). The racial makeup of the county was 89.14% White, 8.38% Black or African American, 0.22% Native American, 0.35% Asian, 0.02% Pacific Islander, 1.06% from other races, and 0.82% from two or more races. 2.36% of the population were Hispanic or Latino of any race. 26.5% were of American, 13.1% Irish, 11.9% German and 10.5% English ancestry according to Census 2000.
There were 27,283 households, out of which 28.50% had children under the age of 18 living with them, 57.80% were married couples living together, 10.10% had a female householder with no husband present, and 28.20% were non-families. 24.70% of all households were made up of individuals, and 9.50% had someone living alone who was 65 years of age or older. The average household size was 2.40 and the average family size was 2.85.
In the county, the population was spread out, with 22.90% under the age of 18, 8.00% from 18 to 24, 27.40% from 25 to 44, 26.20% from 45 to 64, and 15.60% who were 65 years of age or older. The median age was 40 years. For every 100 females, there were 96.70 males. For every 100 females age 18 and over, there were 93.50 males.
The median income for a household in the county was $36,666, and the median income for a family was $43,047. Males had a median income of $31,032 versus $22,156 for females. The per capita income for the county was $18,965. About 7.60% of families and 10.80% of the population were below the poverty line, including 14.00% of those under age 18 and 12.90% of those age 65 or over.
Government and politics
A solidly Democratic county for much of its early history like the rest of the South, Oconee has since 1984 swung heavily into the Republican column. The Republican tilt in the county has been increasing in recent years, with 2016, 2020 and 2024 all breaking the record for the strongest Republican showing since Nixon's 1972 landslide.
United States presidential election results for Oconee County, South Carolina[27]
The Oconee region is mentioned in the song "Yankee Bayonet (I Will Be Home Then)" by the indie rock group the Decemberists, on their 2006 album The Crane Wife. The reference is "When I was a girl how the hills of Oconee made a seam to hem me in."
12"Oconee County"(PDF). Community Profiles (4000073). Columbia, SC: S.C. Department of Employment & Workforce - Business Intelligence Department. April 19, 2024.
This page is based on this Wikipedia article Text is available under the CC BY-SA 4.0 license; additional terms may apply. Images, videos and audio are available under their respective licenses.