Lexington County | |
---|---|
Motto: "Grow with us" | |
Coordinates: 33°54′N81°16′W / 33.90°N 81.27°W | |
Country | United States |
State | South Carolina |
Founded | 1785 |
Named for | Battle of Lexington and Concord |
Seat | Lexington |
Largest community | Lexington |
Area | |
• Total | 757.62 sq mi (1,962.2 km2) |
• Land | 699.00 sq mi (1,810.4 km2) |
• Water | 58.62 sq mi (151.8 km2) 7.74% |
Population (2020) | |
• Total | 293,991 |
• Estimate (2023) | 309,528 |
• Density | 390/sq mi (150/km2) |
Time zone | UTC−5 (Eastern) |
• Summer (DST) | UTC−4 (EDT) |
Congressional district | 2nd |
Website | www |
Lexington County is a county located in the U.S. state of South Carolina. As of the 2020 census, the population was 293,991. [1] Its county seat and largest community is Lexington. [2] The county was chartered in 1785 [3] and was named in commemoration of Lexington, Massachusetts, the site of the Battle of Lexington in the American Revolutionary War. [4] Lexington County is the sixth-most populous county in South Carolina by population and is part of the Columbia, SC Metropolitan Statistical Area. It is located in the Midlands region of South Carolina.
Lexington County was charted in 1785 and was named after the Battles of Lexington and Concord, fought at the outset of the American Revolutionary War.
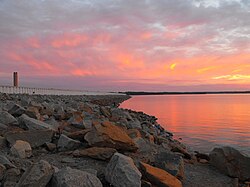
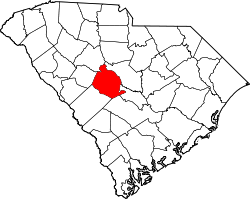
According to the U.S. Census Bureau, the county has a total area of 757.62 square miles (1,962.2 km2), of which 699.00 square miles (1,810.4 km2) is land and 58.62 square miles (151.8 km2) (7.74%) is water. [5] The largest body of water is Lake Murray, while other waterways include the Broad River, the Saluda River and the Congaree River. Lexington County has urban, suburban, and rural landscapes. Much of the county's urbanization is in its eastern and northeastern areas. The elevation in the county is 392 feet (119 m). [6]
Lexington County averages 47 inches (1,200 mm) of rain per year; the U.S. average is 38 inches (970 mm). The average snowfall is 1 inch (25 mm); the U.S. average is 28 inches (710 mm). The average number of days with any measurable precipitation is 103. [6]
On average, there are 218 sunny days per year in Lexington County. The July high is around 92.3 °F (33.5 °C) and the January low is 33.2 °F (0.7 °C). The comfort index rates the county a 7.3 out of 10, where higher is more comfortable. The U.S. average on the comfort index is a 7 out of 10. [6]
Census | Pop. | Note | %± |
---|---|---|---|
1810 | 6,641 | — | |
1820 | 8,083 | 21.7% | |
1830 | 9,065 | 12.1% | |
1840 | 12,111 | 33.6% | |
1850 | 12,930 | 6.8% | |
1860 | 15,579 | 20.5% | |
1870 | 12,988 | −16.6% | |
1880 | 18,564 | 42.9% | |
1890 | 22,181 | 19.5% | |
1900 | 27,264 | 22.9% | |
1910 | 32,040 | 17.5% | |
1920 | 35,676 | 11.3% | |
1930 | 36,494 | 2.3% | |
1940 | 35,994 | −1.4% | |
1950 | 44,279 | 23.0% | |
1960 | 60,726 | 37.1% | |
1970 | 89,012 | 46.6% | |
1980 | 140,353 | 57.7% | |
1990 | 167,611 | 19.4% | |
2000 | 216,014 | 28.9% | |
2010 | 262,391 | 21.5% | |
2020 | 293,991 | 12.0% | |
2023 (est.) | 309,528 | [1] | 5.3% |
U.S. Decennial Census [9] 1790–1960 [10] 1900–1990 [11] 1990–2000 [12] 2010 [13] 2020 [1] |
Race | Num. | Perc. |
---|---|---|
White (non-Hispanic) | 208,854 | 71.04% |
Black or African American (non-Hispanic) | 42,382 | 14.42% |
Native American | 894 | 0.3% |
Asian | 6,644 | 2.26% |
Pacific Islander | 185 | 0.06% |
Other/Mixed | 13,235 | 4.5% |
Hispanic or Latino | 21,797 | 7.41% |
As of the 2020 census, there were 293,991 people, 118,193 households, and 81,118 families residing in the county.
At the 2010 census, there were 262,391 people, 102,733 households, and 70,952 families living in the county. [15] The population density was 375.4 inhabitants per square mile (144.9 inhabitants/km2). There were 113,957 housing units at an average density of 163.0 units per square mile (62.9 units/km2). [16] The racial makeup of the county was 79.3% white, 14.3% black or African American, 1.4% Asian, 0.4% American Indian, 2.7% from other races, and 1.9% from two or more races. Those of Hispanic or Latino origin made up 5.5% of the population. [15] In terms of ancestry, 17.2% were German, 14.0% were American, 12.5% were English, and 11.8% were Irish. [17]
Of the 102,733 households, 34.5% had children under the age of 18 living with them, 51.4% were married couples living together, 13.0% had a female householder with no husband present, 30.9% were non-families, and 24.9% of all households were made up of individuals. The average household size was 2.53 and the average family size was 3.01. The median age was 37.9 years. [15]
The median income for a household in the county was $52,205 and the median income for a family was $64,630. Males had a median income of $44,270 versus $34,977 for females. The per capita income for the county was $26,393. About 8.5% of families and 11.1% of the population were below the poverty line, including 15.7% of those under age 18 and 8.4% of those age 65 or over. [18]
At the 2000 census, [19] there were 216,014 people, 83,240 households, and 59,849 families living in the county. The population density was 309 people per square mile (119 people/km2). There were 90,978 housing units at an average density of 130 units per square mile (50 units/km2). The racial makeup of the county was 84.18% White, 12.63% Black or African American, 0.34% Native American, 1.05% Asian, 0.04% Pacific Islander, 0.79% from other races, and 0.98% from two or more races. 1.92% of the population were Hispanic or Latino of any race.
There were 83,240 households, out of which 35.50% had children under the age of 18 living with them, 56.60% were married couples living together, 11.60% had a female householder with no husband present, and 28.10% were non-families. 22.50% of all households were made up of individuals, and 6.90% had someone living alone who was 65 years of age or older. The average household size was 2.56 and the average family size was 3.01.
In the county, 26.10% of the population was under the age of 18, 8.30% was from 18 to 24, 31.60% from 25 to 44, 23.80% from 45 to 64, and 10.20% was 65 years of age or older. The median age was 36 years. For every 100 females, there were 94.50 males. For every 100 females age 18 and over, there were 91.30 males.
The median income for a household in the county was $44,659, and the median income for a family was $52,637. Males had a median income of $36,435 versus $26,387 for females. The per capita income for the county was $21,063. About 6.40% of families and 9.00% of the population were below the poverty line, including 11.10% of those under age 18 and 9.30% of those age 65 or over.
Lexington County was one of the first areas of South Carolina to support the Republican Party. The last official Democratic candidate to carry the county at a presidential level was Franklin D. Roosevelt in 1944, and the official Democratic candidate last won 40 percent of the county's vote in 1952. It supported splinter Dixiecrat candidates in 1948 and 1956.
In the 2020 U.S. presidential election, Lexington County voted 64.2% in favor of Republican Donald Trump and 34.1% in favor of Democrat Joe Biden [20] with 72.6% of the eligible electorate voting. This was the strongest performance by a Democratic candidate for president since 1976. [21]
Year | Republican | Democratic | Third party(ies) | |||
---|---|---|---|---|---|---|
No. | % | No. | % | No. | % | |
2024 | 96,965 | 66.01% | 47,815 | 32.55% | 2,123 | 1.45% |
2020 | 92,817 | 64.20% | 49,301 | 34.10% | 2,450 | 1.69% |
2016 | 80,026 | 65.55% | 35,230 | 28.86% | 6,837 | 5.60% |
2012 | 76,662 | 68.07% | 34,148 | 30.32% | 1,813 | 1.61% |
2008 | 74,960 | 68.45% | 33,303 | 30.41% | 1,249 | 1.14% |
2004 | 67,132 | 71.85% | 25,393 | 27.18% | 907 | 0.97% |
2000 | 58,095 | 69.93% | 22,830 | 27.48% | 2,156 | 2.60% |
1996 | 39,658 | 63.23% | 18,907 | 30.15% | 4,155 | 6.62% |
1992 | 41,759 | 60.50% | 18,312 | 26.53% | 8,951 | 12.97% |
1988 | 41,467 | 77.89% | 11,366 | 21.35% | 405 | 0.76% |
1984 | 38,628 | 80.95% | 8,828 | 18.50% | 265 | 0.56% |
1980 | 28,313 | 67.60% | 12,334 | 29.45% | 1,239 | 2.96% |
1976 | 21,442 | 59.43% | 14,339 | 39.75% | 296 | 0.82% |
1972 | 25,327 | 84.75% | 4,069 | 13.62% | 490 | 1.64% |
1968 | 12,204 | 48.49% | 4,058 | 16.12% | 8,907 | 35.39% |
1964 | 12,041 | 71.47% | 4,807 | 28.53% | 0 | 0.00% |
1960 | 6,511 | 61.02% | 4,159 | 38.98% | 0 | 0.00% |
1956 | 1,188 | 20.71% | 2,094 | 36.50% | 2,455 | 42.79% |
1952 | 4,018 | 53.35% | 3,513 | 46.65% | 0 | 0.00% |
1948 | 58 | 2.03% | 566 | 19.78% | 2,237 | 78.19% |
1944 | 20 | 0.94% | 1,986 | 93.68% | 114 | 5.38% |
1940 | 17 | 1.12% | 1,496 | 98.88% | 0 | 0.00% |
1936 | 32 | 1.47% | 2,138 | 98.53% | 0 | 0.00% |
1932 | 5 | 3.40% | 141 | 95.92% | 1 | 0.68% |
1928 | 61 | 4.73% | 1,228 | 95.27% | 0 | 0.00% |
1924 | 7 | 0.50% | 1,395 | 99.36% | 2 | 0.14% |
1920 | 59 | 3.15% | 1,813 | 96.85% | 0 | 0.00% |
1916 | 31 | 1.43% | 2,060 | 95.15% | 74 | 3.42% |
1912 | 3 | 0.24% | 1,201 | 94.94% | 61 | 4.82% |
1908 | 80 | 3.09% | 2,508 | 96.87% | 1 | 0.04% |
1904 | 60 | 2.44% | 2,403 | 97.56% | 0 | 0.00% |
1900 | 30 | 2.25% | 1,302 | 97.75% | 0 | 0.00% |
1896 | 197 | 10.54% | 1,672 | 89.46% | 0 | 0.00% |
1892 | 71 | 4.43% | 1,287 | 80.39% | 243 | 15.18% |
The county's Republican bent is not limited to national politics; its voters frequently reject Democrats at the state level as well. The county has supported the Republican candidate for governor in every election since 1982 when Richard Riley carried every county in the state. [23] The last Democratic senatorial nominee to manage even 30 percent of the county's vote was Inez Tenenbaum in 2004, and no Democrat has carried the county since Ernest "Fritz" Hollings did so in 1980. In 1986, it was the only county in the state to support Hollings' Republican opponent, future Governor Henry McMaster. [24] It was one of the first areas where Republicans broke the long Democratic monopoly on state and local offices; today, longtime state senator Nikki Setzler is the only elected Democrat above the county level.
On November 4, 2014, Lexington County residents voted against a proposed sales tax increase. The money generated from this tax would have mostly been used to improve traffic conditions upon roadways. [25] That same day, residents voted to repeal a ban on alcohol sales on Sundays within the county. [26]
In 2015, long-time county sheriff James Metts pled guilty to charges of conspiring to harbor and conceal illegal aliens. Metts accepted bribes to keep undocumented immigrants out of federal databases. Metts had been sheriff since 1972. [27] [28] [29] [30]
In 2022, the GDP was $16.7 billion (about $53,814 per capita), [31] and the real GDP was $13.8 billion (about $44,563 per capita) in chained 2017 dollars. [32]
The Saxe Gotha Industrial Park near Cayce houses multiple distribution sites for major national companies, including Amazon, Chick-fil-A, The Home Depot and Nephron Pharmaceuticals. [33] [34] Near Lexington is the Michelin tire-production plant. Other manufacturers include Shaw Industries, Southeastern Freight Lines, and Flex, at which president Biden spoke in July 2023. [35] [36]
Industry | Employment Counts | Employment Percentage (%) | Average Annual Wage ($) |
---|---|---|---|
Accommodation and Food Services | 12,892 | 9.9 | 20,436 |
Administrative and Support and Waste Management and Remediation Services | 7,696 | 5.9 | 39,000 |
Agriculture, Forestry, Fishing and Hunting | 608 | 0.5 | 55,432 |
Arts, Entertainment, and Recreation | 956 | 0.7 | 23,140 |
Construction | 7,402 | 5.7 | 62,244 |
Educational Services | 10,238 | 7.9 | 50,596 |
Finance and Insurance | 3,276 | 2.5 | 73,736 |
Health Care and Social Assistance | 19,302 | 14.9 | 56,992 |
Information | 2,252 | 1.7 | 62,972 |
Management of Companies and Enterprises | 1,388 | 1.1 | 77,272 |
Manufacturing | 12,343 | 9.5 | 69,108 |
Mining, Quarrying, and Oil and Gas Extraction | 143 | 0.1 | 73,164 |
Other Services (except Public Administration) | 4,281 | 3.3 | 48,048 |
Professional, Scientific, and Technical Services | 4,951 | 3.8 | 71,032 |
Public Administration | 5,240 | 4.0 | 56,004 |
Real Estate and Rental and Leasing | 1,625 | 1.3 | 54,860 |
Retail Trade | 18,087 | 13.9 | 34,996 |
Transportation and Warehousing | 9,682 | 7.5 | 46,904 |
Utilities | 1,410 | 1.1 | 92,144 |
Wholesale Trade | 6,158 | 4.7 | 83,252 |
Total | 129,930 | 100.0% | 51,735 |
Rank | Employer | Employees |
---|---|---|
1 | Lexington Medical Center | 7,893 |
2 | Lexington School District 1 | 3,674 |
3 | Amazon | 3,050 |
4 | Wal-Mart | 2,603 |
5 | State government | 2,308 |
6 | Michelin | 2,240 |
7 | County of Lexington | 1,855 |
8 | Dominion Energy | 1,486 |
9 | Lexington School District 2 | 1,274 |
10 | Lexington School District Five | 1,136 |
The Columbia Metropolitan Airport serves as the main airport system for the greater Columbia area. In 2018, the airport served 1,197,603 passengers with 12,324 flights. Additionally, the airport is also the regional hub for UPS Airlines, transporting 136.7 million pounds of freight/mail in 2018. [39] The airport was named Lexington County Airport, and during World War II, trained pilots for B-25 Mitchell crews.
Public transportation in Lexington County is provided by the COMET, or officially the Central Midlands Regional Transit Authority (CMRTA). The bus system is the main public transit system for the greater Columbia area. In Lexington County, the bus system runs in the areas of West Columbia, Cayce, Irmo, Springdale, Seven Oaks, and Harbison. Additionally, COMET offers Dial-a-ride transit (DART), which provides personalized service passengers with disabilities. [40]
There are five school districts covering portions of the county. [41]
Public school district name | Enrollment | Teachers | Schools |
---|---|---|---|
Lexington County School District One [42] | 27,072 | 1,959 | 31 |
Lexington County School District Two [43] | 8,582 | 636 | 13 |
Lexington County School District Three [a] [44] | 2,020 | 160 | 4 |
Lexington County School District Four [45] | 3,245 | 224 | 6 |
Lexington & Richland County School District Five [b] [46] | 16,780 | 1,332 | 22 |
Colleges | Enrollment | Campuses | |
Midlands Technical College [c] | 15,000 [47] | 3 | |
Public libraries | Visitors (counted once) | Branches | |
Lexington County Public Library | 160,336 [47] | 10 |
The population ranking of the following table is based on the 2020 census of Lexington County. [48]
† = county seat
Rank | Name | Type | Population (2020 census) |
---|---|---|---|
1 | Columbia | City | 136,632 |
2 | † Lexington | Town | 23,568 |
3 | West Columbia | City | 17,416 |
4 | Seven Oaks | CDP | 14,652 |
5 | Cayce | City | 13,781 |
6 | Oak Grove | CDP | 12,899 |
7 | Irmo | Town | 11,569 |
8 | Red Bank | CDP | 10,924 |
9 | White Knoll | CDP | 7,858 |
10 | Batesburg-Leesville | Town | 5,270 |
11 | Springdale | Town | 2,744 |
12 | South Congaree | Town | 2,377 |
13 | Pine Ridge | Town | 2,167 |
14 | Chapin | Town | 1,809 |
15 | Gaston | Town | 1,608 |
16 | Edmund | CDP | 969 |
17 | Swansea | Town | 722 |
18 | Pelion | Town | 631 |
19 | Gilbert | Town | 571 |
20 | Fairview Crossroads | CDP | 540 |
21 | Summit | Town | 423 |
Saluda County is a county in the U.S. state of South Carolina. As of the 2020 census, the population was 18,862. Its county seat is Saluda. The county was formed from northern and eastern portions of Edgefield County.
Richland County is a county located in the U.S. state of South Carolina. As of the 2020 census, its population was 416,147, making it the second-most populous county in South Carolina, behind only Greenville County. The county seat and largest community is Columbia, the state capital. The county was established on March 12, 1785. Richland County is part of the Columbia, SC Metropolitan Statistical Area. In 2020, the center of population of South Carolina was located in Richland County, in the city of Columbia. The county is also the location of the geographic center of South Carolina, southeast of Columbia.
Orangeburg County is a county located in the U.S. state of South Carolina. As of the 2020 census, the population was 84,223. Its county seat is Orangeburg. The county was created in 1769.
Newberry County is a county located in the U.S. state of South Carolina. As of the 2020 census, its population was 37,719. Its county seat is Newberry. The name is of unknown origin, although one theory suggests that it was named by Quaker settlers in honor of their home of Newberry, a suburb of London in the United Kingdom. Newberry County comprises the Newberry, SC Micropolitan Statistical Area.
Calhoun County is a county in the U.S. state of South Carolina. As of the 2020 census, its population was 14,119, making it the fourth-least populous county in the state. Its county seat is St. Matthews. In terms of land area, it is also the smallest county in the state.
Cayce is a city in the U.S. state of South Carolina, along the Congaree River. The population was 12,528 at the 2010 census and rose to 13,789 in the 2020 United States Census, and it is the third-most populated municipality in Lexington County. The city is primarily in Lexington County, with additional, predominantly rural land to the east in Richland County. Cayce is part of the Columbia Metropolitan Statistical Area and is within South Carolina's Midlands region.
Gaston is a town in Lexington County, South Carolina, United States. The population was 1,645 at the 2010 census. It is part of the Columbia, South Carolina Metropolitan Statistical Area.
Lexington is the most populous town in and the county seat of Lexington County, South Carolina, United States. It is a suburb of the state capital, Columbia. The population was 23,568 at the 2020 Census, and it is the second-most populous municipality in the greater Columbia area. The 2022 estimated population is 24,626. According to the Central Midlands Council of Governments, the greater Lexington area had an estimated population of 111,549 in 2020 and is considered the fastest-growing area in the Midlands.
Red Bank is an unincorporated community and census-designated place (CDP) in Lexington County, South Carolina, United States. The population was 9,617 at the 2010 census, up from 8,811 at the 2000 census. It is part of the Columbia, South Carolina Metropolitan Statistical Area.
Seven Oaks is a census-designated place (CDP) in Lexington County, South Carolina, United States, 8 miles (13 km) northwest of downtown Columbia, the state capital. The population of the CDP was 15,144 at the 2010 census. It is part of the Columbia Metropolitan Statistical Area.
South Congaree is a town in Lexington County, South Carolina, United States. The population was 2,306 at the 2010 census. It is part of the Columbia, South Carolina Metropolitan Statistical Area.
West Columbia, formerly Brookland, is a city and commuter town in the suburban eastern sections of Lexington County, South Carolina, United States. According to the 2010 census, the population was 14,988, and the 2019 population estimate was 17,998. West Columbia is bordered to the east by Columbia, the state capital, across the Congaree River. It is near Columbia's city center or downtown district as well as the South Carolina State House and the Congaree Vista, known locally as "the Vista". The city is bordered to the south by its sister suburb, Cayce. A small portion of the city borders the town of Lexington to the east. West Columbia is part of the greater Columbia, SC metropolitan statistical area.
Eastover is a town in Richland County, South Carolina, United States. The population was 813 at the 2010 census, down from 830 in 2000. It is part of the Columbia, South Carolina, Metropolitan Statistical Area.
Ridge Spring is a town in Saluda County, South Carolina, United States. The population was 737 at the 2010 census. It is part of the Columbia, SC Metropolitan Statistical Area. The Mayor-Elect is Ms. Qwendolyn Etheredge.
Monetta is a town in Aiken and Saluda counties, South Carolina, United States. The population was 236 at the 2010 census.
Batesburg-Leesville is a town located in Lexington and Saluda counties, South Carolina, United States. The town's population was 5,362 as of the 2010 census and an estimated 5,415 in 2019.
Irmo is a town in Lexington and Richland counties, South Carolina, United States and a suburb of Columbia. It is part of the Columbia Metropolitan Statistical Area and is located 12 miles (19 km) northwest of the city center. The population of Irmo was 11,569 at the 2020 census.
The Congaree River is a short but wide river in South Carolina in the United States; It flows for approximately 53 miles (85 km). The river serves an important role as the final outlet channel for the entire Lower Saluda and Lower Broad watersheds, before merging with the Wateree River just north of Lake Marion to form the Santee River.
The Midlands region of South Carolina is the middle area of the state. The region's main center is Columbia, the state's capital. The Midlands is so named because it is halfway point between the Upstate and the Lowcountry. The main area code is 803.
As defined by the U.S. Office of Management and Budget, and used by the U.S. Census Bureau for statistical purposes only, the Columbia, SC Metropolitan Statistical Area, is an area consisting of six counties in central South Carolina, anchored by the city of Columbia. The current population has an estimation of 837,092. It is the second-largest metropolitan statistical area in the state of South Carolina, since the Anderson metropolitan statistical area was combined with Greenville's following the 2010 census.