Darlington County, South Carolina

Last updated

Darlington County, South Carolina
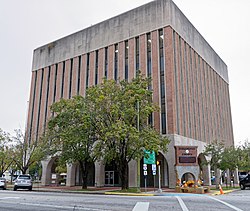
Courthouse Darlington County, SC, US.jpg
Darlington County Courthouse
Darlington County Seal.png
Motto(s): 
"Experience Darlington County, South Carolina, At The Speed Of Life"
Map of South Carolina highlighting Darlington County.svg
Location within the U.S. state of South Carolina
Darlington County, South Carolina
Interactive map of Darlington County, South Carolina
Coordinates: 34°20′N79°58′W / 34.33°N 79.96°W / 34.33; -79.96
CountryFlag of the United States.svg United States
StateFlag of South Carolina.svg South Carolina
Founded1785
Named after Unknown; possibly Darlington, England
Seat Darlington
Largest community Hartsville
Area
  Total
566.25 sq mi (1,466.6 km2)
  Land560.59 sq mi (1,451.9 km2)
  Water5.66 sq mi (14.7 km2)  1.00%
Population
 (2020)
  Total
62,905
  Estimate 
(2025)
62,888 Decrease2.svg
  Density112.21/sq mi (43.325/km2)
Time zone UTC−5 (Eastern)
  Summer (DST) UTC−4 (EDT)
Congressional district 7th
Website www.darcosc.com

Darlington County is a county in the U.S. state of South Carolina. As of the 2020 census, its population was 62,905. [1] Its county seat is Darlington. [2] Hartsville is the largest community in the county. Darlington County is home to the Darlington Raceway, which hosts the annual NASCAR Southern 500. Darlington County is also home to Coker College in Hartsville. Darlington County was named by an act in March 1785. Darlington County is included in the Florence, SC Metropolitan Statistical Area.

Contents

History

The county was founded in 1785. While no records exist regarding the namesake of the county, it could possibly be named after Darlington, England. The county seat is Darlington and the largest community is Hartsville.

Geography

According to the U.S. Census Bureau, the county has a total area of 566.25 square miles (1,466.6 km2), of which 560.59 square miles (1,451.9 km2) is land and 5.66 square miles (14.7 km2) (1.00%) is water. [3]

State and local protected areas/sites

Major water bodies

Adjacent counties

Major highways

Major infrastructure

Demographics

Historical population
CensusPop.Note
1800 7,631
1810 9,04718.6%
1820 10,94921.0%
1830 13,72825.4%
1840 14,8228.0%
1850 16,83013.5%
1860 20,36121.0%
1870 26,24328.9%
1880 34,48531.4%
1890 29,134−15.5%
1900 32,38811.2%
1910 36,02711.2%
1920 39,1268.6%
1930 41,4275.9%
1940 45,1989.1%
1950 50,01610.7%
1960 52,9285.8%
1970 53,4421.0%
1980 62,71717.4%
1990 61,851−1.4%
2000 67,3949.0%
2010 68,6811.9%
2020 62,905−8.4%
2025 (est.)62,888 [5] Decrease2.svg0.0%
U.S. Decennial Census [6]
1790–1960 [7] 1900–1990 [8]
1990–2000 [9] 2010 [10] 2020 [1]

Racial and ethnic composition

Darlington County, South Carolina – Racial and ethnic composition
Note: the US Census treats Hispanic/Latino as an ethnic category. This table excludes Latinos from the racial categories and assigns them to a separate category. Hispanics/Latinos may be of any race.
Race / Ethnicity (NH = Non-Hispanic)Pop 1980 [11] Pop 1990 [12] Pop 2000 [13] Pop 2010 [14] Pop 2020 [15] % 1980% 1990% 2000% 2010% 2020
White alone (NH)37,26036,79438,16137,99333,82159.41%59.49%56.62%55.32%53.77%
Black or African American alone (NH)24,75024,70727,97028,46325,38639.46%39.95%41.50%41.44%40.36%
Native American or Alaska Native alone (NH)16711251841360.03%0.11%0.19%0.27%0.22%
Asian alone (NH)40651422012900.06%0.11%0.21%0.29%0.46%
Native Hawaiian or Pacific Islander alone (NH)x [16] x [17] 564xx0.01%0.01%0.01%
Other race alone (NH)32329381280.05%0.00%0.04%0.06%0.20%
Mixed race or Multiracial (NH)x [18] x [19] 3046561,744xx0.45%0.96%2.77%
Hispanic or Latino (any race)6192116581,1401,3960.99%0.34%0.98%1.66%2.22%
Total62,71761,85167,39468,68162,905 100.00%100.00%100.00%100.00%100.00%

2020 census

As of the 2020 census, the county had a population of 62,905. The median age was 42.9 years. 21.9% of residents were under the age of 18 and 20.3% of residents were 65 years of age or older. For every 100 females there were 88.5 males, and for every 100 females age 18 and over there were 84.8 males age 18 and over. [20]

The racial makeup of the county was 54.2% White, 40.6% Black or African American, 0.3% American Indian and Alaska Native, 0.5% Asian, 0.0% Native Hawaiian and Pacific Islander, 1.1% from some other race, and 3.3% from two or more races. Hispanic or Latino residents of any race comprised 2.2% of the population. [21]

42.9% of residents lived in urban areas, while 57.1% lived in rural areas. [22]

There were 25,649 households in the county, of which 29.1% had children under the age of 18 living with them and 35.6% had a female householder with no spouse or partner present. About 29.7% of all households were made up of individuals and 14.2% had someone living alone who was 65 years of age or older. [20] Of those households, 17,344 were families. [20]

There were 29,379 housing units, of which 12.7% were vacant. Among occupied housing units, 70.3% were owner-occupied and 29.7% were renter-occupied. The homeowner vacancy rate was 1.8% and the rental vacancy rate was 10.2%. [20]

2010 census

At the 2010 census, there were 68,681 people, 26,531 households, and 18,552 families living in the county. [23] The population density was 122.4 inhabitants per square mile (47.3/km2). There were 30,297 housing units at an average density of 54.0 per square mile (20.8/km2). [24] The racial makeup of the county was 55.9% white, 41.6% black or African American, 0.3% Asian, 0.3% American Indian, 0.9% from other races, and 1.1% from two or more races. Those of Hispanic or Latino origin made up 1.7% of the population. [23] In terms of ancestry, 9.5% were American, 7.0% were English, and 5.3% were Irish. [25]

Of the 26,531 households, 34.1% had children under the age of 18 living with them, 44.0% were married couples living together, 20.5% had a female householder with no husband present, 30.1% were non-families, and 26.0% of all households were made up of individuals. The average household size was 2.54 and the average family size was 3.04. The median age was 39.6 years. [23]

The median income for a household in the county was $38,379 and the median income for a family was $46,894. Males had a median income of $40,089 versus $29,255 for females. The per capita income for the county was $20,096. About 14.6% of families and 20.0% of the population were below the poverty line, including 30.7% of those under age 18 and 15.1% of those age 65 or over. [26]

2000 census

At the 2000 census, [27] there were 67,394 people, 25,793 households, and 18,441 families living in the county. The population density was 120 inhabitants per square mile (46/km2). There were 28,942 housing units at an average density of 52 per square mile (20/km2). The racial makeup of the county was 56.98% White, 41.70% Black or African American, 0.19% Native American, 0.21% Asian, 0.01% Pacific Islander, 0.39% from other races, and 0.52% from two or more races. 0.98% of the population were Hispanic or Latino of any race.

There were 25,793 households, out of which 32.20% had children under the age of 18 living with them, 48.30% were married couples living together, 18.70% had a female householder with no husband present, and 28.50% were non-families. 25.10% of all households were made up of individuals, and 9.20% had someone living alone who was 65 years of age or older. The average household size was 2.57 and the average family size was 3.07.

In the county, the population was spread out, with 26.30% under the age of 18, 9.00% from 18 to 24, 28.20% from 25 to 44, 24.40% from 45 to 64, and 12.10% who were 65 years of age or older. The median age was 36 years. For every 100 females, there were 89.80 males. For every 100 females age 18 and over, there were 84.60 males.

The median income for a household in the county was $31,087, and the median income for a family was $37,662. Males had a median income of $30,947 versus $20,998 for females. The per capita income for the county was $16,283. About 16.40% of families and 20.30% of the population were below the poverty line, including 26.70% of those under age 18 and 22.10% of those age 65 or over.

According to the 2000 census, Darlington County was classified as 41% urban and 59% rural. It contains the two urbanized areas of Hartsville (2000 pop. 14,907) and Darlington (12,066). The county's population is included within the Florence, SC Metropolitan Statistical Area.
Government and politics

United States presidential election results for Darlington County, South Carolina [28]
Year Republican Democratic Third party(ies)
No.%No.%No.%
1900 836.32%1,23093.68%00.00%
1904 422.79%1,46497.21%00.00%
1912 00.00%88399.77%20.23%
1916 50.34%1,46299.46%30.20%
1920 181.41%1,26298.59%00.00%
1924 30.31%95698.96%70.72%
1928 484.06%1,13595.94%00.00%
1932 312.15%1,40997.78%10.07%
1936 120.60%1,99599.40%00.00%
1940 604.12%1,39595.88%00.00%
1944 462.33%1,80891.41%1246.27%
1948 1043.77%72626.30%1,93069.93%
1952 3,46337.72%5,71862.28%00.00%
1956 1,59722.47%2,90840.91%2,60336.62%
1960 3,49442.81%4,66857.19%00.00%
1964 6,71757.28%5,01042.72%00.00%
1968 4,94735.38%3,80327.20%5,23137.42%
1972 11,75672.04%4,41427.05%1490.91%
1976 6,67839.52%10,16560.16%540.32%
1980 8,28948.39%8,48949.55%3532.06%
1984 11,10058.70%7,45639.43%3541.87%
1988 9,85455.23%7,62542.73%3642.04%
1992 8,91244.00%9,09044.88%2,25111.11%
1996 8,22045.18%8,94349.15%1,0315.67%
2000 11,29051.64%10,25346.90%3201.46%
2004 13,41652.71%11,82946.47%2090.82%
2008 14,54449.58%14,50549.45%2850.97%
2012 14,43447.87%15,45751.27%2590.86%
2016 14,98950.51%13,88846.80%7972.69%
2020 16,83251.92%15,22046.95%3651.13%
2024 17,01756.10%12,97742.78%3371.11%

Economy

In 2022, the GDP of Darlington County was $3.3 billion (approx. $52,531 per capita). [29] In chained 2017 dollars, its real GDP was $2.7 billion (approx. $42,579 per capita). [30] Between 2022 and 2024, the unemployment rate has fluctuated between 2.4-4.2% within the county. [31]

As of April 2024, some of the largest employers in the county include Coker University, Duke Energy Progress Inc, Sonoco, and Walmart. [32]

Employment and Wage Statistics by Industry in Darlington County, South Carolina [32]
IndustryEmployment CountsEmployment Percentage (%)Average Annual Wage ($)
Accommodation and Food Services1,6548.117,212
Administrative and Support and Waste Management and Remediation Services1,0665.239,832
Agriculture, Forestry, Fishing and Hunting1500.734,424
Arts, Entertainment, and Recreation2771.418,304
Construction1,4006.953,872
Educational Services1,5777.740,248
Finance and Insurance3451.760,008
Health Care and Social Assistance2,80113.746,072
Information490.293,028
Management of Companies and Enterprises920.567,392
Manufacturing3,84918.986,164
Other Services (except Public Administration)5032.534,112
Professional, Scientific, and Technical Services3311.648,620
Public Administration1,4247.039,364
Real Estate and Rental and Leasing990.561,880
Retail Trade2,37011.630,992
Transportation and Warehousing9404.650,596
Utilities7363.6107,744
Wholesale Trade7403.673,684
Total20,403100.0%52,075

Communities

Cities

Towns

Census-designated places

Other unincorporated communities

Notable people

See also

References

  1. 1 2 "QuickFacts: Darlington County, South Carolina". United States Census Bureau. Retrieved March 22, 2024.
  2. "Find a County". National Association of Counties. Archived from the original on May 31, 2011. Retrieved June 7, 2011.
  3. "2020 County Gazetteer Files – South Carolina". United States Census Bureau. August 23, 2022. Retrieved September 10, 2023.
  4. 1 2 "SCDNR Public Lands". www2.dnr.sc.gov. Retrieved April 1, 2023.
  5. "County Population Totals and Components of Change: 2020-2025". United States Census Bureau. Retrieved August 21, 2025.
  6. "U.S. Decennial Census". United States Census Bureau. Retrieved March 17, 2015.
  7. "Historical Census Browser". University of Virginia Library. Archived from the original on December 26, 2013. Retrieved March 17, 2015.
  8. Forstall, Richard L., ed. (March 27, 1995). "Population of Counties by Decennial Census: 1900 to 1990". United States Census Bureau. Retrieved March 17, 2015.
  9. "Census 2000 PHC-T-4. Ranking Tables for Counties: 1990 and 2000" (PDF). United States Census Bureau. April 2, 2001. Archived (PDF) from the original on October 9, 2022. Retrieved March 17, 2015.
  10. "State & County QuickFacts". United States Census Bureau. Archived from the original on June 6, 2011. Retrieved November 23, 2013.
  11. "1980 Census of Population - General Population Characteristics- South Carolina - Table 15. Persons by Race and Table 16. Total Persons and Spanish Origin Persons by Type of Spanish Origin and Race". Hathi Trust . United States Census Bureau. p. 12-21.
  12. "1990 Census of Population - General Population Characteristics- South Carolina - Table 5 and Table 6. Race and Hispanic Origin: 1990" (PDF). United States Census Bureau . p. 11-37. Archived from the original (PDF) on October 9, 2024.
  13. "P004: Hispanic or Latino, and Not Hispanic or Latino by Race – 2000: DEC Summary File 1 – Darlington County, South Carolina". United States Census Bureau .
  14. "P2: Hispanic or Latino, and Not Hispanic or Latino by Race – 2010: DEC Redistricting Data (PL 94-171) – Darlington County, South Carolina". United States Census Bureau .
  15. "P2: Hispanic or Latino, and Not Hispanic or Latino by Race – 2020: DEC Redistricting Data (PL 94-171) – Darlington County, South Carolina". United States Census Bureau .
  16. included in the Asian category in the 1980 Census
  17. included in the Asian category in the 1990 Census
  18. not an option in the 1980 Census
  19. not an option in the 1990 Census
  20. 1 2 3 4 "2020 Decennial Census Demographic Profile (DP1)". United States Census Bureau. 2021. Retrieved December 20, 2025.
  21. "2020 Decennial Census Redistricting Data (Public Law 94-171)". United States Census Bureau. 2021. Retrieved December 20, 2025.
  22. "2020 Decennial Census Demographic and Housing Characteristics (DHC)". United States Census Bureau. 2023. Retrieved December 20, 2025.
  23. 1 2 3 "DP-1 Profile of General Population and Housing Characteristics: 2010 Demographic Profile Data". United States Census Bureau . Retrieved March 9, 2016.{{cite web}}: CS1 maint: deprecated archival service (link)
  24. "Population, Housing Units, Area, and Density: 2010 - County". United States Census Bureau . Retrieved March 9, 2016.{{cite web}}: CS1 maint: deprecated archival service (link)
  25. "DP02 SELECTED SOCIAL CHARACTERISTICS IN THE UNITED STATES – 2006-2010 American Community Survey 5-Year Estimates". United States Census Bureau . Retrieved March 9, 2016.{{cite web}}: CS1 maint: deprecated archival service (link)
  26. "DP03 SELECTED ECONOMIC CHARACTERISTICS – 2006-2010 American Community Survey 5-Year Estimates". United States Census Bureau . Retrieved March 9, 2016.{{cite web}}: CS1 maint: deprecated archival service (link)
  27. "U.S. Census website". United States Census Bureau . Retrieved May 14, 2011.
  28. Leip, David. "Dave Leip's Atlas of U.S. Presidential Elections". uselectionatlas.org. Retrieved March 13, 2018.
  29. U.S. Bureau of Economic Analysis (January 1, 2001). "Gross Domestic Product: All Industries in Darlington County, SC". FRED, Federal Reserve Bank of St. Louis. Retrieved May 1, 2024.
  30. U.S. Bureau of Economic Analysis (January 1, 2001). "Real Gross Domestic Product: All Industries in Darlington County, SC". FRED, Federal Reserve Bank of St. Louis. Retrieved May 1, 2024.
  31. U.S. Bureau of Labor Statistics (January 1, 1990). "Unemployment Rate in Darlington County, SC". FRED, Federal Reserve Bank of St. Louis. Retrieved May 1, 2024.
  32. 1 2 "Darlington County" (PDF). Community Profiles (4000031). Columbia, SC: S.C. Department of Employment & Workforce - Business Intelligence Department. April 19, 2024.
  33. "Veteran Tributes". veterantributes.org. Retrieved April 11, 2017.

Further reading