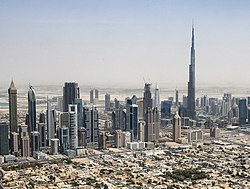
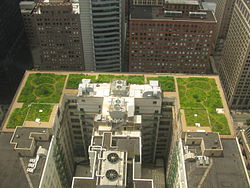
Example of dense urban living without green spaces which leads to a pronounced urban heat island effect (Milan, Italy)Example of an inner city green space, which can reduce the urban heat island effect (Central Park, New York)
The urban heat island (UHI) effect is a meteorological and climatological phenomenon in which urban areas experience significantly warmer temperatures than surrounding rural areas. The temperature difference is usually larger at night than during the day,[1] and is most apparent when winds are weak, under block conditions, noticeably during the summer and winter. The main cause of the UHI effect is from the modification of land surfaces, while waste heat generated by energy usage is a secondary contributor.[2][3][4] Urban areas occupy about 0.5% of the Earth's land surface but host more than half of the world's population.[5] As a population center grows, it tends to expand its area and increase its average temperature. The term heat island is also used; the term can be used to refer to any area that is relatively hotter than the surrounding, but generally refers to human-disturbed areas.[6]
Monthly rainfall is greater downwind of cities, partially due to the UHI. Increases in heat within urban centers increases the length of growing seasons, decreases air quality by increasing the production of pollutants such as ozone, and decreases water quality as warmer waters flow into area streams and put stress on their ecosystems.
Not all cities have a distinct urban heat island, and the heat island characteristics depend strongly on the background climate of the area where the city is located.[7] The impact in a city can significantly change based on its local environment. Heat can be reduced by tree cover and green space, which act as sources of shade and promote evaporative cooling.[8] Other options include green roofs, passive daytime radiative cooling applications, ventilation corridors, the use of lighter-colored surfaces, and less absorptive building materials. These reflect more sunlight and absorb less heat.[9][10][11]
Climate change is not the cause of urban heat islands, but it is causing more frequent and more intense heat waves, which in turn amplify the urban heat island effect in cities (see climate change and cities).[12]:993 Compact and dense urban development may also increase the urban heat island effect, leading to higher temperatures and increased exposure.[13]
Definition
A definition of urban heat island is: "The relative warmth of a city compared with surrounding rural areas."[14]:2926 This relative warmth is caused by "heat trapping due to land use, the configuration and design of the built environment, including street layout and building size, the heat-absorbing properties of urban building materials, reduced ventilation, reduced greenery and water features, and domestic and industrial heat emissions generated directly from human activities".[14]:2926
Description
Mechanism of the urban heat island effect: the densely-built downtown areas tend to be warmer than suburban residential areas or rural areas. Tokyo, an example of an urban heat island. Normal temperatures of Tokyo go up higher than those of the surrounding area.
Diurnal variability
Cities often experience stronger urban heat island effects at night; effects can vary with location and topography of metropolitan areas.
Throughout the daytime, particularly when the skies are cloudless, urban surfaces are warmed by the absorption of solar radiation. Surfaces in the urban areas tend to warm faster than those of the surrounding rural areas. By virtue of their high heat capacities, urban surfaces act as a reservoir of heat energy. For example, concrete can hold roughly 2,000 times as much heat as an equivalent volume of air.[15] "This study shows that urban surfaces such as concrete absorb and store large amounts of heat during the day, confirming the high heat capacity effect described in urban heat islands." As a result, high daytime surface temperatures within the UHI can be easily seen via thermal remote sensing. As is often the case with daytime heating, this warming also has the effect of generating convective winds within the urban boundary layer. At night, the situation reverses. The absence of solar heating leads to the decrease of atmospheric convection and the stabilization of urban boundary layer. If enough stabilization occurs, an inversion layer is formed. This traps urban air near the surface, keeping surface air warm from the still-warm urban surfaces, resulting in warmer nighttime air temperatures within the UHI.
Generally speaking, the difference in temperature between the urban and surrounding rural area is more pronounced at night than in daytime.[16] For example, in the United States, the temperature in urban areas tends to be warmer than the surrounding area by about 1–7 °F (0.55–3.9 °C) during the daytime, and about 2–5 °F (1.1–2.8 °C) warmer at night.[17] However, the difference is more pronounced during the day in arid climates such as those in southeastern China and Taiwan.[18][19] Studies have shown that diurnal variability is impacted by several factors including local climate and weather, seasonality, humidity, vegetation, surfaces, and materials in the built environment.[20][17][21][22]
Seasonal variability
Seasonal variability is less well understood than diurnal variability of the urban heat island temperature difference.[23] Complex relationships between precipitation, vegetation, solar radiation, and surface materials in various local climate zones play interlocking roles that influence seasonal patterns of temperature variation in a particular urban heat island.[23][24][25][26]
Measurements and predictions
Urban Heat Island Index (UHII)
One method to quantify the UHI effect within urban areas is the UHI Index created by the Californian EPA in 2015. It compares the temperature of a surveyed area and rural reference points upwind from the surveyed area, at a height of two meters above ground level. The difference in temperature in degrees Celsius is taken hourly and differences with an increased urban temperature compared to the reference points are summed up, creating an amount of degree-Celsius-hours, which is the UHI Index of the surveyed area. The measure of Celsius-hours might be averaged over many days, but is specified as Celsius-hours per averaged day.[27][28][29]
The index was created to estimate the expected use of air conditioning and resulting greenhouse gas emissions in California.[28] The index does not consider values of or differences in wind-speed, humidity, or solar influx, which might influence perceived temperature or the operation of air conditioners.[29]
Models and simulations
If a city or town has a good system of taking weather observations the UHI can be measured directly.[30] An alternative is to use a complex simulation of the location to calculate the UHI, or to use an approximate empirical method.[31][32] Such models allow the UHI to be included in estimates of future temperatures rises within cities due to climate change.
Leonard O. Myrup published the first comprehensive numerical treatment to predict the effects of the urban heat island (UHI) in 1969.[33] The heat island effect was found to be the net result of several competing physical processes. In general, reduced evaporation in the city center and the thermal properties of the city building and paving materials are the dominant parameters.[33] Modern simulation environments include ENVI-met, which simulates all interactions between building and ground surfaces, plants and ambient air.[34]
Causes
High-rise buildings of Manhattan, an example of dense urban livingThermal (top) and vegetation (bottom) locations around New York City via infrared satellite imagery. A comparison of the images shows that where vegetation is dense, temperatures are lower.
There are several causes of an urban heat island (UHI) related to common urban design aspects. For example, dark surfaces absorb significantly more solar radiation, which causes urban concentrations of roads and buildings to heat more than suburban and rural areas during the day;[2] materials commonly used in urban areas for pavement and roofs, such as concrete and asphalt, have significantly different thermal bulk properties (including heat capacity and thermal conductivity) and surface radiative properties (albedo and emissivity) than the surrounding rural areas. This causes a change in the energy budget of the urban area, often leading to higher temperatures than surrounding rural areas.[35]
Pavements, parking lots, roads or, more generally speaking transport infrastructure, contribute significantly to the urban heat island effect.[36] For example, pavement infrastructure is a main contributor to urban heat during summer afternoons in Phoenix, United States.[36]
Another major reason is the lack of evapotranspiration (for example, through lack of vegetation) in urban areas.[37] The U.S. Forest Service found in 2018 that cities in the United States are losing 36 million trees each year.[38] With a decreased amount of vegetation, cities also lose the shade and evaporative cooling effect of trees.[39][40]
Other causes of a UHI are due to geometric effects. The tall buildings within many urban areas provide multiple surfaces for the reflection and absorption of sunlight, increasing the efficiency with which urban areas are heated. This is called the "urban canyon effect". Another effect of buildings is the blocking of wind, which also inhibits cooling by convection and prevents pollutants from dissipating. Waste heat from automobiles, air conditioning, industry, and other sources also contributes to the UHI.[4][41][42]
Heat islands can be affected by proximity to different types of land cover, so that proximity to barren land causes urban land to become hotter and proximity to vegetation makes it cooler.[43]
Air pollution
High levels of air pollution in urban areas can also increase the UHI, as many forms of pollution change the radiative properties of the atmosphere.[35] UHI not only raises urban temperatures but also increases ozone concentrations because ozone is a greenhouse gas whose formation will accelerate with the increase of temperature.[44]
Climate change is not a cause but an amplifier of the urban heat island effect. The IPCC Sixth Assessment Report from 2022 summarized the available research accordingly: "Climate change increases heat stress risks in cities [...] and amplifies the urban heat island across Asian cities at 1.5°C and 2°C warming levels, both substantially larger than under present climates [...]."[45]:66
The report goes on to say: "In a warming world, increasing air temperature makes the urban heat island effect in cities worse. One key risk is heatwaves in cities that are likely to affect half of the future global urban population, with negative impacts on human health and economic productivity."[12]:993
There are unhelpful interactions between heat and built infrastructure: These interactions increase the risk of heat stress for people living in cities.[12]:993
Increased urbanization
Increased urbanization is a major leading cause for increased urban heat risks, as it replaces vegetated areas with impervious surfaces and concentrates people into smaller land areas.[46]
Spatial distribution
Historic urbanization processes, such as redlining in the United States, have lasting impacts on land use and may perpetuate disparities in urban heat through unequal distribution of vegetation.[47][48] Access to healthcare, public transportation, adequate housing, and reliable energy typically govern disparities to heat, of which many of these communities may lack access to.[48] Such differences in spatial distribution leave certain, localized neighborhood at risk for micro urban heat islands.[49] Socially vulnerable groups are known to live in more densely populated areas with little vegetation that in turn have higher threats to heat exposure and often have adapting to and mitigation their exposure.[49]
Housing conditions
Housing conditions are a factor that contributes to urban heat inequity. Living on the top-floor, having a home with a dark roof, and poor insulation exacerbate heating conditions during hot weather.[50] Lower income individuals may also not have access to air-conditioning or be unable to afford the increased electricity usage.[50] In condensed cities, opening the windows for airflow and cooler air could introduce air pollution and odor into the home.[50] High-density housing is Asia often has constraints on building updates that promote cooling.[50]
Space poverty
Another contributor to inequality is space poverty, which refers to a significantly reduced indoor residential space in a home.[50] Space poverty is a significant issue in Hong Kong, where low-income individuals live in extremely small, sub-divided units, which has led to overcrowding and indoor air pollution.[50] The units promote little movement, and all furniture, kitchen appliances, and bathroom necessities must fit into one sub-divided room.[50] These units are typically developed from derelict buildings that have poor ventilation and less access to proper space cooling.[50] High-density housing is Asia often has constraints on building updates that promote cooling, and residents often lack the space and authority to complete any improvements to their condition.[50] These residents typically seek out adequate third places, such as libraries, parks, and cafés, to access proper cooling and space.[50]
Aside from the effect on temperature, UHIs can produce secondary effects on local meteorology, including the altering of local wind patterns, the development of clouds and fog, the humidity, and the rates of precipitation.[51] The extra heat provided by the UHI leads to greater upward motion, which can induce additional shower and thunderstorm activity. In addition, the UHI creates during the day a local low pressure area where relatively moist air from its rural surroundings converges, possibly leading to more favorable conditions for cloud formation.[52] Rainfall rates downwind of cities are increased between 48% and 116%. Partly as a result of this warming, monthly rainfall is about 28% greater between 20 and 40 miles (32 and 64km) downwind of cities, compared with upwind.[53] Some cities show a total precipitation increase of 51%.[54]
One study concluded that cities change the climate in area two–four times larger than their own area.[55] One 1999 comparison between urban and rural areas proposed that urban heat island effects have little influence on global mean temperature trends.[56] Others suggested that urban heat islands affect global climate by impacting the jet stream.[57]
Image of Atlanta, Georgia, showing temperature distribution, with blue showing cool temperatures, red warm, and hot areas appear white
UHIs have the potential to directly influence the health and welfare of urban residents. As UHIs are characterized by increased temperature, they can potentially increase the magnitude and duration of heat waves within cities. The number of individuals exposed to extreme temperatures is increased by the UHI-induced warming.[58] The nighttime effect of UHIs can be particularly harmful during a heat wave, as it deprives urban residents of the cool relief found in rural areas during the night.[59] Exposure to extreme urban heat can increase the risk of heat-related illnesses and mortality, particularly among elderly populations.[60]
Extreme heat is the deadliest form of weather in the U.S. Per a study by Professor Terri Adams-Fuller, heat waves kill more people in the U.S. than hurricanes, floods, and tornadoes combined.[62] These heat illnesses are more common within medium-to-large metro areas than the rest of the U.S., largely in part due to UHIs. Heat illnesses can also be compounded when combined with air pollution which is common in many urban areas.
Heat exposure can have adverse effects on mental health. Increases in temperature can contribute to increased aggression, as well as more cases of domestic violence and substance abuse.[63] Greater heat can also negatively impact school performance and education. According to a study by Hyunkuk Cho of Yeungnam University, an increased number of days with extreme heat each year correlates to a decrease in student test scores.[64]
High UHI intensity correlates with increased concentrations of air pollutants that gathered at night, which can affect the next day's air quality.[65] These pollutants include volatile organic compounds, carbon monoxide, nitrogen oxides, and particulate matter.[66] The production of these pollutants combined with the higher temperatures in UHIs can quicken the production of ozone.[65] Ozone at surface level is considered to be a harmful pollutant.[65] Studies suggest that increased temperatures in UHIs can increase polluted days but also note that other factors (e.g. air pressure, cloud cover, wind speed) can also have an effect on pollution.[65]
Studies from Hong Kong have found that areas of the city with poorer outdoor urban air ventilation tended to have stronger urban heat island effects[67] and had significantly higher all-cause mortality[68] compared to areas with better ventilation. Another study employing advanced statistical methods in Babol city, Iran, revealed a significant increase in Surface Urban Heat Island Intensity (SUHII) from 1985 to 2017, influenced by both geographic direction and time. This research, enhancing the understanding of SUHII's spatial and temporal variations, emphasizes the need for precise urban planning to mitigate the health impacts of urban heat islands.[69] Surface UHI's are more prominent during the day and are measured using the land surface temperature and remote sensing.[70]
Heat stress vulnerability refers to an individual's predisposition, typically due to demographic factors, to be negatively impacted by heat.[50] The measurement takes into account daily routines, location, sensitivity due to demographic factors, including age.[50] Some demographic groups known to have higher heat stress vulnerability include the elderly, women, children, low-income households, and those who are chronically ill.[50] Elderly populations are included because they are often unable to regular their body temperatures and typically have pre-existing medical conditions that make them more susceptible to heat.[50] Children are also sensitive to increased heat, which may cause stress on their developing bodies.[50] Intensified indoor heat causes stress on the mind and body and strains domestic relations.[50]
On water bodies and aquatic organisms
UHIs also impair water quality. Hot pavement and rooftop surfaces transfer their excess heat to stormwater, which then drains into storm sewers and raises water temperatures as it is released into streams, rivers, ponds, and lakes. Additionally, increased urban water body temperatures lead to a decrease in biodiversity in the water.[71] For example, in August 2001, rains over Cedar Rapids, Iowa led to a 10.5°C (18.9°F) rise in the nearby stream within one hour, resulting in a fish kill which affected an estimated 188 fish.[72] Since the temperature of the rain was comparatively cool, the deaths could be attributed to the hot pavement of the city. Similar events have been documented across the American Midwest, as well as Oregon and California.[73] Rapid temperature changes can be stressful to aquatic ecosystems.[74]
With the temperature of the nearby buildings sometimes reaching a difference of over 50°F (28°C) from the near-surface air temperature, precipitation warms rapidly, and run-off into nearby streams, lakes and rivers (or other bodies of water) to provide excessive thermal pollution. The increase in thermal pollution has the potential to increase water temperature by 20 to 30°F (11 to 17°C). This increase causes the fish species inhabiting the body of water to undergo thermal stress and shock due to the rapid change in temperature of their habitat.[75]
Permeable pavements may reduce these effects by percolating water through the pavement into subsurface storage areas where it can be dissipated through absorption and evaporation.[76]
On animals
Species that are good at colonizing can use conditions provided by urban heat islands to thrive in regions outside of their normal range. Examples of this include the grey-headed flying fox (Pteropus poliocephalus) and the common house gecko (Hemidactylus frenatus).[77] Grey-headed flying foxes, found in Melbourne, Australia, colonized urban habitats following the increase in temperatures there. Increased temperatures, causing warmer winter conditions, made the city more similar in climate to the more northerly wildland habitat of the species.
With temperate climates, urban heat islands will extend the growing season, therefore altering breeding strategies of inhabiting species.[77] This can be best observed in the effects that urban heat islands have on water temperature (see effects on water bodies).
Urban heat islands caused by cities have altered the natural selection process.[77] Selective pressures like temporal variation in food, predation and water are relaxed causing a new set of selective forces to roll out. For example, within urban habitats, insects are more abundant than in rural areas. Insects are ectotherms. This means that they depend on the temperature of the environment to control their body temperature, making the warmer climates of the city perfect for their ability to thrive. A study done in Raleigh, North Carolina conducted on Parthenolecanium quercifex (oak scales), showed that this particular species preferred warmer climates and were therefore found in higher abundance in urban habitats than on oak trees in rural habitats. Over time spent living in urban habitats, they have adapted to thrive in warmer climates than in cooler ones.[78]
On energy usage for cooling
Images of Salt Lake City show positive correlation between white reflective roofs and cooler temperatures. Image A depicts an aerial view of Salt Lake City, Utah, site of 865000 sqft white reflective roof. Image B is a thermal infrared image of same area, showing hot (red and yellow) and cool (green and blue) spots. The reflective vinyl roof, not absorbing solar radiation, is shown in blue surrounded by other hot spots.
Another consequence of urban heat islands is the increased energy required for air conditioning and refrigeration in cities that are in comparatively hot climates. The heat island effect costs Los Angeles about US$ 100 million per year in energy (in the year 2000).[79] Through the implementation of heat island reduction strategies, significant annual net energy savings have been calculated for northern locations such as Chicago, Salt Lake City, and Toronto.[80]
Every year in the U.S. 15% of energy goes towards the air conditioning of buildings in these urban heat islands. It was reported in 1998 that "the air conditioning demand has risen 10% within the last 40 years."[81]
Increases in air conditioning use also serve to worsen the effects of UHIs at night. While cooler nights are often a reprieve from heat waves during the day, the residual heat created by the use of air conditioning systems can lead to higher nighttime temperatures. According to a study by Professor Francisco Salamanca Palou and colleagues, this residual heat can cause nighttime increases of up to 1°C in urban areas.[82] Increased energy use from air conditioners also contributes to carbon emissions, which doubly exacerbates the effects of UHIs.
The temperature difference between urban areas and the surrounding suburban or rural areas can be as much as 5°C (9.0°F). Nearly 40 percent of that increase is due to the prevalence of dark roofs, with the remainder coming from dark-coloured pavement and the declining presence of vegetation. The heat island effect can be counteracted slightly by using white or reflective materials to build houses, roofs, pavements, and roads, thus increasing the overall albedo of the city.[85]
Concentric expansion of cities is unfavourable in terms of the urban heat island phenomenon. It is recommended to plan the development of cities in strips, consistent with the hydrographic network, taking into account green areas with various plant species.[86] In this way, it was planned to build urban settlements stretching over large areas, e.g. Kielce, Szczecin and Gdynia in Poland, Copenhagen in Denmark and Hamburg, Berlin and Kiel in Germany.
Planting trees around the city can be another way of increasing albedo and decreasing the urban heat island effect. It is recommended to plant deciduous trees because they can provide many benefits such as more shade in the summer and not blocking warmth in winter.[87] Trees are a necessary feature in combating most of the urban heat island effect because they reduce air temperatures by 10°F (5.6°C),[88] and surface temperatures by up to 20–45°F (11–25°C).[89] Another benefit of having trees in a city is that trees also help fight global warming by absorbing CO2 from the atmosphere.
Recent syntheses show that increasing street-tree canopy measurably cools pedestrian-level air temperatures, with effects varying by climate, canopy density, and urban form. A 2024 meta-analysis across 110 cities reports typical ~1–2 °C daytime cooling, and a 2024 field study found that locations with no canopy within 10 m were up to five times more likely to exceed 32.2 °C, with air temperature declining linearly as canopy increased.[90][91]
Urban green infrastructure (UGI) are integrated networks of green spaces in cities and are developed in both private and public areas of the city.[47] Examples of UGI include urban parks with trees and shrub cover, rows of trees along a street, private gardens, rooftop gardens, and other green space throughout a city.[50] Properly utilized UGI promotes more equitable heat distribution, where improper usage only perpetuates heat inequity.[47] UGI provides shading and evapotranspiration, which reduces both air and land temperatures.[47] Therefore, a lack of UGI in marginalized communities reduces the land's temperature regulating capabilities promotes heat inequity.[47] UGI is widely recognized as an efficient, sustainable, and non-controversial solution to heat inequity.[47]
Painting rooftops white has become a common strategy to reduce the heat island effect.[92] In cities, there are many dark coloured surfaces that absorb the heat of the sun in turn lowering the albedo of the city.[92] White rooftops allow high solar reflectance and high solar emittance, increasing the albedo of the city or area the effect is occurring.[92] Green roofs and cool roofs can play a big role in helping cities manage extreme heat. In warmer regions, cool roofs were especially effective, with some cutting cooling energy use completely for certain low-rise buildings. Green roofs may be more beneficial in colder climates because they provide insulation and help reduce the need for heating during winter.[93]
Additionally, covering rooftops with a reflective coating, has shown to be an effective measure to reduce solar heat gain. A study led by Oscar Brousse from University College London, which simulated the impact of various cooling measures in London found that rooftops, which were either painted white or had reflective coating, proved to be the most effective solution for reducing outdoor temperatures at the pedestrian level, outperforming solar panels, green roofs, and tree cover. The study simulated the impact of various cooling measures in London during a 2018 heatwave, finding that the so-called cool roofs could reduce average outdoor temperatures by 1.2°C, and up to 2°C in certain areas. In comparison, additional tree cover reduced temperatures by 0.3°C and solar panels by 0.5°C.[84]
Relative to remedying the other sources of the problem, replacing dark roofing requires the least amount of investment for the most immediate return. A cool roof made from a reflective material such as vinyl reflects at least 75 percent of the sun's rays, and emit at least 70 percent of the solar radiation absorbed by the building envelope. Asphalt built-up roofs (BUR), by comparison, reflect 6 percent to 26 percent of solar radiation.[94]
Using light-coloured concrete has proven effective in reflecting up to 50% more light than asphalt and reducing ambient temperature.[95] A low albedo value, characteristic of black asphalt, absorbs a large percentage of solar heat creating warmer near-surface temperatures. Paving with light-coloured concrete, in addition to replacing asphalt with light-coloured concrete, communities may be able to lower average temperatures.[96] However, research into the interaction between reflective pavements and buildings has found that, unless the nearby buildings are fitted with reflective glass, solar radiation reflected off light-coloured pavements can increase building temperatures, increasing air conditioning demands.[97][98]
There are specific paint formulations for daytime radiative cooling that reflect up to 98.1% of sunlight.[99][100]
Green roofs are excellent insulators during the warm weather months and the plants cool the surrounding environment. Plants can improve air quality as they absorb carbon dioxide and concomitantly produce oxygen.[101] Green roofs can also have positive impacts on stormwater management and energy consumption.[102] Cost can be a barrier to implementing a green roof.[103][104] Several factors influence the cost of a green roof, including design and soil depth, location, and the price of labor and equipment in that market, which is typically lower in more developed markets where there is more experience designing and installing green roofs.[105] The individualized context of each green roof presents a challenge for making broad comparisons and assessments, and focusing only on monetary costs may leave out the social, environmental, and public health benefits green roofs provide.[104] Global comparisons of green roof performance are further challenged by the lack of a shared framework for making such comparisons.[104]
Stormwater management is another option to help mitigate the effect of the urban heat island. Stormwater management is the controlling the water produced by the storm in a way that protects property and infrastructure.[106] Urban infrastructure like streets, sidewalks, and parking lots do not allow for water to penetrate into the earth's surface causing water to flood. By using stormwater management, you can control the flow of the water in ways that can mitigate UHI effect. One way is using a stormwater management technique called pervious pavement system (PPS). This technique has been used in over 30 countries and found to be successful in stormwater management and UHI mitigation. The PPS allows water to flow through the pavement allowing for the water to be absorbed causing the area to be cooled by evaporation.[107]
Green parking lots use vegetation and surfaces other than asphalt to limit the urban heat island effect.
Runoff from the vicinity flows into an adjacent bioswale
Green infrastructure or blue-green infrastructure refers to a network that provides the "ingredients" for solving urban and climatic challenges by building with nature.[108] The main components of this approach include stormwater management, climate adaptation, the reduction of heat stress, increasing biodiversity, food production, better air quality, sustainable energy production, clean water, and healthy soils, as well as more human centered functions, such as increased quality of life through recreation and the provision of shade and shelter in and around towns and cities.[109][110] Green infrastructure also serves to provide an ecological framework for social, economic, and environmental health of the surroundings.[111] More recently scholars and activists have also called for green infrastructure that promotes social inclusion and equity rather than reinforcing pre-existing structures of unequal access to nature-based services.[112]
A passive daytime radiative cooling roof application can double the energy savings of a white roof, attributed to high solar reflectance and thermal emittance in the infrared window,[113] with the highest cooling potential in hot and dry cities such as Phoenix and Las Vegas.[114] When installed on roofs in dense urban areas, passive daytime radiative cooling panels can significantly lower outdoor surface temperatures at the pedestrian level.[10][11]
Society and culture
History of research
The phenomenon was first investigated and described by Luke Howard in the 1810s, although he was not the one to name the phenomenon.[115] A description of the very first report of the UHI by Luke Howard said that the urban center of London was warmer at night than the surrounding countryside by 2.1°C (3.7°F).[116]
Investigations of the urban atmosphere continued throughout the nineteenth century. Between the 1920s and the 1940s, researchers in the emerging field of local climatology or microscale meteorology in Europe, Mexico, India, Japan, and the United States pursued new methods to understand the phenomenon.
In 1929, Albert Peppler used the term in a German publication believed to be the first instance of an equivalent to urban heat island: städtische Wärmeinsel (which is urban heat island in German).[117] Between 1990 and 2000, about 30 studies were published annually; by 2010, that number had increased to 100, and by 2015, it was more than 300.[118]
Leonard O. Myrup published the first comprehensive numerical treatment to predict the effects of the urban heat island (UHI) in 1969.[33] His paper surveys UHI and criticizes then-existing theories as being excessively qualitative.
Aspects of social inequality
Urban heat inequity, also termed thermal inequity, is an unequal distribution of heat in urban areas or neighborhoods within them, which causes disproportionate impacts to people living in those communities. Unequal threat of heat stress in urban environments is often correlated with differences in demographics, including racial and ethnic background, income, education level, and age.[47] While the general impacts of urban heat inequity depend on the city studied, negative effects typically act on historically marginalized communities.[47] The idea is closely tied to the urban heat island effect, where a major cause to urban heat inequity is increased urbanization.[46]
Some studies suggest that the effects of UHIs on health may be disproportionate, since the impacts may be unevenly distributed based on a variety of factors such as age,[66][119] ethnicity and socioeconomic status.[120] This raises the possibility of health impacts from UHIs being an environmental justice issue. Studies have shown that communities of color in the United States have been disproportionately affected by UHI.[121][122][123][124]
There is a correlation between neighborhood income and tree canopy cover.[125] Low-income neighborhoods tend to have significantly fewer trees than neighborhoods with higher incomes.[126] Researchers hypothesized that less-well-off neighborhoods do not have the financial resources to plant and maintain trees. Affluent neighborhoods can afford more trees, on "both public and private property".[127] One reason for this discrepancy is that wealthier homeowners and communities can afford more land, which can be kept open as green space, whereas poorer housing often takes the form of rentals, where landowners try to maximize their profit by putting as much housing density as possible on their land.[128]
On a global scale, there are discrepancies in the effects of UHIs in different regions of the world. While overall heat exposure is increasing worldwide, its effects have increased faster in the Global South in recent decades, per a study by Professor Kanging Huang and colleagues.[129]
The disproportionate impact of UHIs on the Global South exacerbates already occurring environmental injustices. Because many countries in the equator are naturally hot and humid, these areas are particularly susceptible to the effects of UHIs. One World Bank study has found a 7.0° disparity between the hottest and coolest neighborhoods in Bandung, Indonesia.[130]
The US experience
There is a correlation in the U.S. between ethnicity and exposure to UHIs. Within most U.S. cities, people of color are more likely to live in areas of high Surface Urban Heat Island Intensity than white people in the same cities. According to a study by climatologist Angel Hsu and colleagues, "the average person of color lives in a census tract with higher SUHI intensity than non-Hispanic whites in all but 6 of the 175 largest urbanized areas" in the U.S.[131] A 2023 policy brief further found that historically redlined and low‑income Black neighborhoods—already burdened by urban heat—also experience clusters of violent crime, amplifying intersecting vulnerabilities in these communities.[132]
Economic status also plays a role in the human effects on UHIs. Not only are people of lower economic classes more likely to live in UHIs, but they are also less likely to be able to afford commodities such as air conditioning. Like the correlation between SUHI intensity and ethnicity, a similar pattern can be seen when comparing households under the poverty line against those with an income more than double the poverty line.[131]
UHIs can have particularly strong effects on African Americans with chronic diseases. African Americans have higher rates of various chronic diseases, such as asthma and diabetes, than the general population. Per Professor Pamela Jackson and colleagues, these diseases can be exacerbated by extreme heat, leading to health problems such as hypertension or stroke.[133]
Researchers have also noted that the spread of impervious surfaces, such as concrete, tar, and asphalt, is correlated with neighborhoods of low socioeconomic status across various U.S. cities and states.[134] The presence of these materials serves as a predictor of "intra-urban variation in temperature".
Redlining, Urban Heat Exposure, and Health Inequity in U.S. cities
Redlining worked as a housing policy created and put to use in the 1930s, under the Roosevelt Administration, by the Home Owners' Loan Corporation (HOLC). This policy, when implemented, categorized neighborhoods by perceived investment risk. Notably, areas with higher populations of minorities and low-income residents were discriminated against using this policy, often labeled as hazardous and outlined in red on HOLC maps. This significantly restricted not only access to housing loans but also led to long-term divestment from these communities.
A study analyzing 108 U.S. cities found that formerly redlined neighborhoods are, on average, 2.6 °C (4.7 °F) hotter than non-redlined areas, and as the authors noted, this was largely due to a lack of tree canopy and the increased presence of heat-absorbent surfaces like asphalt and other dark clustered infrastructure.[135] In cities like Durham, Fresno, and Pittsburgh, "D" graded areas have substantially lower tree coverage compared to wealthier, "A" graded neighborhoods, which are also predominantly white.[136] Similarly, Phoenix, Arizona, a rapidly warming city, also shows high surface temperatures in formerly redlined communities reaching up to 10-15 °F (5.6–8.3 °C) higher than other neighborhoods.[137]
In addition to higher temperatures, these neighborhoods also experience higher levels of air pollution due to their proximity to highways and industrial zones, a characterization of previously redlined areas. Cities like Los Angeles experienced freeway construction in the 1950s that routed interstates through redlined areas, including neighborhoods like Boyle Heights and South Los Angeles. These areas have since experienced much higher concentrations of vehicular emissions such as diesel exhaust and fine particulate matter (PM2.5), which are also closely associated with higher risks of respiratory illness, cardiovascular disease, and birth defects.[138] On an international scale, research has also suggested that urban air pollution, like that of vehicular emissions, may directly intensify the urban heat island effect. In China, an urban haze effect, essentially a miniature greenhouse layer which prevents outgoing thermal radiation from escaping dense urban areas, was found to contribute as much as 0.7 °C of additional nighttime warming.[139] This conclusion underscores the critical consequences of urban heat islands, especially in previously redlined communities driven by both local development and broader atmospheric processes.
In response to these disparities, some cities have begun to introduce urban greening programs and reflective "cool pavement" initiatives to help mitigate the urban heat island effect in historically disadvantaged communities.[140][141] These efforts are part of an ongoing pish toward not only climate justice but also aims to redress the legacy of redlining, a policy driven by environmental racism.
Bill S.4280,[150] introduced to the U.S. Senate in 2020, would authorize the National Integrated Heat Health Information System Interagency Committee (NIHHIS) to tackle extreme heat in the United States.[151] Successful passage of this legislation would fund NIHHIS for five years and would instate a $100 million grant program within NIHHIS to encourage and fund urban heat reduction projects, including those using cools roofs and pavements and those improving HVAC systems. As of July 22, 2020 the bill has not moved past introduction to Congress.
The city of New York determined that the cooling potential per area was highest for street trees, followed by living roofs, light covered surface, and open space planting. From the standpoint of cost effectiveness, light surfaces, light roofs, and curbside planting have lower costs per temperature reduction.[152]
Los Angeles
A hypothetical "cool communities" program in Los Angeles has projected in 1997 that urban temperatures could be reduced by approximately 3°C (5°F) after planting ten million trees, reroofing five million homes, and painting one-quarter of the roads at an estimated cost of US$1billion, giving estimated annual benefits of US$170million from reduced air-conditioning costs and US$360million in smog related health savings.[87]
In a case study of the Los Angeles Basin in 1998, simulations showed that even when trees are not strategically placed in these urban heat islands, they can still aid in minimization of pollutants and energy reduction. It is estimated that with this wide-scale implementation, the city of Los Angeles can annually save $100M with most of the savings coming from cool roofs, lighter colored pavement, and the planting of trees. With a citywide implementation, added benefits from the lowering smog-level would result in at least one billion dollars of saving per year.[81]
Los Angeles TreePeople is an example of how tree planting can empower a community. TreePeople provides the opportunity for people to come together, build capacity, community pride and the opportunity to collaborate and network with each other.[153]
Los Angeles has also begun to implement a Heat Action Plan to address the city's needs at a more granular level than the solutions provided by the state of California. The city uses the LA Equity Index in an effort to ensure that the effects of extreme heat are mitigated in an equitable manner.[154]
Virginia
In 2021, Climate Adaptation Planning Analysis (CAPA) received funding from the National Oceanic and Atmospheric Administration to conduct Heat Mapping across the United States.[155] Ten areas from Virginia – Abington, Arlington, Charlottesville, Farmville, Harrisonburg, Lynchburg, Petersburg, Richmond, Salem, Virginia Beach and Winchester – participated in the heat watch campaign. This campaign consisted of 213 Volunteers brought together by campaign organizers who made 490,423 Heat Measurements across 70 Routes total. After taking measurements throughout the day, equipment and data was sent back to CAPA where it was analyzed using machine learning algorithms. After analysis of the data, CAPA came back together with campaign organizers from each area to discuss potential plans for each town in the future.
New York
New York City implemented its "Cool Neighborhoods NYC" program in 2017 intending to mitigate the effects of extreme urban heat. One of the plan's ambitions was to increase funding for the city's Low-Income Home Energy Assistance Program. Specifically, the plan sought to increase funding for cooling solutions for lower-income families.[156]
India
Several cities in India experience significant urban heat island effects due to rapid urbanization, loss of green cover, and extensive concretization. A report by The Hindu highlights that metropolitan areas like Delhi, Bengaluru, Chennai, Jaipur, Ahmedabad, Mumbai, and Kolkata have seen temperature differences ranging from 1°C to 6°C compared to their rural surroundings. These urban heat islands not only increase the local temperatures but also exacerbate the impacts of heatwaves, leading to higher energy consumption for cooling and posing health risks to vulnerable populations.[157]
Mumbai
Mumbai, India's financial hub and one of the most densely populated cities globally, is significantly affected by the urban heat island effect. Rapid urbanization, extensive concretization, and loss of green spaces have led to higher temperatures in the city compared to its surroundings. According to a report, Mumbai is projected to spend twice as much as New York City to manage urban heat generated due to concretization. This increased expenditure highlights the severity of the urban heat island effect in Mumbai and its impact on the city's infrastructure and residents.[158]
See also
Urban climatology– Scientific study of atmosphere and the urban environment
12Solecki, William D.; Rosenzweig, Cynthia; Parshall, Lily; Pope, Greg; Clark, Maria; Cox, Jennifer; Wiencke, Mary (2005). "Mitigation of the heat island effect in urban New Jersey". Global Environmental Change Part B: Environmental Hazards. 6 (1): 39–49. Bibcode:2005EnvHa...6...39S. doi:10.1016/j.hazards.2004.12.002. S2CID153841143.
↑Chakraborty, T. and Lee, X. (2019). "A simplified urban-extent algorithm to characterize surface urban heat islands on a global scale and examine vegetation control on their spatiotemporal variability". International Journal of Applied Earth Observation and Geoinformation. 74: 269–280. Bibcode:2019IJAEO..74..269C. doi:10.1016/j.jag.2018.09.015. S2CID53715577.
↑Theeuwes, N. E.; Steeneveld, G. J.; Ronda, R. J.; Holtslag, A. A. M. (2017). "A diagnostic equation for the daily maximum urban heat island effect for cities in northwestern Europe". International Journal of Climatology. 37 (1): 443–454. Bibcode:2017IJCli..37..443T. doi:10.1002/joc.4717. S2CID131437962.
12Hoehne, Christopher G.; Chester, Mikhail V.; Sailor, David J.; King, David A. (4 July 2022). "Urban Heat Implications from Parking, Roads, and Cars: a Case Study of Metro Phoenix". Sustainable and Resilient Infrastructure. 7 (4): 272–290. Bibcode:2022SusRI...7..272H. doi:10.1080/23789689.2020.1773013. S2CID225553384.
↑Sailor, D. J. (2011). "A review of methods for estimating anthropogenic heat and moisture emissions in the urban environment". International Journal of Climatology. 31 (2): 189–199. Bibcode:2011IJCli..31..189S. doi:10.1002/joc.2106. S2CID54835415.
↑Chen, F.; Kusaka, H.; Bornstein, R.; Ching, J.; Grimmond, C. S. B.; Grossman-Clarke, S.; Loridan, T.; Manning, K. W.; Martilli, A.; Miao, S.; Sailor, D.; Salamanca, F. P.; Taha, H.; Tewari, M.; Wang, X.; Wyszogrodzki, A. A.; Zhang, C. (2011). "The integrated WRF/urban modelling system: Development, evaluation, and applications to urban environmental problems". International Journal of Climatology. 31 (2): 273. Bibcode:2011IJCli..31..273C. doi:10.1002/joc.2158. S2CID54686199.
↑J. Zhang, Guang; Cai, Ming; Hu, Aixue (27 January 2013). "Energy consumption and the unexplained winter warming over northern Asia and North America". Nature Climate Change. 3 (5): 466–470. Bibcode:2013NatCC...3..466Z. doi:10.1038/nclimate1803.
12Koppe, Christina; Kovats, Sari; Jendritzky, Gerd; Menne, Bettina (2004). "Heat-waves: risks and responses". Health and Global Environmental Change Series. 2. Archived from the original on 2023-03-22. Retrieved 2014-05-07.
↑Shi, Yuan; Katzschner, Lutz; Ng, Edward (March 2018). "Modelling the fine-scale spatiotemporal pattern of urban heat island effect using land use regression approach in a megacity". Science of the Total Environment. 618: 891–904. Bibcode:2018ScTEn.618..891S. doi:10.1016/j.scitotenv.2017.08.252. PMID29096959.
↑Weng, Qihao; Firozjaei, Mohammad Karimi; Sedighi, Amir; Kiavarz, Majid; Alavipanah, Seyed Kazem (19 May 2019). "Statistical analysis of surface urban heat island intensity variations: A case study of Babol city, Iran". GIScience & Remote Sensing. 56 (4): 576–604. Bibcode:2019GISRS..56..576W. doi:10.1080/15481603.2018.1548080. S2CID134003294.
↑Yuan, F. (2007). "Comparison of impervious surface area and normalized difference vegetation index as indicators of surface urban heat island effects in Landsat imagery". Remote Sensing of Environment. 106 (3): 375–386. Bibcode:2007RSEnv.106..375Y. doi:10.1016/j.rse.2006.09.003.
↑NYS DEC. "Streams Tributary to Onondaga Lake Biological Assessment." Dec.ny.gov. N.p., 2008. Web. 12 September 2013.
123Shochat, Eyal; Warren, Paige S.; Faeth, Stanley H.; Mclntyre, Nancy E.; Hope, Diane (April 2006). "From Patterns to Emerging Processes in Mechanistic Urban Ecology". Trends in Ecology & Evolution. 21 (4): 186–91. doi:10.1016/j.tree.2005.11.019. PMID16701084.
↑Tang, Teri (2014-06-05). "Where are the Insects?". School of Life Sciences. Arizona State University. Retrieved 19 October 2014.
↑Chang, Sheng-chieh (2000-06-23). "Energy Use". Environmental Energies Technology Division. Archived from the original on March 11, 2009. Retrieved 2009-06-18.
↑Salamanca, F.; Georgescu, M.; Mahalov, A.; Moustaoui, M.; Wang, M. (27 May 2014). "Anthropogenic heating of the urban environment due to air conditioning". Journal of Geophysical Research: Atmospheres. 119 (10): 5949–5965. Bibcode:2014JGRD..119.5949S. doi:10.1002/2013JD021225.
12Rosenfeld, Arthur H.; Romm, Joseph J.; Akbari, Hashem; Lloyd, Alan C. (February 1997). "Painting the town white—and green". Technology Review. 100 (2): 52–59.
123Zinzi, M.; Agnoli, S. (2012). "Cool and green roofs. An energy and comfort comparison between passive cooling and mitigation urban heat island techniques for residential buildings in the Mediterranean region". Energy and Buildings. 55: 66–76. Bibcode:2012EneBu..55...66Z. doi:10.1016/j.enbuild.2011.09.024.
↑Zhou, Y. (2023). "Building energy savings by green roofs and cool roofs in current and future climates". npj Urban Sustainability. 4 23. doi:10.1038/s42949-024-00159-8. hdl:10397/107505.
↑Liu, Hongqing; Kong, Fanhua; Yin, Haiwei; Middel, Ariane; Zheng, Xiandi; Huang, Jing; Xu, Hairong; Wang, Ding; Wen, Zhihao (2021). "Impacts of green roofs on water, temperature, and air quality: A bibliometric review". Building and Environment. 196 107794. Bibcode:2021BuEnv.19607794L. doi:10.1016/j.buildenv.2021.107794. ISSN0360-1323.
↑Feng, Haibo; Hewage, Kasun N. (2018). "Economic benefits and costs of green roofs". Nature based strategies for urban and building sustainability. Butterworth-Heinemann. pp.307–318. doi:10.1016/B978-0-12-812150-4.00028-8. ISBN978-0-12-812150-4.
↑Heo, Se-Yeon; Lee, Gil Ju; Song, Young Min (2022). "Heat-shedding with photonic structures: radiative cooling and its potential". Journal of Materials Chemistry C. 10 (27): 9915–9937. doi:10.1039/D2TC00318J. S2CID249695930.
↑Zhou, Kai; Miljkovic, Nenad; Cai, Lili (March 2021). "Performance analysis on system-level integration and operation of daytime radiative cooling technology for air-conditioning in buildings". Energy and Buildings. 235 110749. Bibcode:2021EneBu.23510749Z. doi:10.1016/j.enbuild.2021.110749. S2CID234180182.
↑Díaz, J.; Jordán, A.; García, R.; López, C.; Alberdi, J.; Hernández, E.; Otero, A. (1 February 2014). "Heat waves in Madrid 1986–1997: effects on the health of the elderly". International Archives of Occupational and Environmental Health. 75 (3): 163–170. doi:10.1007/s00420-001-0290-4. PMID11954983. S2CID31284700.
↑Harlan, Sharon L.; Brazel, Anthony J.; Prashad, Lela; Stefanov, William L.; Larsen, Larissa (December 2006). "Neighborhood microclimates and vulnerability to heat stress". Social Science & Medicine. 63 (11): 2847–2863. doi:10.1016/j.socscimed.2006.07.030. hdl:2286/R.I.55228. PMID16996668.
↑Wilson, Bev (October 2020). "Urban Heat Management and the Legacy of Redlining". Journal of the American Planning Association. 86 (4): 443–457. doi:10.1080/01944363.2020.1759127.
↑Adams, Kaitlyn; Knuth, Colette Steward (January 2024). "The effect of urban heat islands on pediatric asthma exacerbation: How race plays a role". Urban Climate. 53 101833. Bibcode:2024UrbCl..5301833A. doi:10.1016/j.uclim.2024.101833.
Stewart, Iain D.; Mills, Gerald (2021). The Urban Heat Island: A Guidebook. Elsevier. ISBN978-0-12-815017-7.
Huang, Qingming; Lu, Yuqi (2017). "Urban heat island research from 1991 to 2015: a bibliometric analysis". Theoretical and Applied Climatology. 131 (3–4): 1055–1067. doi:10.1007/s00704-016-2025-1. S2CID13435754.
Yow, Donald (2023). "Urban Heat Islands". Oxford Bibliographies in Urban Studies. Oxford University Press. doi:10.1093/obo/9780190922481-0070.
Sharma, Prashant; Yogeswaran, Nagendra (2024). Reddy, Kasi; Kumar, Ramesh; Rao, Venkata (eds.). "A systematic review of literature on major domains of urban heat island studies". Sustainable Resilient Built Environments. Springer: 213–222. doi:10.1007/978-981-99-8811-2_18. ISBN978-981-99-8810-5.
Oke, T. R. (1987). Boundary Layer Climates (2nded.). Routledge. ISBN978-0-415-04319-9.
This page is based on this Wikipedia article Text is available under the CC BY-SA 4.0 license; additional terms may apply. Images, videos and audio are available under their respective licenses.