List of cities proper by population density

Last updated

This is a list of cities worldwide by population density. The population, population density and land area for the cities listed are based on the entire city proper, the defined boundary or border of a city or the city limits of the city. The population density of the cities listed is based on the average number of people living per square kilometer or per square mile. This list does not refer to the population, population density or land area of the greater metropolitan area or urban area, nor particular districts in any of the cities listed.
Contents

Cities by population density

CityPopulationAreaDensityCountryYear
km2mi2/km2/mi2
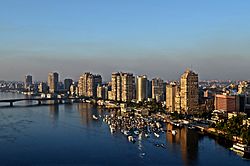
Giza 4,432,915983845,050116,679Flag of Egypt.svg  Egypt 2017 [1]
Manila 1,846,513431743,062111,532Flag of the Philippines.svg  Philippines 2020 [2] 2018 [3]
Croix-des-Bouquets 231,0775242,322109,614Flag of Haiti.svg  Haiti 2024 [4]
Mandaluyong 425,75811438,49599,703Flag of the Philippines.svg  Philippines 2020 [2] [5]
Malé 211,9086236,53694,628Flag of Maldives.svg  Maldives 2022 [6]
Dhaka 10,295,78630511833,75787,430Flag of Bangladesh.svg  Bangladesh 2022 [7]
Bnei Brak 237,4717333,50386,773Flag of Israel.svg  Israel 2023 [8] [9]
Caloocan 1,661,584532131,23380,893Flag of the Philippines.svg  Philippines 2020 [2] [5]
Kolkata 6,200,0002068030,09777,952Flag of India.svg  India 2023 [10] 2023 [11]
Makati 629,61622828,97575,044Flag of the Philippines.svg  Philippines 2020 [2] [5]
Port-au-Prince 988,438251039,084101,228Flag of Haiti.svg  Haiti 2024 [4]
Levallois-Perret 64,3792126,71369,187Flag of France.svg  France 2020 [12]
Guédiawaye 373,63814526,68869,123Flag of Senegal.svg  Senegal 2023 [13]
Montrouge 54,2602126,21367,891Flag of France.svg  France 2020 [14]
Bogotá 8,034,64930711926,14167,705Flag of Colombia.svg  Colombia 2020s [15] [16]
Kathmandu 862,400491917,44045,169Flag of Nepal.svg  Nepal 2021 [17]
Vincennes 49,8912126,12167,653Flag of France.svg  France 2020 [18]
Le Pré-Saint-Gervais 17,9501025,64366,415Flag of France.svg  France 2020 [19]
Pasig 803,159311225,53066,122Flag of the Philippines.svg  Philippines 2020 [2] [5]
Saint-Mandé 22,6191024,58663,677Flag of France.svg  France 2020 [20]
Saint-Josse-ten-Noode 27,5481024,16562,587Flag of Belgium (civil).svg  Belgium [21] [22]
Guttenberg 12,0171024,03462,248Flag of the United States.svg  United States 2020 [23] [24]
Malabon 380,52216623,84261,751Flag of the Philippines.svg  Philippines 2020 [2] [5]
Pasay 440,65619723,64061,229Flag of the Philippines.svg  Philippines 2020 [2] [5]
Neapoli, Thessaloniki 25,8221027,03970,030Flag of Greece.svg  Greece 2021 [25]
Damascus 1,711,000773022,22157,552Flag of Syria (2025-).svg  Syria [26]
San Juan, Metro Manila 126,3476221,52455,748Flag of the Philippines.svg  Philippines 2020 [2] [5]
Navotas 247,54312421,50755,703Flag of the Philippines.svg  Philippines 2020 [2] [5]
Asmara 963,000451721,40055,426Flag of Eritrea.svg  Eritrea 2012 [27]
Mislata 43,7562121,24155,014Flag of Spain.svg  Spain [28]
Macau [note 1] 681,293331320,62053,406Flag of the People's Republic of China.svg  China 2021 [29] [30]
Kallithea 97,6165219,47350,434Flag of Greece.svg  Greece 2021 [25]
Nea Smyrni 72,8534120,61553,393Flag of Greece.svg  Greece 2021 [25]
Paris 2,187,5261054120,75553,754Flag of France.svg  France 2020 [31]
Union City 68,5893120,69053,588Flag of the United States.svg  United States 2020 [23] [24]
Mumbai 12,442,37360323320,63453,442Flag of India.svg  India 2013 [32] 2019 [33]
Colombo 752,993371420,35152,710Flag of Sri Lanka.svg  Sri Lanka
L'Hospitalet de Llobregat 252,17112520,33652,671Flag of Spain.svg  Spain 2016 [34]
West New York 52,9123120,28852,547Flag of the United States.svg  United States 2020 [23] [24]
Marikina 456,05923920,14452,173Flag of the Philippines.svg  Philippines 2020 [2] [5]
Saint-Gilles 50,0023119,84251,391Flag of Belgium (civil).svg  Belgium [21] [22]
Clichy 61,0703119,82851,354Flag of France.svg  France 2020 [35]
Kotsiubynske 17,2491019,82651,351Flag of Ukraine.svg  Ukraine
Courbevoie 81,7194219,59750,756Flag of France.svg  France 2020 [36]
Boulogne-Billancourt 120,0716219,46050,403Flag of France.svg  France 2020 [37]
Giv'atayim 62,2423119,21049,755Flag of Israel.svg  Israel 2024 [38]
Las Piñas 606,293321218,93549,041Flag of the Philippines.svg  Philippines 2020 [2] [5]
Koekelberg 21,9901018,79548,679Flag of Belgium (civil).svg  Belgium
General Mariano Alvarez 172,4339418,34447,511Flag of the Philippines.svg  Philippines 2020 [2] 2013 [39]
Monaco 38,3672118,44647,774Flag of Monaco.svg  Monaco 2023 [40]
Les Lilas 23,0451018,29047,370Flag of France.svg  France 2020 [41]
Hoboken 60,4193118,22647,205Flag of the United States.svg  United States 2020 [23]
Pikine 758,554421618,06146,778Flag of Senegal.svg  Senegal 2023 [13]
Quezon City 2,960,0481666417,88246,315Flag of the Philippines.svg  Philippines 2020 [2] [5]
Modi'in Illit 86,1585217,83846,201Flag of Israel.svg  Israel 2024
Vanves 27,7292117,77546,037Flag of France.svg  France 2020 [42]
Asnières-sur-Seine 85,1915217,67445,777Flag of France.svg  France 2020 [43]
Ciudad Nezahualcóyotl 1,110,565632417,50345,334Flag of Mexico.svg  Mexico 2010 [44]
Sliema 22,5911117,37845,008Flag of Malta.svg  Malta 2019
Howrah 1,077,075632417,09644,280Flag of India.svg  India [32] [45]
Santa Coloma de Gramenet 118,8217316,97443,964Flag of Spain.svg  Spain 2019 [46]
Chittagong 2,582,4011556016,66143,151Flag of Bangladesh.svg  Bangladesh 2018 [47]
Molenbeek-Saint-Jean 97,4626216,54742,857Flag of Belgium (civil).svg  Belgium
Freetown 1,347,559813116,53942,835Flag of Sierra Leone.svg  Sierra Leone 2024
Keur Massar 759,849461816,51842,783Flag of Senegal.svg  Senegal 2023 [13]
Seoul 9,962,39360523416,46142,634Flag of South Korea.svg  South Korea 2013 [48]
Charenton-le-Pont 30,3742116,41842,524Flag of France.svg  France 2020 [49]
La Garenne-Colombes 29,1692116,38742,443Flag of France.svg  France 2020 [50]
Schaerbeek 133,3098316,37742,417Flag of Belgium (civil).svg  Belgium
Neuilly-sur-Seine 60,3614116,18341,913Flag of France.svg  France 2020 [51]
Barcelona 1,636,7321013916,14941,827Flag of Spain.svg  Spain 2021 [52]
Issy-les-Moulineaux 68,4514216,10641,715Flag of France.svg  France 2020 [53]
Jakarta 10,562,08866225515,96741,354Flag of Indonesia.svg  Indonesia 2020 [54]
Bat-Yam 129,5848315,84241,030Flag of Israel.svg  Israel 2019
Gentilly 18,6051015,76740,836Flag of France.svg  France 2020 [55]
Cairo 9,539,67360623415,74240,772Flag of Egypt.svg  Egypt 2019 [56]
Buenos Aires 3,120,6122037815,37239,815Flag of Argentina.svg  Argentina 2022
Bandung 2,510,1031676415,03138,929Flag of Indonesia.svg  Indonesia 2020 [57]
Rosario, Cavite 110,8078314,56137,712Flag of the Philippines.svg  Philippines 2020 [2] 2013 [39]
Mandaue 364,116251014,46137,453Flag of the Philippines.svg  Philippines 2020 [2] 2013 [39]
Warabi 73,7775214,43837,394Flag of Japan.svg  Japan 2023 [58]
Bacoor 664,625461814,39537,284Flag of the Philippines.svg  Philippines 2020 [2] 2013 [39]
El'ad 50,2894114,36837,214Flag of Israel.svg  Israel 2024
Beitar Illit 67,6185214,29637,026Flag of Israel.svg  Israel 2024
Senglea 2,8200014,10036,519Flag of Malta.svg  Malta 2013
Cimahi 568,400401614,08036,467Flag of Indonesia.svg  Indonesia 2020
San Pedro, Laguna 326,00124913,55535,108Flag of the Philippines.svg  Philippines 2020 [2] 2013 [39]
Lagos 15,388,0001,17145213,13834,027Flag of Nigeria.svg  Nigeria 2024 [59]
Gaza City 590,481451713,12233,985Flag of Palestine.svg  Palestine 2017 [60]
Kiryat Motzkin 49,4004113,10333,938Flag of Israel.svg  Israel 2024
Geneva 201,81816612,67732,833Flag of Switzerland (Pantone).svg  Switzerland 2020
Portici 53,8015211,90330,828Flag of Italy.svg  Italy 2019
New York 8,804,19977830011,31429,304Flag of the United States.svg  United States 2020 [61]
Karachi 20,382,8812,1478299,49424,589Flag of Pakistan.svg  Pakistan 2023 [62]
La Plata 193,14427107,15318,528Flag of Argentina.svg  Argentina 2010 [63]
  1. Excluding 777 people who lived in "maritime area"

See also

References

  1. "Central Agency for Public Mobilisation and Statistics (CAPMAS)" . Retrieved 12 January 2025.
  2. 1 2 3 4 5 6 7 8 9 10 11 12 13 14 15 16 17 Census of Population (2020). Table B - Population and Annual Growth Rates by Province, City, and Municipality - By Region. Philippine Statistics Authority . Retrieved 8 July 2021.
  3. "About Manila". The Official Website of the City of Manila, Philippines. Archived from the original on 24 December 2018. Retrieved 26 October 2019.
  4. 1 2 "ESTIMATIONS DÉSAGRÉGÉES DE LA POPULATION HAITIENNE EN 2024" [2024 Disaggregated Estimations of the Haitian Population](PDF) (in French). Institut Haïtien de Statistique et d’Informatique (IHSI). Archived (PDF) from the original on 29 March 2025. Retrieved 28 May 2025.
  5. 1 2 3 4 5 6 7 8 9 10 11 "An Update on the Earthquake Hazards and Risk Assessment of Greater Metropolitan Manila Area" (PDF). Philippine Institute of Volcanology and Seismology. 14 November 2013. Archived from the original (PDF) on 24 June 2016.
  6. "Census Results Summary". Maldives Bureau of Statistics. Archived from the original on 1 September 2023. Retrieved 30 November 2023.
  7. "Population and Housing Census 2022" (PDF). Bangladesh Bureau of Statistics. Archived (PDF) from the original on 25 February 2024.
  8. "List of localities, in Alphabetical order" (PDF). Israel Central Bureau of Statistics. Archived from the original (PDF) on 17 May 2018. Retrieved 25 December 2018.
  9. "Home Page" (in Hebrew). Bnei Brak Municipality. Retrieved 25 December 2018.
  10. "West Bengal". Office of the Registrar General & Census Commissioner, India. Retrieved 26 October 2023.
  11. "Basic Statistics of Kolkata". Kolkata Municipal Corporation. Retrieved 22 August 2023.
  12. "Commune de Levallois-Perret (92044)" (in French). INSEE . Retrieved 16 August 2020.
  13. 1 2 3 "Geo-Ref Senegal 2023 Census" (PDF). senegal.pdf. Retrieved 25 January 2025.
  14. "Montrouge (92049 – Commune)" (in French). INSEE . Retrieved 16 August 2020.
  15. "Hay más de 7 millones de habitantes en Bogotá, según cifras del censo". El Tiempo. 4 July 2019. Archived from the original on 6 July 2019. Retrieved 6 July 2019.
  16. "Information" (PDF). www.dane.gov.co. 2019. Archived (PDF) from the original on 29 December 2019. Retrieved 26 March 2020.
  17. "Population size and distribution". National Population and Housing Census 2021. Archived from the original on 26 May 2025.
  18. "Vincennes (94080 – Commune)" (in French). INSEE . Retrieved 16 August 2020.
  19. "Commune du Pré-Saint-Gervais (93061)" (in French). INSEE . Retrieved 16 August 2020.
  20. "Commune de Saint-Mandé (94067)" (in French). INSEE . Retrieved 16 August 2020.
  21. 1 2 Direction Générale Institutions et Population, Belgique; Chiffre global de la population par commune, Situation au 1/07/2009 (pdf-file) Archived 19 April 2009 at the Wayback Machine Population as of 1 July 2009. Retrieved on 21 August 2009.
  22. 1 2 GeoHive; Belgium - Brussels Hoofdstedelijk Gewest, Administrative units Archived 1 June 2016 at the Wayback Machine Retrieved on 21 August 2009.
  23. 1 2 3 4 "Explore Census Data". data.census.gov. Retrieved 24 June 2021.
  24. 1 2 3 2010 Census Gazetteer Files: New Jersey County Subdivisions, United States Census Bureau. Accessed 11 April 2016.
  25. 1 2 3 "Απογραφή Πληθυσμού 2021. Μόνιμος πληθυσμός κατά αστικότητα, ορεινότητα και έκταση" [Population Census 2021 - Permanent Population by urbanity, terrain, and area] (in Greek). Hellenic Statistics Authority.
  26. Central Places and Un-Central Landscapes. 1 April 2019. doi: 10.3390/books978-3-03897-679-0 . ISBN   978-3-03897-679-0.
  27. "CIA – The World Factbook" . Retrieved 2 September 2012.
  28. Población de España – datos y mapas; Todos los Municipios de España (xls, zipped file) Archived 7 April 2010 at the Wayback Machine Population and area 1 January 2009. Retrieved on 21 April 2010.
  29. "Statistical Tables". Statistics and Census Service of the Government of Macau SAR.
  30. Statistical Tables (Report). Statistics and Census Service of the Government of Macau SAR.
  31. "Paris (75056 – Commune)" (in French). INSEE . Retrieved 16 August 2020.
  32. 1 2 "Cities having population 1 lakh and above, Census 2011" (PDF). The Registrar General & Census Commissioner, India. Retrieved 18 August 2013.
  33. "About MMR". mmrda.maharashtra.gov.in. Mumbai Metropolitan Region Development Authority. Retrieved 2 April 2019.
  34. "Hospitalet de Llobregat, l' (081017)". Statistical Institute of Catalonia. Retrieved 5 March 2016.
  35. "Commune de Clichy (92024)" (in French). INSEE . Retrieved 16 August 2020.
  36. "Commune de Courbevoie (92026)" (in French). INSEE . Retrieved 16 August 2020.
  37. "Commune de Boulogne-Billancourt (92012)" (in French). INSEE . Retrieved 16 August 2020.
  38. "Giv'atayim 2016" (PDF) (in Hebrew). Israel Central Bureau of Statistics . Retrieved 14 February 2019.
  39. 1 2 3 4 5 "Table A. Population, Land Area, Population Density, and Percent Change in Population Density of the Philippines by Region, Province/Highly Urbanized City, and City/Municipality: 2010, 2015, and 2020". Philippine Statistics Authority . Archived from the original (XLSX) on 31 March 2022. Retrieved 10 August 2022.
  40. "2023 Population Census" (PDF). Monaco Statistics.
  41. "Commune de Les Lilas (93045)" (in French). INSEE . Retrieved 16 August 2020.
  42. "Vanves (92075)" (in French). INSEE . Retrieved 16 August 2020.
  43. "Asnières-sur-Seine (92004)" (in French). INSEE . Retrieved 16 August 2020.
  44. "Datos generales". Unidad de Microrregiones Dirección General Adjunta de Planeación Microrregional (in Spanish). Archived from the original on 13 April 2015.
  45. "Area, Population and density of population in the district of Howrah". Howrah District Government. Archived from the original on 26 February 2013. Retrieved 22 August 2013.
  46. "El municipi en xifres: Santa Coloma de Gramenet". Statistical Institute of Catalonia. Retrieved 30 December 2019.
  47. "Bangladesh: Districts and Cities – Population Statistics in Maps and Charts". City Population. Retrieved 23 December 2018.
  48. Park, Sohyun (10–14 June 2013). "Healthy Urban Planning in Seoul, Korea" (PDF). World Health Organization. Retrieved 20 November 2019.
  49. "Charenton-le-Pont (94018)" (in French). INSEE . Retrieved 16 August 2020.
  50. "La Garenne-Colombes (92035)" (in French). INSEE . Retrieved 16 August 2020.
  51. "Neuilly-sur-Seine (92051)" (in French). INSEE . Retrieved 16 August 2020.
  52. "Idescat. The municipality in figures. Barcelona (Barcelonès)" (in Spanish). IDESCAT . Retrieved 15 August 2022.
  53. "Issy-les-Moulineaux (92040)" (in French). INSEE . Retrieved 16 August 2020.
  54. "Hasil Sensus Penduduk 2020 Provinsi DKI Jakarta" . Retrieved 3 February 2021.
  55. "Gentilly (94037)" (in French). INSEE . Retrieved 16 August 2020.
  56. "Egypt Data Portal". Egypt Data Portal. Retrieved 3 November 2019.
  57. "Jumlah Penduduk Kota Bandung (Jiwa), 2019-2020" (in Indonesian). Statistics Indonesia . Retrieved 16 February 2021.
  58. "埼玉県推計人口(月報データ)". Saitama Prefecture. 1 January 2023. Retrieved 19 April 2023..
  59. "About Lagos - Lands Bureau - Lagos State Government". Lands Bureau - Lagos State Government. Retrieved 5 July 2024.
  60. "Main Indicators by Type of Locality - Population, Housing and Establishments Census 2017" (PDF). Palestinian Central Bureau of Statistics (PCBS). Archived from the original (PDF) on 28 January 2021. Retrieved 19 January 2021.
  61. "QuickFacts for New York city, New York; New York; United States" . Retrieved 14 September 2025.
  62. "Census-2023 Sindh" (PDF). Retrieved 21 December 2024.
  63. https://www.eldia.com/nota/2019-9-22-6-8-33-cada-vez-menos-platenses-viven-en-el-casco-y-la-ciudad-se-expande-sin-control-vivir-bien.{{cite web}}: Missing or empty |title= (help)