This article has multiple issues. Please help improve it or discuss these issues on the talk page . (Learn how and when to remove these messages)
|
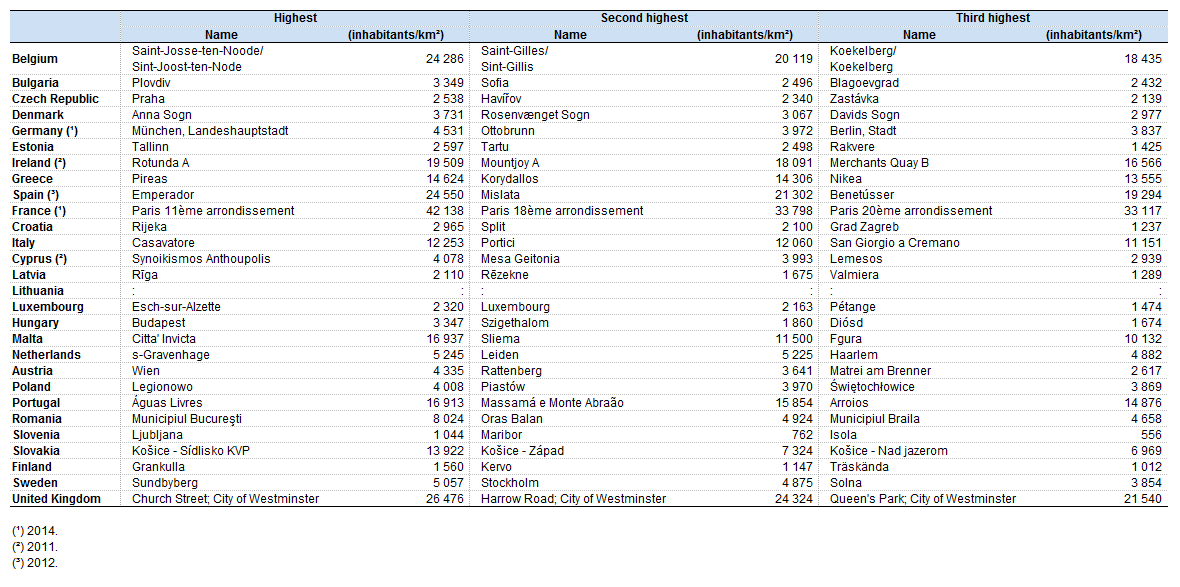
The population, population density, and land area for the cities of the European Union listed below are based on the entire city proper, the defined boundary or border of a city or the city limits of the city.
| Rank | City | Population | Area (km2) | Area (sq. miles) | Density (/km2) | Density (/sq. mile) | Country |
|---|---|---|---|---|---|---|---|
| 1 | Levallois-Perret | 66,082 | 2.41 | 0.93 | 27,420 | 71,056 | France |
| 2 | Emperador | 692 | 0.03 | 0.01 | 23,067 | 69,200 | Spain |
| 3 | L'Hospitalet de Llobregat | 264,923 | 12.4 | 4.8 | 21,364 | 55,599 | Spain |
| 4 | Paris | 2,203,817 | 105.4 | 40.5 | 20,909 | 54,415 | France |
| 5 | Mislata | 43,278 | 2.10 | 0.81 | 20,608 | 53,430 | Spain |
| 6 | Benetússer | 14,668 | 0.76 | 0.29 | 19,300 | 50,579 | Spain |
| 7 | Athens | 745,514 | 38.96 | 15.04 | 19,135 | 49,560 | Greece |
| 8 | Sliema | 22,591 | 1.3 | 0.50 | 17,377 | 45,182 | Malta |
| 9 | Thessaloniki | 325,182 | 19.31 | 7.45 | 16,840 | 43,648 | Greece |
| 10 | Barcelona | 1,621,537 | 101.9 | 39.3 | 15,991 | 41,417 | Spain |
| 11 | Korydallos | 63,445 | 4.32 | 1.67 | 14,686 | 37,991 | Greece |
| 12 | Senglea | 2,784 | 0.2 | 0.077 | 13,920 | 36,062 | Malta |
| 13 | Nikaia | 89,380 | 6.65 | 2.57 | 13,441 | 34,778 | Greece |
| 14 | Odivelas | 59,604 | 5.02 | 2.04 | 11,873 | 30,589 | Portugal |
| 15 | Casavatore | 18,225 | 1.54 | 0.63 | 11,818 | 28,928 | Italy |
| 16 | Portici | 51,901 | 4.56 | 1.75 | 11,393 | 29,658 | Italy |
| 17 | Lyon | 500,715 | 47.87 | 18.48 | 10,460 | 27,095 | France |
| 18 | Melito di Napoli | 36,334 | 3.57 | 2.23 | 10,172 | 16,293 | Italy |
| 19 | Cádiz | 116,979 | 12.10 | 4.67 | 9,700 | 25,000 | Spain |
| 20 | San Giorgio a Cremano | 42,096 | 4.71 | 1.59 | 8,938 | 26,475 | Italy |
| 21 | Piraeus | 448,997 | 50.42 | 19.47 | 8,906 | 23,061 | Greece |
| 22 | Grenoble | 158,240 | 18.13 | 7.00 | 8,700 | 23,000 | France |
| 23 | Bilbao | 353,187 | 40.65 | 15.70 | 8,688 | 22,496 | Spain |
| 24 | Bucharest | 1,926,334 | 228 | 88.03 | 8,449 | 21,883 | Romania |
| 25 | Naples | 913,704 | 116.72 | 45.28 | 7,828 | 20,178 | Italy |
| 26 | Agualva-Cacém | 81,020 | 10.42 | 3.9 | 7,775 | 19,874 | Portugal |
| 27 | Milan | 1,371,499 | 181.64 | 70.18 | 7,551 | 19,474 | Italy |
| 28 | Brussels | 1,212,352 [1] | 162.4 [2] | 62.3 | 7,465 | 19,460 | Belgium |
| 29 | Bresso | 26,282 | 3.54 | 2.21 | 7,415 | 11,838 | Italy |
| 30 | Fuengirola | 75,396 | 10.2 | 3.9 | 7,400 | 19,000 | Spain |
| 31 | Porto | 287,591 | 41.42 | 15.99 | 6,900 | 18,000 | Portugal |
| 32 | Turin | 851,199 | 130.11 | 50.26 | 6,542 | 16,936 | Italy |
| 33 | A Coruña | 246,056 | 37.83 | 14.61 | 6,510 | 16,841 | Spain |
| 34 | Lisbon | 505,526 | 100.05 | 39 | 6,446 | 16,696 | Portugal |
| 35 | The Hague | 527,748 | 98.12 | 37.88 | 6,445 | 16,690 | Netherlands |
| 36 | Valencia | 780,834 | 134.65 | 51.99 | 5,799 | 15,019 | Spain |
| 37 | Amsterdam | 931,748 [3] | 165.76 | 64.00 | 5,621 | 14,558 | Netherlands |
| 38 | Madrid | 3,141,991 | 604.3 | 233.3 | 5,390 | 14,000 | Spain |
| 39 | Bordeaux | 250,776 | 49.36 | 19.06 | 5,081 | 13,160 | France |
| 40 | Seville | 703,021 | 140 | 54.05 | 5,022 | 13,007 | Spain |
| 41 | Stockholm | 942,370 | 188 | 73 | 5,012 | 12,909 | Sweden |
| 42 | Montpellier | 275,318 | 56.88 | 21.96 | 4,840 | 12,536 | France |
| 43 | Dublin | 553,165 | 114.99 | 44.40 | 4,811 | 12,460 | Ireland |
| 44 | Nice | 343,895 | 71.92 | 27.77 | 4,782 | 12,385 | France |
| 45 | Munich [4] | 1,471,508 | 310.70 | 119.96 | 4,736 | 12,267 | Germany |
| 46 | Dublin | 554,554 | 117.80 | 45.48 | 4,708 | 12,193 | Ireland |
| 47 | Vienna | 1,889,083 | 414.65 | 160.10 | 4,556 | 11,800 | Austria |
| 48 | Copenhagen | 794,128 | 179.80 | 69.42 | 4,417 | 11,439 | Denmark |
| 49 | Ottobrunn [4] | 21,542 | 5.23 | 2.02 | 4,119 | 10,664 | Germany |
| 50 | Malmö | 316,588 | 77.0605 | 29.75 | 4,108 | 10,642 | Sweden |
| 51 | Berlin [4] | 3,644,826 | 891.12 | 344.06 | 4,090 | 10,594 | Germany |
| 52 | Toulouse | 479,638 | 118.30 | 45.68 | 4,054 | 10,450 | France |
| 53 | Linköping | 166,673 | 42.16 | 16.28 | 4,000 | 10,000 | Sweden |
| 54 | Palermo | 630,427 | 160.15 | 62.00 | 3,936 | 10,168 | Italy |
| 55 | Świętochłowice [5] | 50,012 | 13.31 | 5.14 | 3,757 | 9,732 | Poland |
| 56 | Uppsala | 177,074 | 48.77 | 18.83 | 3,600 | 9,400 | Sweden |
| 57 | Lund | 94,393 | 26.37 | 10.18 | 3,580 | 9,300 | Sweden |
| 58 | Saint-Nicolas | 24,251 [6] | 6.89 | 2.66 | 3,518 [7] | 9,117 | Belgium |
| 59 | Pescara | 118,461 | 34.39 | 13.27 | 3,445 | 9,000 | Italy |
| 60 | Warsaw [5] | 1,777,972 | 517.24 | 199.71 | 3,421 | 8,860 | Poland |
| 61 | Mortsel | 25,824 [6] | 7.70 | 2.97 | 3,355 [7] | 8,695 | Belgium |
| 62 | Plovdiv | 346,893 | 101.98 | 39.37 | 3,349 [8] | 8,674 | Bulgaria |
| 63 | Budapest | 1,752,286 [9] | 525.14 | 202.76 | 3,337 | 8,642 | Hungary |
| 64 | Chorzów [5] | 108,434 | 33.24 | 12.83 | 3,262 | 8,449 | Poland |
| 65 | Gröbenzell [4] | 19,967 | 6.36 | 2.46 | 3,139 | 8,117 | Germany |
| 66 | Helsinki | 665,558 | 213.75 | 82.53 | 3,113 | 8,064 | Finland |
| 67 | Stuttgart [4] | 634,830 | 207.33 | 80.05 | 3,062 | 7,930 | Germany |
| 68 | Herne [4] | 156,374 | 51.42 | 19.85 | 3,041 | 7,878 | Germany |
| 69 | Frankfurt am Main [4] | 753,056 | 248.31 | 95.87 | 3,033 | 7,855 | Germany |