This article is about the global average temperature at the Earth's surface. For records of extreme weather, see List of weather records.
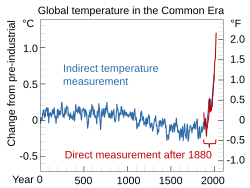
The blue line represents global surface temperature reconstructed over the last 2,000 years using proxy data from tree rings, corals, and ice cores. The red line shows direct surface temperature measurements since 1880.
Series of reliable temperature measurements in some regions began in the 1850—1880 time frame (this is called the instrumental temperature record). The longest-running temperature record is the Central England temperature data series, which starts in 1659. The longest-running quasi-global records start in 1850.[3] For temperature measurements in the upper atmosphere a variety of methods can be used. This includes radiosondes launched using weather balloons, a variety of satellites, and aircraft.[4] Satellites can monitor temperatures in the upper atmosphere but are not commonly used to measure temperature change at the surface. Ocean temperatures at different depths are measured to add to global surface temperature datasets. This data is also used to calculate the ocean heat content.
GMST is often further aggregated by year or month. Through 1940, the average annual GMST increased, but was relatively stable between 1940 and 1975. Since 1975, it has increased by roughly 0.15°C to 0.20°C per decade, to at least 1.1°C (1.9°F) above 1880 levels.[5] The current annual GMST is about 15°C (59°F),[6] though monthly temperatures can vary almost 2°C (4°F) above or below this figure.[7]
The global average and combined land and ocean surface temperature show a warming of 1.09°C (range: 0.95 to 1.20°C) from 1850–1900 to 2011–2020, based on multiple independently produced datasets.[8]:5 The trend is faster since the 1970s than in any other 50-year period over at least the last 2000 years.[8]:8 Within that upward trend, some variability in temperatures happens because of natural internal variability (for example due to El Niño–Southern Oscillation).
The global temperature record shows the changes of the temperature of the atmosphere and the oceans through various spans of time. There are numerous estimates of temperatures since the end of the Pleistoceneglaciation, particularly during the current Holocene epoch. Some temperature information is available through geologic evidence, going back millions of years. More recently, information from ice cores covers the period from 800,000 years ago until now. Tree rings and measurements from ice cores can give evidence about the global temperature from 1,000-2,000 years before the present until now.[9]
Definition
Projected surface temperature changes relative to 1850–1900, based on CMIP6 multi-model mean changes
Put simply, the global surface temperature (GST) is calculated by averaging the temperature at the surface layer of the ocean (sea surface temperature) and over land (surface air temperature).
In comparison, the global mean surface air temperature (GSAT) is the "global average of near-surface air temperatures over land, oceans and sea ice. Changes in GSAT are often used as a measure of global temperature change in climate models."[10]:2231
Global temperature can have different definitions. There is a small difference between air and surface temperatures.[11]:12
NASA animation portraying global surface temperature changes since 1880. The colour blue denotes cooler temperatures and red denotes warmer temperatures. As reference value the mean temperature from 1951 to 1980 is used.
The global average and combined land and ocean surface temperature, show a warming of 1.09°C (range: 0.95 to 1.20°C) from 1850–1900 to 2011–2020, based on multiple independently produced datasets.[8]:5 The trend is faster since the 1970s than in any other 50-year period over at least the last 2000 years.[8]:8
Most of the observed warming occurred in two periods: around 1900 to around 1940 and around 1970 onwards;[12] the cooling/plateau from 1940 to 1970 has been mostly attributed to sulfate aerosol.[13][14]:207 Some of the temperature variations over this time period may also be due to ocean circulation patterns.[15]
Land air temperatures are rising faster than sea surface temperatures. Land temperatures have warmed by 1.59°C (range: 1.34 to 1.83°C) from 1850–1900 to 2011–2020, while sea surface temperatures have warmed by 0.88°C (range: 0.68 to 1.01°C) over the same period.[8]:5
For 1980 to 2020, the linear warming trend for combined land and sea temperatures has been 0.18°C to 0.20°C per decade, depending on the data set used.[16]:Table 2.4
It is unlikely that any uncorrected effects from urbanisation, or changes in land use or land cover, have raised global land temperature changes by more than 10%.[17]:189 However, larger urbanisation signals have been found locally in some rapidly urbanising regions, such as eastern China.[16]:Section 2.3.1.1.3
Over the last 50 years the Arctic has warmed the most, and temperatures on land have generally increased more than sea surface temperatures.
Global warming affects all parts of Earth's climate system.[19] Global surface temperatures have risen by 1.1°C (2.0°F). Scientists say they will rise further in the future.[20][21] The changes in climate are not uniform across the Earth. In particular, most land areas have warmed faster than most ocean areas. The Arctic is warming faster than most other regions.[22] Night-time temperatures have increased faster than daytime temperatures.[23] The impact on nature and people depends on how much more the Earth warms.[24]:787
Scientists use several methods to predict the effects of human-caused climate change. One is to investigate past natural changes in climate.[25] To assess changes in Earth's past climate scientists have studied tree rings, ice cores, corals, and ocean and lake sediments.[26] These show that recent temperatures have surpassed anything in the last 2,000 years.[27] By the end of the 21st century, temperatures may increase to a level last seen in the mid-Pliocene. This was around 3 million years ago.[28]:322 At that time, mean global temperatures were about 2–4°C (3.6–7.2°F) warmer than pre-industrial temperatures. The global mean sea level was up to 25 metres (82ft) higher than it is today.[29]:323 The modern observed rise in temperature and CO2 concentrations has been rapid. Even abrupt geophysical events in Earth's history do not approach current rates.[30]:54
Global average temperature datasets from various scientific organizations show substantial agreement concerning the progress and extent of global warming: 1880– pairwise correlations of the four longer-term datasets are at least 99.29%.A climate spiral depicting monthly anomalies in global temperature from 1880 till 2021.
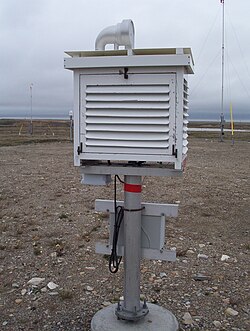
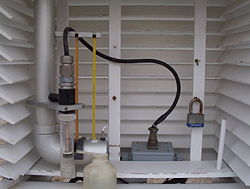
Exterior of a Stevenson screen used for temperature measurements on land stations.Interior of a Stevenson screen
The longest-running temperature record is the Central England temperature data series, a single-location data set that starts in 1659.[32]
On 15 December 2025, the Copernicus Programme's Earth System Science Data released the GloSAT reference analysis, a gridded data set of air temperature change across global land and ocean extending back to the 1780s, using marine air temperature observations rather than the sea surface temperature measurements.[33]
Before GloSAT's release, the period for which reasonably reliable instrumental records of near-surface land temperature exist with quasi-global coverage was generally considered to begin around 1850.[3] Earlier records exist, but with sparser coverage, largely confined to the Northern Hemisphere, and less standardized instrumentation.
The temperature data for the record come from measurements from land stations, ships, and buoys. On land, temperatures are measured either using electronics sensors, or mercury or alcohol thermometers which are read manually, with the instruments being sheltered from direct sunlight using a shelter such as a Stevenson screen. The sea record consists of ships taking sea temperature measurements, mostly from hull-mounted sensors, engine inlets or buckets, and more recently includes measurements from moored and drifting buoys. The land and marine records can be compared.
Areas that are densely populated tend to have a high density of measurement points. In contrast, temperature observations are more spread out in sparsely populated areas such as polar regions and deserts, as well as in many regions of Africa and South America.[34] In the past, thermometers were read manually to record temperatures. Nowadays, measurements are usually connected with electronic sensors which transmit data automatically. Surface temperature data is usually presented as anomalies rather than as absolute values.
Most meteorological observations are taken for use in weather forecasts. Centers such as European Centre for Medium-Range Weather Forecasts show instantaneous map of their coverage; or the Hadley Centre show the coverage for the average of the year 2000. Coverage for earlier in the 20th and 19th centuries would be significantly less. While temperature changes vary both in size and direction from one location to another, the numbers from different locations are combined to produce an estimate of a global average change.
Satellite and balloon temperature records (1950s–present)
Several groups have analyzed the satellite data to calculate temperature trends in the troposphere. Both the University of Alabama in Huntsville (UAH) and the private, NASA funded, corporation Remote Sensing Systems (RSS) find an upward trend. For the lower troposphere, UAH found a global average trend between 1978 and 2019 of 0.130 degrees Celsius per decade.[36] RSS found a trend of 0.148degrees Celsius per decade, to January 2011.[37]
In 2004 scientists found trends of +0.19 degrees Celsius per decade when applied to the RSS dataset.[38] Others found 0.20 degrees Celsius per decade up between 1978 and 2005, since which the dataset has not been updated.[39]
The most recent climate model simulations give a range of results for changes in global-average temperature. Some models show more warming in the troposphere than at the surface, while a slightly smaller number of simulations show the opposite behaviour. There is no fundamental inconsistency among these model results and observations at the global scale.[40]
The satellite records used to show much smaller warming trends for the troposphere which were considered to disagree with model prediction; however, following revisions to the satellite records, the trends are now similar.
Records of global average surface temperature are usually presented as anomalies rather than as absolute temperatures. A temperature anomaly is measured against a reference value (also called baseline period or long-term average).[44] Usually it is a period of 30 years. For example, a commonly used baseline period is 1951-1980. Therefore, if the average temperature for that time period was 15°C, and the currently measured temperature is 17°C, then the temperature anomaly is +2°C.
Temperature anomalies are useful for deriving average surface temperatures because they tend to be highly correlated over large distances (of the order of 1000km).[45] In other words, anomalies are representative of temperature changes over large areas and distances. By comparison, absolute temperatures vary markedly over even short distances. A dataset based on anomalies will also be less sensitive to changes in the observing network (such as a new station opening in a particularly hot or cold location) than one based on absolute values will be.
The Earth's average surface absolute temperature for the 1961–1990 period has been derived by spatial interpolation of average observed near-surface air temperatures from over the land, oceans and sea ice regions, with a best estimate of 14°C (57.2°F).[46] The estimate is uncertain, but probably lies within 0.5°C of the true value.[46] Given the difference in uncertainties between this absolute value and any annual anomaly, it's not valid to add them together to imply a precise absolute value for a specific year.[47]
Siting of temperature measurement stations
The U.S. National Weather Service Cooperative Observer Program has established minimum standards regarding the instrumentation, siting, and reporting of surface temperature stations.[48] The observing systems available are able to detect year-to-year temperature variations such as those caused by El Niño or volcanic eruptions.[49]
Another study concluded in 2006, that existing empirical techniques for validating the local and regional consistency of temperature data are adequate to identify and remove biases from station records, and that such corrections allow information about long-term trends to be preserved.[50] A study in 2013 also found that urban bias can be accounted for, and when all available station data is divided into rural and urban, that both temperature sets are broadly consistent.[51]
Warmest periods
Warmest years
In recent decades, new high temperature records have substantially outpaced new low temperature records on a growing portion of Earth's surface. Comparison shows seasonal variability for record increases.
The decade from 2015 through 2025 included all of the ten warmest years on record since 1850.[53]
The year 2023 was 1.48°C hotter than the average in the years 1850-1900 according to the Copernicus Climate Change Service. It was declared as the warmest on record almost immediately after it ended and broke many climate records.[54][55]
There is a long-term warming trend, and there is variability about this trend because of natural sources of variability (e.g. ENSO such as 2014–2016 El Niño event, volcanic eruption).[56] Not every year will set a record but record highs are occurring regularly.
While record-breaking years can attract considerable public interest,[57] individual years are less significant than the overall trend.[58][59] Some climatologists have criticized the attention that the popular press gives to warmest year statistics.[60][58]
Based on the NOAA dataset (note that other datasets produce different rankings[61]), the following table lists the global combined land and ocean annually averaged temperature rank and anomaly for each of the 10 warmest years on record.[62] For comparison: IPCC uses the mean of four different datasets and expresses the data relative to 1850–1900.[citation needed] Although global instrumental temperature records begin only in 1850, reconstructions of earlier temperatures based on climate proxies, suggest these recent years may be the warmest for several centuries to millennia, or longer.[16]:2–6
Top 10 warmest years (data from NOAA)
(1880–2024)
Rank
Year
Anomaly °C
Anomaly °F
1
2024
1.29
2.23
2
2023
1.19
2.14
3
2025
1.17
2.11
4
2016
1.03
1.85
5
2020
1.02
1.83
6
2019
0.99
1.78
7
2017
0.94
1.69
8
2015
0.92
1.65
9
2022
0.86
1.55
10
2021
0.84
1.51
Warmest decades
Global warming by decade: In the last four decades, global average surface temperatures during a given decade have almost always been higher than the average temperature in the preceding decade (data for 1850 to 2020 based on HadCRUT datasets).
Numerous drivers have been found to influence annual global mean temperatures. An examination of the average global temperature changes by decades reveals continuing climate change: each of the last four decades has been successively warmer at the Earth's surface than any preceding decade since 1850. The most recent decade (2011-2020) was warmer than any multi-centennial period in the past 11,700 years.[16]:2–6
The following chart is from NASA data of combined land-surface air and sea-surface water temperature anomalies.[63]
Combined land-surface air and sea-surface water temperature anomalies (data from NASA)
Years
Temperature anomaly, °C(°F) from 1951 to 1980 mean
Colored bars show how El Niño years (red, regional warming) and La Niña years (blue, regional cooling) relate to overall global warming. The El Niño–Southern Oscillation has been linked to variability in longer-term global average temperature increase, with El Niño years usually corresponding to annual global temperature increases.
Factors that influence global temperature include:
El Niño–Southern Oscillation (ENSO): El Niño generally tends to increase global temperatures. La Niña, on the other hand, usually causes years which are cooler than the short-term average.[64] El Niño is the warm phase of the El Niño–Southern Oscillation (ENSO) and La Niña the cold phase. In the absence of other short-term influences such as volcanic eruptions, strong El Niño years are typically 0.1°C to 0.2°C warmer than the years immediately preceding and following them, and strong La Niña years 0.1°C to 0.2°C cooler. The signal is most prominent in the year in which the El Niño or La Niña phase ends, with global average temperatures typically rising by 0.1°C to 0.2°C during strong El Niño years, and falling by a similar margin during strong La Niña events, in the absence of other short-term influences such as volcanic eruptions.[65]
Aerosols and volcanic eruptions: Aerosols diffuse incoming radiation generally cooling the planet. On a long-term basis, aerosols are primarily of anthropogenic origin, but major volcanic eruptions can produce quantities of aerosols which exceed those from anthropogenic sources over periods of time up to a few years. Volcanic eruptions which are sufficiently large to inject significant quantities of sulfur dioxide into the stratosphere can have a significant global cooling effect for one to three years after the eruption. This effect is most prominent for tropical volcanoes as the resultant aerosols can spread over both hemispheres. The largest eruptions of the last 100 years, such as the Mount Pinatubo eruption in 1991 and Mount Agung eruption in 1963-1964, have been followed by years with global mean temperatures 0.1°C to 0.2°C below long-term trends at the time.[citation needed]
This graph shows how short-term variations occur in the measured temperature. The graph also shows a long-term trend of global warming.
The U.S. National Academy of Sciences, both in its 2002 report to President George W. Bush, and in later publications, has strongly endorsed evidence of an average global temperature increase in the 20th century.[68]
The preliminary results of an assessment carried out by the Berkeley Earth Surface Temperature group and made public in October 2011, found that over the past 50 years the land surface warmed by 0.911°C, and their results mirrors those obtained from earlier studies carried out by the NOAA, the Hadley Centre and NASA's GISS. The study addressed concerns raised by skeptics (more often: climate change deniers).[69][70] Those concerns included urban heat island effects and apparently poor station quality,[69] and the "issue of data selection bias"[69] and found that these effects did not bias the results obtained from these earlier studies.[69][71][72][73]
Map of the land-based long-term monitoring stations included in the Global Historical Climatology Network. Colors indicate the length of the temperature record available at each site.
One of the issues that has been raised in the media is the view that global warming "stopped in 1998".[74][75] This view ignores the presence of internal climate variability.[75][76] Internal climate variability is a result of complex interactions between components of the climate system, such as the coupling between the atmosphere and ocean.[77] An example of internal climate variability is the El Niño–Southern Oscillation (ENSO).[75][76] The El Niño in 1998 was particularly strong, possibly one of the strongest of the 20th century, and 1998 was at the time the world's warmest year on record by a substantial margin.
Cooling over the 2007 to 2012 period, for instance, was likely driven by internal modes of climate variability such as La Niña.[78] The area of cooler-than-average sea surface temperatures that defines La Niña conditions can push global temperatures downward, if the phenomenon is strong enough.[78] The slowdown in global warming rates over the 1998 to 2012 period is also less pronounced in current generations of observational datasets than in those available at the time in 2012. The temporary slowing of warming rates ended after 2012, with every year from 2015 onwards warmer than any year prior to 2015, but it is expected that warming rates will continue to fluctuate on decadal timescales through the 21st century.[79]:Box 3.1
Related research
Top graphic (comprehensive): 196 rows represent 196 countries, grouped by continent. Each row has 118 color-coded annual temperatures, showing 1901—2018 warming patterns in each region and country. Bottom graphic (summary): global average 1901—2018. Data visualization: warming stripes.
Each of the seven years in 2015-2021 was clearly warmer than any pre-2014 year, and this trend is expected to be true for some time to come (that is, the 2016 record will be broken before 2026 etc.).[83][84] A decadal forecast by the World Meteorological Organisation issued in 2021 stated a probability of 40% of having a year above 1.5 C in the 2021-2025 period.[85]
The changes in climate are not expected to be uniform across the Earth. In particular, land areas change more quickly than oceans, and northern high latitudes change more quickly than the tropics. There are three major ways in which global warming will make changes to regional climate: melting ice, changing the hydrological cycle (of evaporation and precipitation) and changing currents in the oceans.
Temperature estimates from prior to 1850
A December 2025 article published in the Copernicus Programme's Earth System Science Data presented a GloSAT global surface air temperature dataset based on marine air temperature observations rather than the sea surface temperature measurements typically used. GloSAT extended back to the 1780s, earlier than 1850 covered by previous datasets.
The global temperature record shows the fluctuations of the temperature of the atmosphere and the oceans through various spans of time. There are numerous estimates of temperatures since the end of the Pleistoceneglaciation, particularly during the current Holocene epoch. Some temperature information is available through geologic evidence, going back millions of years. More recently, information from ice cores covers the period from 800,000 years ago until now. A study of the paleoclimate covers the time period from 12,000 years ago. Tree rings and measurements from ice cores can give evidence about the global temperature from 1,000-2,000 years ago. The most detailed information exists since 1850, when methodical thermometer-based records began. Modifications on the Stevenson-type screen were made for uniform instrument measurements around 1880.[9]
Tree rings and ice cores (from 1,000–2,000 years before present)
Proxy measurements can be used to reconstruct the temperature record before the historical period. Quantities such as tree ring widths, coral growth, isotope variations in ice cores, ocean and lake sediments, cave deposits, fossils, ice cores, borehole temperatures, and glacier length records are correlated with climatic fluctuations. From these, proxy temperature reconstructions of the last 2000 years have been performed for the northern hemisphere, and over shorter time scales for the southern hemisphere and tropics.[88][89][90]
Geographic coverage by these proxies is necessarily sparse, and various proxies are more sensitive to faster fluctuations. For example, tree rings, ice cores, and corals generally show variation on an annual time scale, but borehole reconstructions rely on rates of thermal diffusion, and small scale fluctuations are washed out. Even the best proxy records contain far fewer observations than the worst periods of the observational record, and the spatial and temporal resolution of the resulting reconstructions is correspondingly coarse. Connecting the measured proxies to the variable of interest, such as temperature or rainfall, is highly non-trivial. Data sets from multiple complementary proxies covering overlapping time periods and areas are reconciled to produce the final reconstructions.[90][91]
Proxy reconstructions extending back 2,000 years have been performed, but reconstructions for the last 1,000 years are supported by more and higher quality independent data sets. These reconstructions indicate:[90]
global mean surface temperatures over the last 25 years have been higher than any comparable period since AD 1600, and probably since AD 900
As well as natural, numerical proxies (tree-ring widths, for example) there exist records from the human historical period that can be used to infer climate variations, including: reports of frost fairs on the Thames; records of good and bad harvests; dates of spring blossom or lambing; extraordinary falls of rain and snow; and unusual floods or droughts.[93] Such records can be used to infer historical temperatures, but generally in a more qualitative manner than natural proxies.[citation needed]
Recent evidence suggests that a sudden and short-lived climatic shift between 2200 and 2100 BCE occurred in the region between Tibet and Iceland, with some evidence suggesting a global change. The result was a cooling and reduction in precipitation. This is believed to be a primary cause of the collapse of the Old Kingdom of Egypt.[94]
Paleoclimate (from 12,000 years before present)
Plot showing the variations, and relative stability, of climate during the last 12000 years.
Many estimates of past temperatures have been made over Earth's history. The field of paleoclimatology includes ancient temperature records. As the present article is oriented toward recent temperatures, there is a focus here on events since the retreat of the Pleistoceneglaciers. The 10,000 years of the Holocene epoch covers most of this period, since the end of the Northern Hemisphere's Younger Dryas millennium-long cooling. The Holocene Climatic Optimum was generally warmer than the 20th century, but numerous regional variations have been noted since the start of the Younger Dryas.
Ice cores (from 800,000 years before present)
Temperature estimates over 800,000 years of the EPICA ice cores in Antarctica. Temperatures are in Celsius relative to the average of the most recent 1,000 years; year 0 is 1950.
Even longer term records exist for few sites: the recent Antarctic EPICA core reaches 800 kyr; many others reach more than 100,000 years. The EPICA core covers eight glacial/interglacial cycles. The NGRIP core from Greenland stretches back more than 100 kyr, with 5 kyr in the Eemian interglacial. Whilst the large-scale signals from the cores are clear, there are problems interpreting the detail, and connecting the isotopic variation to the temperature signal.[citation needed][95]
Ice core locations
Ice core data location
The World Paleoclimatology Data Center (WDC) maintains the ice core data files of glaciers and ice caps in polar and low latitude mountains all over the world.
Ice core records from Greenland
As a paleothermometry, the ice core in central Greenland showed consistent records on the surface-temperature changes.[97] According to the records, changes in global climate are rapid and widespread. Warming phase only needs simple steps, however, the cooling process requires more prerequisites and bases.[98] Also, Greenland has the clearest record of abrupt climate changes in the ice core, and there are no other records that can show the same time interval with equally high time resolution.[97]
When scientists explored the trapped gas in the ice core bubbles, they found that the methane concentration in Greenland ice core is significantly higher than that in Antarctic samples of similar age, the records of changes of concentration difference between Greenland and Antarctic reveal variation of latitudinal distribution of methane sources.[99] Increase in methane concentration shown by Greenland ice core records implies that the global wetland area has changed greatly over past years.[100] As a component of greenhouse gases, methane plays an important role in global warming. The variation of methane from Greenland records makes a unique contribution for global temperature records undoubtedly.[citation needed]
Ice core records from Antarctica
The Antarctic ice sheet originated in the late Eocene, the drilling has restored a record of 800,000 years in Dome Concordia, and it is the longest available ice core in Antarctica. In recent years, more and more new studies have provided older but discrete records.[101] Due to the uniqueness of the Antarctic ice sheet, the Antarctic ice core not only records the global temperature changes, but also contains huge quantities of information about the global biogeochemical cycles, climate dynamics and abrupt changes in global climate.[102]
By comparing with current climate records, the ice core records in Antarctica further confirm that polar amplification.[103] Although Antarctica is covered by the ice core records, the density is rather low considering the area of Antarctica. Exploring more drilling stations is the primary goal for current research institutions.[citation needed]
Ice core records from low-latitude regions
The ice core records from low-latitude regions are not as common as records from polar regions, however, these records still provide much useful information for scientists. Ice cores in low-latitude regions are usually from high altitude areas. The Guliya record is the longest record from low-latitude, high altitude regions, which spans over 700,000 years.[104] According to these records, scientists found the evidence which can prove the Last Glacial Maximum (LGM) was colder in the tropics and subtropics than previously believed.[105] Also, the records from low-latitude regions helped scientists confirm that the 20th century was the warmest period in the last 1000 years.[104]
Geologic evidence (millions of years)
Reconstruction of the past 5 million years of climate history, based on oxygen isotope fractionation in deep sea sediment cores (serving as a proxy for the total global mass of glacial ice sheets), fitted to a model of orbital forcing (Lisiecki and Raymo 2005) and to the temperature scale derived from Vostok ice cores following Petit et al. (1999).
On longer time scales, sediment cores show that the cycles of glacials and interglacials are part of a deepening phase within a prolonged ice age that began with the glaciation of Antarctica approximately 40 million years ago. This deepening phase, and the accompanying cycles, largely began approximately 3 million years ago with the growth of continental ice sheets in the Northern Hemisphere. Gradual changes in Earth's climate of this kind have been frequent during the existence of planet Earth. Some of them are attributed to changes in the configuration of continents and oceans due to continental drift.[citation needed]
↑IPCC (2018). "Summary for Policymakers"(PDF). Global Warming of 1.5°C. An IPCC Special Report on the impacts of global warming of 1.5°C above pre-industrial levels and related global greenhouse gas emission pathways, in the context of strengthening the global response to the threat of climate change, sustainable development, and efforts to eradicate poverty. pp.3–24.
1234Gulev, S. K., P. W. Thorne, J. Ahn, F. J. Dentener, C. M. Domingues, S. Gerland, D. Gong, D. S. Kaufman, H. C. Nnamchi, J. Quaas, J. A. Rivera, S. Sathyendranath, S. L. Smith, B. Trewin, K. von Shuckmann, R. S. Vose, 2021, Changing State of the Climate System (Chapter 2)Archived 2 March 2022 at the Wayback Machine . In: Climate Change 2021: The Physical Science Basis. Contribution of Working Group I to the Sixth Assessment Report of the Intergovernmental Panel on Climate Change [Masson-Delmotte, V., P. Zhai, A. Pirani, S. L. Connors, C. Péan, S. Berger, N. Caud, Y. Chen, L. Goldfarb, M. I. Gomis, M. Huang, K. Leitzell, E. Lonnoy, J. B. R. Matthews, T. K. Maycock, T. Waterfield, O. Yelekçi, R. Yu and B. Zhou (eds.)]. Cambridge University Press. In Press.
↑Kennedy, John; Ramasamy, Selvaraju; Andrew, Robbie; Arico, Salvatore; Bishop, Erin; Braathen, Geir (2019). WMO statement on the State of the Global Climate in 2018. Geneva: Chairperson, Publications Board, World Meteorological Organization. p.6. ISBN978-92-63-11233-0. Archived from the original on 12 November 2019. Retrieved 24 November 2019.
↑Lindsey, Rebecca; Dahlman, Luann (28 June 2022). "Climate Change: Global Temperature". climate.gov. National Oceanic and Atmospheric Administration. Archived from the original on 17 September 2022.
↑"What Are "Proxy" Data?". NCDC.NOAA.gov. National Climatic Data Center, later called the National Centers for Environmental Information, part of the National Oceanic and Atmospheric Administration. 2014. Archived from the original on 10 October 2014.
↑see also: PBS (10 January 2007). "Interviews – James Hansen: Hot Politics: FRONTLINE: PBS". PBS.. "(...) The 1990s is the real appearance of the science skeptics. How much did they come after you? I actually don't like the word "skeptics" for them; I think it's better to call them "contrarians", because skepticism is part of science; all scientists are skeptics (...)"
↑Arias, P.A., N. Bellouin, E. Coppola, R.G. Jones, G. Krinner, J. Marotzke, V. Naik, M.D. Palmer, G.-K. Plattner, J. Rogelj, M. Rojas, J. Sillmann, T. Storelvmo, P.W. Thorne, B. Trewin, K. Achuta Rao, B. Adhikary, R.P. Allan, K. Armour, G. Bala, R. Barimalala, S. Berger, J.G. Canadell, C. Cassou, A. Cherchi, W. Collins, W.D. Collins, S.L. Connors, S. Corti, F. Cruz, F.J. Dentener, C. Dereczynski, A. Di Luca, A. Diongue Niang, F.J. Doblas-Reyes, A. Dosio, H. Douville, F. Engelbrecht, et al., 2021: Technical Summary. In Climate Change 2021: The Physical Science Basis. Contribution of Working Group I to the Sixth Assessment Report of the Intergovernmental Panel on Climate ChangeArchived 21 July 2022 at the Wayback Machine [Masson-Delmotte, V., P. Zhai, A. Pirani, S.L. Connors, C. Péan, S. Berger, N. Caud, Y. Chen, L. Goldfarb, M.I. Gomis, M. Huang, K. Leitzell, E. Lonnoy, J.B.R. Matthews, T.K. Maycock, T. Waterfield, O. Yelekçi, R. Yu, and B. Zhou (eds.)]. Cambridge University Press. In Press.
↑J.T. Houghton; etal., eds. (2001). "Figure 1: Variations of the Earth's surface temperature over the last 140 years and the last millennium.". Summary for policy makers. IPCC Third Assessment Report - Climate Change 2001 Contribution of Working Group I. Intergovernmental Panel on Climate Change. Archived from the original on 13 November 2016. Retrieved 12 May 2011.
↑J.T. Houghton; etal., eds. (2001). Chapter 2. Observed climate variability and change. Climate Change 2001: Working Group I The Scientific Basis. Intergovernmental Panel on Climate Change. Archived from the original on 9 March 2016. Retrieved 12 May 2011.
123National Research Council (U.S.). Committee on Surface Temperature Reconstructions for the Last 2,000 Years Surface temperature reconstructions for the last 2,000 years (2006), National Academies Press ISBN978-0-309-10225-4
↑O.Muszkat, The outline of the problems and methods used for research of the history of the climate in the Middle Ages, (in polish), Przemyśl 2014, ISSN1232-7263
↑Webb, Robert S.; Clark, Peter U.; Keigwin, Lloyd D. (1999), "Preface", Mechanisms of Global Climate Change at Millennial Time Scales, vol.112, Washington, D. C.: American Geophysical Union, pp.vii–viii, Bibcode:1999GMS...112D...7W, doi:10.1029/gm112p0vii (inactive 12 July 2025), ISBN0-87590-095-X, retrieved 18 April 2021{{citation}}: CS1 maint: DOI inactive as of July 2025 (link) CS1 maint: work parameter with ISBN (link)
12Thompson, L. G. (2004), "High Altitude, Mid- and Low-Latitude Ice Core Records: Implications for Our Future", Earth Paleoenvironments: Records Preserved in Mid- and Low-Latitude Glaciers, Developments in Paleoenvironmental Research, vol.9, Dordrecht: Kluwer Academic Publishers, pp.3–15, doi:10.1007/1-4020-2146-1_1, ISBN1-4020-2145-3{{citation}}: CS1 maint: work parameter with ISBN (link)
Supplement: Lisiecki, L. E.; Raymo, M. E. (2005). "Pliocene-Pleistocene stack of globally distributed benthic stable oxygen isotope records". Pangaea. doi:10.1594/PANGAEA.704257.
This page is based on this Wikipedia article Text is available under the CC BY-SA 4.0 license; additional terms may apply. Images, videos and audio are available under their respective licenses.


