
Climate is the long-term weather pattern in a region, typically averaged over 30 years. More rigorously, it is the mean and variability of meteorological variables over a time spanning from months to millions of years. Some of the meteorological variables that are commonly measured are temperature, humidity, atmospheric pressure, wind, and precipitation. In a broader sense, climate is the state of the components of the climate system, including the atmosphere, hydrosphere, cryosphere, lithosphere and biosphere and the interactions between them. The climate of a location is affected by its latitude, longitude, terrain, altitude, land use and nearby water bodies and their currents.

Numerical climate models use quantitative methods to simulate the interactions of the important drivers of climate, including atmosphere, oceans, land surface and ice. They are used for a variety of purposes from study of the dynamics of the climate system to projections of future climate. Climate models may also be qualitative models and also narratives, largely descriptive, of possible futures.

Climatology or climate science is the scientific study of Earth's climate, typically defined as weather conditions averaged over a period of at least 30 years. Climate concerns the atmospheric condition during an extended to indefinite period of time; weather is the condition of the atmosphere during a relative brief period of time. The main topics of research are the study of climate variability, mechanisms of climate changes and modern climate change. This topic of study is regarded as part of the atmospheric sciences and a subdivision of physical geography, which is one of the Earth sciences. Climatology includes some aspects of oceanography and biogeochemistry.
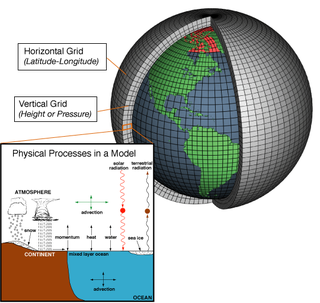
A general circulation model (GCM) is a type of climate model. It employs a mathematical model of the general circulation of a planetary atmosphere or ocean. It uses the Navier–Stokes equations on a rotating sphere with thermodynamic terms for various energy sources. These equations are the basis for computer programs used to simulate the Earth's atmosphere or oceans. Atmospheric and oceanic GCMs are key components along with sea ice and land-surface components.

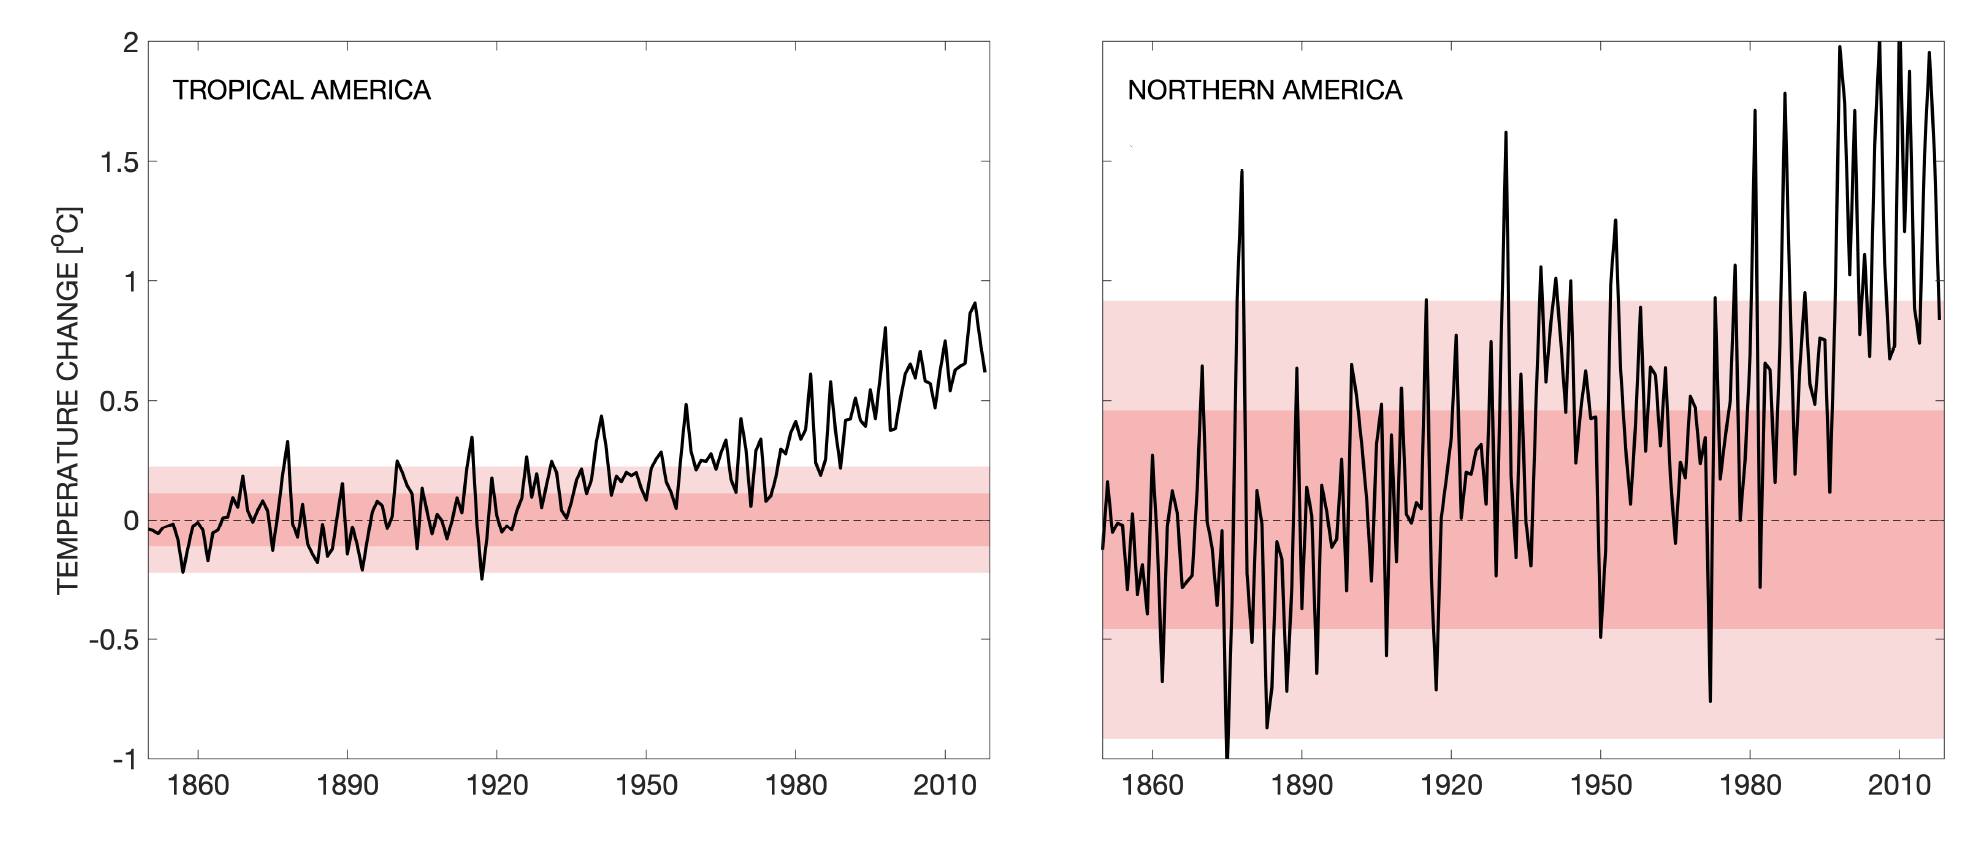
The instrumental temperature record is a record of temperatures within Earth's climate based on direct, instrument-based measurements of air temperature and ocean temperature. Instrumental temperature records are distinguished from indirect reconstructions using climate proxy data such as from tree rings and ocean sediments. Instrument-based data are collected from thousands of meteorological stations, buoys and ships around the globe. Whilst many heavily-populated areas have a high density of measurements, observations are more widely spread in sparsely populated areas such as polar regions and deserts, as well as over many parts of Africa and South America. Measurements were historically made using mercury or alcohol thermometers which were read manually, but are increasingly made using electronic sensors which transmit data automatically. Records of global average surface temperature are usually presented as anomalies rather than as absolute temperatures. A temperature anomaly is measured against a reference value. For example, a commonly used baseline period is the time period 1951-1980.
Thomas R. Karl is the former director of the National Oceanic and Atmospheric Administration’s National Centers for Environmental Information (NCEI). He joined the National Climate Centre in 1980, and when that became the National Climatic Data Center, he continued as a researcher, becoming a Lab Chief, Senior Scientist and ultimately Director of the Center. When it merged with other centers to become NCEI in 2015, he became its first director. He retired on 4 August 2016.

The Weather Prediction Center (WPC), located in College Park, Maryland, is one of nine service centers under the umbrella of the National Centers for Environmental Prediction (NCEP), a part of the National Weather Service (NWS), which in turn is part of the National Oceanic and Atmospheric Administration (NOAA) of the U.S. Government. Until March 5, 2013 the Weather Prediction Center was known as the Hydrometeorological Prediction Center (HPC). The Weather Prediction Center serves as a center for quantitative precipitation forecasting, medium range forecasting, and the interpretation of numerical weather prediction computer models.

The Arctic oscillation (AO) or Northern Annular Mode/Northern Hemisphere Annular Mode (NAM) is a weather phenomenon at the Arctic pole north of 20 degrees latitude. It is an important mode of climate variability for the Northern Hemisphere. The southern hemisphere analogue is called the Antarctic oscillation or Southern Annular Mode (SAM). The index varies over time with no particular periodicity, and is characterized by non-seasonal sea-level pressure anomalies of one sign in the Arctic, balanced by anomalies of opposite sign centered at about 37–45° N.

The global temperature record shows the fluctuations of the temperature of the atmosphere and the oceans through various spans of time. There are numerous estimates of temperatures since the end of the Pleistocene glaciation, particularly during the current Holocene epoch. Some temperature information is available through geologic evidence, going back millions of years. More recently, information from ice cores covers the period from 800,000 years before the present time until now. A study of the paleoclimate covers the time period from 12,000 years ago to the present. Tree rings and measurements from ice cores can give evidence about the global temperature from 1,000-2,000 years before the present until now. The most detailed information exists since 1850, when methodical thermometer-based records began.
Data assimilation is a mathematical discipline that seeks to optimally combine theory with observations. There may be a number of different goals sought – for example, to determine the optimal state estimate of a system, to determine initial conditions for a numerical forecast model, to interpolate sparse observation data using knowledge of the system being observed, to set numerical parameters based on training a model from observed data. Depending on the goal, different solution methods may be used. Data assimilation is distinguished from other forms of machine learning, image analysis, and statistical methods in that it utilizes a dynamical model of the system being analyzed.

The State of the Climate is an annual report that is primarily led by the National Oceanic and Atmospheric Administration National Climatic Data Center (NOAA/NCDC), located in Asheville, North Carolina, but whose leadership and authorship spans roughly 100 institutions in about 50 countries.
Upper-atmospheric models are simulations of the Earth's atmosphere between 20 and 100 km that comprises the stratosphere, mesosphere, and the lower thermosphere. Whereas most climate models simulate a region of the Earth's atmosphere from the surface to the stratopause, there also exist numerical models which simulate the wind, temperature and composition of the Earth's tenuous upper atmosphere, from the mesosphere to the exosphere, including the ionosphere. This region is affected strongly by the 11 year Solar cycle through variations in solar UV/EUV/Xray radiation and solar wind leading to high latitude particle precipitation and aurora. It has been proposed that these phenomena may have an effect on the lower atmosphere, and should therefore be included in simulations of climate change. For this reason there has been a drive in recent years to create whole atmosphere models to investigate whether or not this is the case.
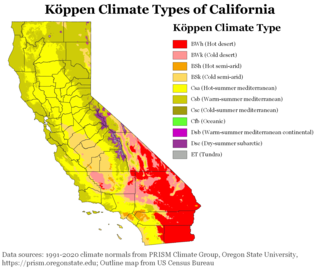
The climate of California varies widely from hot desert to alpine tundra, depending on latitude, elevation, and proximity to the Pacific Coast. California's coastal regions, the Sierra Nevada foothills, and much of the Central Valley have a Mediterranean climate, with warmer, drier weather in summer and cooler, wetter weather in winter. The influence of the ocean generally moderates temperature extremes, creating warmer winters and substantially cooler summers in coastal areas.

The following outline is provided as an overview of and topical guide to the field of Meteorology.
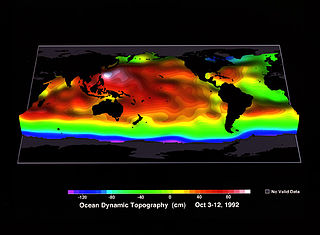
Ocean surface topography or sea surface topography, also called ocean dynamic topography, are highs and lows on the ocean surface, similar to the hills and valleys of Earth's land surface depicted on a topographic map. These variations are expressed in terms of average sea surface height (SSH) relative to Earth's geoid. The main purpose of measuring ocean surface topography is to understand the large-scale ocean circulation.
HadCRUT is the dataset of monthly instrumental temperature records formed by combining the sea surface temperature records compiled by the Hadley Centre of the UK Met Office and the land surface air temperature records compiled by the Climatic Research Unit (CRU) of the University of East Anglia.

Microwave Sounding Unit temperature measurements refers to temperature measurement using the Microwave Sounding Unit instrument and is one of several methods of measuring Earth atmospheric temperature from satellites. Microwave measurements have been obtained from the troposphere since 1979, when they were included within NOAA weather satellites, starting with TIROS-N. By comparison, the usable balloon (radiosonde) record begins in 1958 but has less geographic coverage and is less uniform.
The UAH satellite temperature dataset, developed at the University of Alabama in Huntsville, infers the temperature of various atmospheric layers from satellite measurements of the oxygen radiance in the microwave band, using Microwave Sounding Unit temperature measurements.
The National Centers for Environmental Information (NCEI), an agency of the United States government, manages one of the world's largest archives of atmospheric, coastal, geophysical, and oceanic data, containing information that ranges from the surface of the sun to Earth's core, and from ancient tree ring and ice core records to near-real-time satellite images.

Warming stripes are data visualization graphics that use a series of coloured stripes chronologically ordered to visually portray long-term temperature trends. Warming stripes reflect a "minimalist" style, conceived to use colour alone to avoid technical distractions to intuitively convey global warming trends to non-scientists.

