
The troposphere is the lowest layer of the atmosphere of Earth. It contains 75% of the total mass of the planetary atmosphere and 99% of the total mass of water vapor and aerosols, and is where most weather phenomena occur. From the planetary surface of the Earth, the average height of the troposphere is 18 km in the tropics; 17 km in the middle latitudes; and 6 km in the high latitudes of the polar regions in winter; thus the average height of the troposphere is 13 km.
Altitude is a distance measurement, usually in the vertical or "up" direction, between a reference datum and a point or object. The exact definition and reference datum varies according to the context. Although the term altitude is commonly used to mean the height above sea level of a location, in geography the term elevation is often preferred for this usage.

Water vapor, water vapour or aqueous vapor is the gaseous phase of water. It is one state of water within the hydrosphere. Water vapor can be produced from the evaporation or boiling of liquid water or from the sublimation of ice. Water vapor is transparent, like most constituents of the atmosphere. Under typical atmospheric conditions, water vapor is continuously generated by evaporation and removed by condensation. It is less dense than most of the other constituents of air and triggers convection currents that can lead to clouds and fog.

The lapse rate is the rate at which an atmospheric variable, normally temperature in Earth's atmosphere, falls with altitude. Lapse rate arises from the word lapse, in the sense of a gradual fall. In dry air, the adiabatic lapse rate is 9.8 °C/km. The saturated air lapse rate (SALR), or moist adiabatic lapse rate (MALR), is the decrease in temperature of a parcel of water-saturated air that rises in the atmosphere. It varies with the temperature and pressure of the parcel and is often in the range 3.6 to 9.2 °C/km, as obtained from the International Civil Aviation Organization (ICAO). The environmental lapse rate is the decrease in temperature of air with altitude for a specific time and place. It can be highly variable between circumstances.
Equivalent potential temperature, commonly referred to as theta-e, is a quantity that is conserved during changes to an air parcel's pressure, even if water vapor condenses during that pressure change. It is therefore more conserved than the ordinary potential temperature, which remains constant only for unsaturated vertical motions.

Alpine climate is the typical weather (climate) for elevations above the tree line, where trees fail to grow due to cold. This climate is also referred to as a mountain climate or highland climate.

Cloud physics is the study of the physical processes that lead to the formation, growth and precipitation of atmospheric clouds. These aerosols are found in the troposphere, stratosphere, and mesosphere, which collectively make up the greatest part of the homosphere. Clouds consist of microscopic droplets of liquid water, tiny crystals of ice, or both, along with microscopic particles of dust, smoke, or other matter, known as condensation nuclei. Cloud droplets initially form by the condensation of water vapor onto condensation nuclei when the supersaturation of air exceeds a critical value according to Köhler theory. Cloud condensation nuclei are necessary for cloud droplets formation because of the Kelvin effect, which describes the change in saturation vapor pressure due to a curved surface. At small radii, the amount of supersaturation needed for condensation to occur is so large, that it does not happen naturally. Raoult's law describes how the vapor pressure is dependent on the amount of solute in a solution. At high concentrations, when the cloud droplets are small, the supersaturation required is smaller than without the presence of a nucleus.

In meteorology, convective available potential energy, is the integrated amount of work that the upward (positive) buoyancy force would perform on a given mass of air if it rose vertically through the entire atmosphere. Positive CAPE will cause the air parcel to rise, while negative CAPE will cause the air parcel to sink. Nonzero CAPE is an indicator of atmospheric instability in any given atmospheric sounding, a necessary condition for the development of cumulus and cumulonimbus clouds with attendant severe weather hazards.
The potential temperature of a parcel of fluid at pressure is the temperature that the parcel would attain if adiabatically brought to a standard reference pressure , usually 1,000 hPa (1,000 mb). The potential temperature is denoted and, for a gas well-approximated as ideal, is given by

Thermodynamic diagrams are diagrams used to represent the thermodynamic states of a material and the consequences of manipulating this material. For instance, a temperature–entropy diagram may be used to demonstrate the behavior of a fluid as it is changed by a compressor.

The level of free convection (LFC) is the altitude in the atmosphere where an air parcel lifted adiabatically until saturation becomes warmer than the environment at the same level, so that positive buoyancy can initiate self-sustained convection.
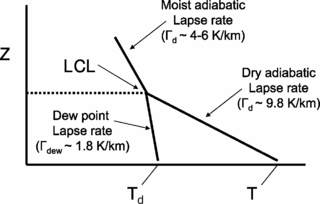
The lifted condensation level or lifting condensation level (LCL) is formally defined as the height at which the relative humidity (RH) of an air parcel will reach 100% with respect to liquid water when it is cooled by dry adiabatic lifting. The RH of air increases when it is cooled, since the amount of water vapor in the air remains constant, while the saturation vapor pressure decreases almost exponentially with decreasing temperature. If the air parcel is lifting further beyond the LCL, water vapor in the air parcel will begin condensing, forming cloud droplets. The LCL is a good approximation of the height of the cloud base which will be observed on days when air is lifted mechanically from the surface to the cloud base.
Atmospheric thermodynamics is the study of heat-to-work transformations that take place in the Earth's atmosphere and manifest as weather or climate. Atmospheric thermodynamics use the laws of classical thermodynamics, to describe and explain such phenomena as the properties of moist air, the formation of clouds, atmospheric convection, boundary layer meteorology, and vertical instabilities in the atmosphere. Atmospheric thermodynamic diagrams are used as tools in the forecasting of storm development. Atmospheric thermodynamics forms a basis for cloud microphysics and convection parameterizations used in numerical weather models and is used in many climate considerations, including convective-equilibrium climate models.
The convective condensation level (CCL) represents the height where an air parcel becomes saturated when heated from below and lifted adiabatically due to buoyancy.

The lifted index (LI) is the temperature difference between the environment Te(p) and an air parcel lifted adiabatically Tp(p) at a given pressure height in the troposphere of the atmosphere, usually 500 hPa (mb). The temperature is measured in Celsius. When the value is positive, the atmosphere is stable and when the value is negative, the atmosphere is unstable.

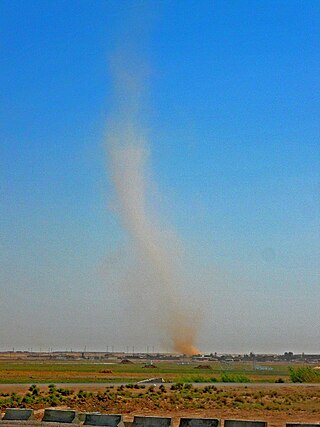
Atmospheric convection is the result of a parcel-environment instability in the atmosphere. Different lapse rates within dry and moist air masses lead to instability. Mixing of air during the day expands the height of the planetary boundary layer, leading to increased winds, cumulus cloud development, and decreased surface dew points. Convection involving moist air masses leads to thunderstorm development, which is often responsible for severe weather throughout the world. Special threats from thunderstorms include hail, downbursts, and tornadoes.
Atmospheric instability is a condition where the Earth's atmosphere is considered to be unstable and as a result local weather is highly variable through distance and time. Atmospheric stability is a measure of the atmosphere's tendency to discourage vertical motion, and vertical motion is directly correlated to different types of weather systems and their severity. In unstable conditions, a lifted thing, such as a parcel of air will be warmer than the surrounding air. Because it is warmer, it is less dense and is prone to further ascent.
Representations of the atmospheric boundary layer in global climate models play a role in simulations of past, present, and future climates. Representing the atmospheric boundary layer (ABL) within global climate models (GCMs) are difficult due to differences in surface type, scale mismatch between physical processes affecting the ABL and scales at which GCMs are run, and difficulties in measuring different physical processes within the ABL. Various parameterization techniques described below attempt to address the difficulty in ABL representations within GCMs.
This glossary of meteorology is a list of terms and concepts relevant to meteorology and atmospheric science, their sub-disciplines, and related fields.

Conditional symmetric instability, or CSI, is a form of convective instability in a fluid subject to temperature differences in a uniform rotation frame of reference while it is thermally stable in the vertical and dynamically in the horizontal. The instability in this case develop only in an inclined plane with respect to the two axes mentioned and that is why it can give rise to a so-called "slantwise convection" if the air parcel is almost saturated and moved laterally and vertically in a CSI area. This concept is mainly used in meteorology to explain the mesoscale formation of intense precipitation bands in an otherwise stable region, such as in front of a warm front. The same phenomenon is also applicable to oceanography.


