2012 United States presidential election

Last updated

2012 United States presidential election
Flag of the United States.svg
  2008 November 6, 2012 2016  

538 members of the Electoral College
270 electoral votes needed to win
Opinion polls
Turnout58.6% [1] Decrease2.svg 3.0 pp
  President Barack Obama, 2012 portrait crop.jpg Mitt Romney by Gage Skidmore 6 cropped.jpg
Nominee Barack Obama Mitt Romney
Party Democratic Republican
Home state Illinois Massachusetts
Running mate Joe Biden Paul Ryan
Electoral vote332206
States carried26 + DC 24
Popular vote65,915,795 [2] 60,933,504 [2]
Percentage51.1%47.2%

ElectoralCollege2012.svg
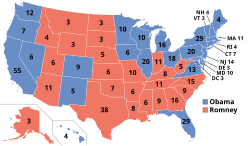
Presidential election results map. Blue denotes states won by Obama/Biden and red denotes those won by Romney/Ryan. Numbers indicate electoral votes cast by each state and the District of Columbia.

President before election

Barack Obama
Democratic

Elected President

Barack Obama
Democratic

The 2012 United States presidential election was the 57th quadrennial presidential election, held on Tuesday, November 6, 2012. Incumbent Democratic President Barack Obama and his running mate, incumbent Vice President Joe Biden, were re-elected to a second term. They defeated the Republican ticket of former Governor Mitt Romney of Massachusetts and Representative Paul Ryan of Wisconsin.

Contents

As the incumbent president, Obama secured the Democratic nomination without serious opposition. The Republicans experienced a competitive primary. Romney was consistently competitive in the polls and won the support of many party leaders, but he faced challenges from a number of more conservative contenders. Romney secured his party's nomination in May, defeating former senator Rick Santorum, former Speaker of the House Newt Gingrich, and Texas congressman Ron Paul, among other candidates.

The campaigns focused heavily on domestic issues, and debate centered largely around sound responses to the Great Recession. Other issues included long-term federal budget issues, the future of social insurance programs, and the Affordable Care Act, Obama's marquee legislative program. Foreign policy was also discussed, including the end of the Iraq War in 2011, military spending, the Iranian nuclear program, and appropriate counteractions to terrorism. Romney attacked Obama's domestic policies as ineffective and financially insolvent while Obama's campaign sought to characterize Romney as a plutocratic businessman who was out of touch with the average American. [3] [4] The campaign was marked by a sharp rise in fundraising, including from nominally independent Super PACs.

Obama defeated Romney, winning a majority of both the Electoral College and the popular vote. Obama won 332 electoral votes and 51.1% of the popular vote compared to Romney's 206 electoral votes and 47.2%. [2] The results of the electoral vote were certified by Congress on January 4, 2013. [5] Obama was the first president to ever win a second term with fewer electoral votes and a smaller popular vote percentage. Nonetheless, he was the first president since Ronald Reagan in 1984 to win a majority of the national popular vote more than once, and the first Democrat to do so since Franklin D. Roosevelt in 1944. Obama also became only the sixth Democratic president in history to win a second term (Andrew Jackson, Grover Cleveland, Woodrow Wilson, Franklin D. Roosevelt, and Bill Clinton), and the third sitting president in a row (after Clinton and George W. Bush) to win a second term.

Obama did not hold onto Indiana, North Carolina, or Nebraska's 2nd congressional district, but crucially won all 18 "blue wall" states and defeated Romney in other swing states the Republicans had won in 2000 and 2004, most notably Colorado, Florida, Ohio, and Virginia. Ultimately, of the nine swing states identified by The Washington Post in the 2012 election, Obama won eight, losing only North Carolina. [6] This is the most recent presidential election in which the Democratic candidate won the states of Iowa, Ohio, and Florida, along with Maine's 2nd congressional district, the most recent presidential election in which the incumbent president won reelection, and the most recent in which neither major party's ticket included a woman. This was the last election in which a presidential candidate received above 70% of the vote in any state, with Hawaii for Obama and Utah for Romney.

All four major candidates for president and vice president went on to hold significant public office after this election. Obama served his second term as president, while Biden also served his second term as vice president and initially retired from politics but was later elected president in 2020, defeating Obama's successor, then-incumbent Donald Trump. This is the most recent election in which two major party nominees would go on to become president. Romney moved to Utah in 2014 and was elected to the Senate there in 2018, succeeding Orrin Hatch. Ryan served three more terms in the House and eventually became Speaker from 2015 until his retirement from politics in 2019.

State changes to voter registration and electoral rules

In 2011, several state legislatures passed new voting laws, especially pertaining to voter identification, with the stated purpose of combating voter fraud; the laws were attacked, however, by the Democratic Party as attempts to suppress voting among its supporters and to improve the Republican Party's presidential prospects. Florida, Georgia, Ohio, [7] Tennessee, and West Virginia's state legislatures approved measures to shorten early voting periods. Florida and Iowa barred all felons from voting. Kansas, South Carolina, [8] Tennessee, Texas, [9] and Wisconsin [10] state legislatures passed laws requiring voters to have government-issued IDs before they could cast their ballots. This meant, typically, that people without driver's licenses or passports had to gain new forms of ID. Former president Bill Clinton denounced them, saying, "There has never been in my lifetime, since we got rid of the poll tax and all the Jim Crow burdens on voting, the determined effort to limit the franchise that we see today". [11] He was referring to Jim Crow laws passed in southern states near the turn of the twentieth century that disenfranchised most blacks from voting and excluded them from the political process for more than six decades. Clinton said the moves would effectively disenfranchise core voter blocs that trend liberal, including college students, black people, and Latinos. [12] [13] The Obama campaign fought against the Ohio law, pushing for a petition and statewide referendum to repeal it in time for the 2012 election. [14]

In addition, the Pennsylvania legislature proposed a plan to change its representation in the electoral college from the traditional winner-take-all model to a district-by-district model. [15] As the governorship and both houses of its legislature were Republican-controlled, the move was viewed by some as an attempt to reduce Democratic chances. [16] [17] [18] Ultimately they did not do it, leaving their winner take all format intact as of 2020.

Nominations

Democratic Party nomination

Primaries

With an incumbent president running for re-election against token opposition, the race for the Democratic nomination was largely uneventful. The nomination process consisted of primaries and caucuses, held by the 50 states, as well as Guam, Puerto Rico, Washington, D.C., U.S. Virgin Islands, American Samoa, and Democrats Abroad. Additionally, high-ranking party members known as superdelegates each received one vote in the convention. A few of the primary challengers surpassed the president's vote total in individual counties in several of the seven contested primaries, though none made a significant impact in the delegate count. Running unopposed everywhere else, Obama cemented his status as the Democratic presumptive nominee on April 3, 2012, by securing the minimum number of pledged delegates needed to obtain the nomination. [19] [20]

Candidate

Democratic Party (United States) Democratic Disc.svg
Democratic Party (United States)
2012 Democratic Party ticket
Barack Obama Joe Biden
for Presidentfor Vice President
President Barack Obama.jpg
Joe Biden official portrait 2013.jpg
44th
President of the United States
(2009–2017)
47th
Vice President of the United States
(2009–2017)
Campaign
Obama Biden 2012 Logo.svg

Republican Party nomination

Primaries

Candidates with considerable name recognition who entered the race for the Republican presidential nomination in the early stages of the primary campaign included U.S. Representative and former Libertarian nominee Ron Paul, former Minnesota Governor Tim Pawlenty, who co-chaired John McCain's campaign in 2008, former Massachusetts Governor Mitt Romney, the runner-up for the nomination in the 2008 cycle, and former Speaker of the House Newt Gingrich.

The first debate took place on May 5, 2011, in Greenville, South Carolina, with businessman Herman Cain, former New Mexico Governor Gary Johnson, Ron Paul, Tim Pawlenty, and former Pennsylvania Senator Rick Santorum participating. Another debate took place a month later, with Newt Gingrich, Mitt Romney, former Utah Governor Jon Huntsman, and Minnesota Congresswoman Michele Bachmann participating, and Gary Johnson excluded. A total of thirteen debates were held before the Iowa caucuses.

The first major event of the campaign was the Ames Straw Poll, which took place in Iowa on August 13, 2011. Michele Bachmann won the straw poll (this ultimately proved to be the acme of her campaign). [21] Pawlenty withdrew from the race after a poor showing in the straw poll, as did Thaddeus McCotter, the only candidate among those who qualified for the ballot who was refused entrance into the debate. [22]

It became clear at around this point in the nomination process that while Romney was considered to be the likely nominee by the Republican establishment, a large segment of the conservative primary electorate found him to be too moderate for their political views. As a result, a number of potential "anti-Romney" candidates were put forward, [23] [24] including future President Donald Trump, [25] former Alaska Governor and 2008 vice-presidential nominee Sarah Palin, [26] New Jersey Governor Chris Christie, [27] and Texas Governor Rick Perry, [28] the last of whom decided to run in August 2011. Perry did poorly in the debates, however, and Herman Cain and then Newt Gingrich came to the fore in October and November.

Due to a number of scandals, Cain withdrew just before the end of the year, after having ballot placement in several states. [29] Around the same time, Johnson, who had been able to get into only one other debate, withdrew to seek the Libertarian Party nomination. [30]

For the first time in modern Republican Party history, three different candidates won the first three state contests in January (the Iowa caucuses, the New Hampshire primary, and the South Carolina primary). [31] Although Romney had been expected to win in at least Iowa and New Hampshire, Rick Santorum won the non-binding poll at caucus sites in Iowa by 34 votes, as near as could be determined from the incomplete tally, earning him a declaration as winner by state party leaders, although vote totals were missing from eight precincts. [32] [33] The election of county delegates at the caucuses would eventually lead to Ron Paul earning 22 of the 28 Iowa delegates to the Republican National Convention. [34] Newt Gingrich won South Carolina by a surprisingly large margin, [35] and Romney won only in New Hampshire.

A number of candidates dropped out at this point in the nomination process. Bachmann withdrew after finishing sixth in the Iowa caucuses, [36] Huntsman withdrew after coming in third in New Hampshire, and Perry withdrew when polls showed him drawing low numbers in South Carolina. [37]

Mitt Romney on the campaign trail Romney 2011 Paradise Valley, AZ rally.jpg
Mitt Romney on the campaign trail

Santorum, who had previously run an essentially one-state campaign in Iowa, was able to organize a national campaign after his surprising victory there. He unexpectedly carried three states in a row on February 7 and overtook Romney in nationwide opinion polls, becoming the only candidate in the race to effectively challenge the notion that Romney was the inevitable nominee. [38] However, Romney won all of the other contests between South Carolina and the Super Tuesday primaries, and regained his first-place status in nationwide opinion polls by the end of February.

The Super Tuesday primaries took place on March 6. Romney carried six states, Santorum carried three, and Gingrich won only in his home state of Georgia. [39] Throughout the rest of March, 266 delegates were allocated in 12 events, including the territorial contests and the first local conventions that allocated delegates (Wyoming's county conventions). Santorum won Kansas and three Southern primaries, but he was unable to make any substantial gain on Romney, who became a formidable frontrunner after securing more than half of the delegates allocated in March.

On April 10, Santorum suspended his campaign due to a variety of reasons, such as a low delegate count, unfavorable polls in his home state of Pennsylvania, and his daughter's health, leaving Mitt Romney as the undisputed front-runner for the presidential nomination and allowing Gingrich to claim that he was "the last conservative standing" in the campaign for the nomination. [40] After disappointing results in the April 24 primaries (finishing second in one state, third in three, and fourth in one), Gingrich dropped out on May 2 in a move that was seen as an effective end to the contest for the nomination. [41] After Gingrich's spokesman announced his upcoming withdrawal, the Republican National Committee declared Romney the party's presumptive nominee. [42] Ron Paul officially remained in the race, but he stopped campaigning on May 14 to focus on state conventions.

On May 29, after winning the Texas primary, Romney had received a sufficient number of delegates to clinch the party's nomination with the inclusion of unpledged delegates. After winning the June 5 primaries in California and several other states, Romney had received more than enough pledged delegates to clinch the nomination without counting unpledged delegates, making the June 26 Utah Primary, the last contest of the cycle, purely symbolic. CNN's final delegate estimate, released on July 27, 2012, put Romney at 1,462 pledged delegates and 62 unpledged delegates, for a total estimate of 1,524 delegates. No other candidate had unpledged delegates. The delegate estimates for the other candidates were Santorum at 261 delegates, Paul at 154, Gingrich at 142, Bachmann at 1, Huntsman at 1, and all others at 0. [43]

On August 28, 2012, delegates at the Republican National Convention officially named Romney the party's presidential nominee. [44] Romney formally accepted the delegates' nomination on August 30, 2012. [45]

Candidate

Republican Party (United States) Republican Disc.svg
Republican Party (United States)
2012 Republican Party ticket
Mitt Romney Paul Ryan
for Presidentfor Vice President
Mitt Romney by Gage Skidmore 6.jpg
Paul Ryan official portrait.jpg
70th
Governor of Massachusetts
(2003–2007)
U.S. Representative
from Wisconsin
(1999–2019)
Campaign
Mitt Romney Paul Ryan logo.svg
[46] [47]

Withdrawn candidates

Candidates in this section are sorted by reverse date of withdrawal from the primaries
Ron Paul Newt Gingrich Rick Santorum Buddy Roemer Rick Perry Jon Huntsman Jr.
Ron Paul, official Congressional photo portrait, 2007.jpg
Newt Gingrich by Gage Skidmore 6.jpg
Rick Santorum by Gage Skidmore 2.jpg
Buddy Roemer by Gage Skidmore.jpg
Rick Perry by Gage Skidmore 4.jpg
Ambassador Jon Huntsman.jpg
U.S. Representative
from Texas
(1997–2013)
50th
Speaker
of the United States
House of Representatives
(1995–1999)
U.S. Senator from Pennsylvania   
(1995–2007)
52nd
Governor of
Louisiana
(1988–1992)
47th
Governor of
Texas
(2000–2015)
U.S. Ambassador
to China
(2009-2011)
Ron Paul 2012 logo.svg
Newt Gingrich 2012 campaign logo.svg
America Needs Buddy for President 2012.png
Rick Perry 2012 campaign logo.svg
Jonhuntsman12.gif
Campaign Campaign Campaign Campaign Campaign Campaign
W: N/A
2,017,957 votes
W: May 2
2,737,442 votes
W: April 10
3,816,110 votes
W: Feb 22
33,212 votes
W: Jan 19
42,251 votes
W: Jan 16
83,173 votes
[48] [49] [50] [51] [52] [53] [54] [55] [56] [57] [58] [59]
Michele Bachmann Gary Johnson Herman Cain Thaddeus McCotter Tim Pawlenty Fred Karger
Michele Bachmann by Gage Skidmore 5.jpg
Garyjohnsonphoto - modified.jpg
Herman Cain by Gage Skidmore 4.jpg
Thaddeus McCotter, official portrait, 112th Congress.jpg
Tim Pawlenty official photo.jpg
Fred Karger 2010.jpg
U.S. Representative
from Minnesota
(2007–2013)
29th
Governor of
New Mexico
(1995–2003)
Chair of the
Federal Reserve
Bank of Kansas City
(1995–1996)
U.S. Representative
from Michigan
(2003–2012)
39th
Governor of
Minnesota
(2003–2011)
Political
Consultant
Bachmann12.gif
Garyjohnson12.gif
HermanCain2012.gif
McCotter logo.gif
Pawlentylogo.gif
Fred Karger logo.png
Campaign Campaign Campaign Campaign Campaign Campaign
W: Jan 4
35,089 votes
W: Dec 28, 2011
4,286 votes
W: Dec 3, 2011
13,538 votes
W: Sep 22, 2011
0 votes
W: Aug 14, 2011
0 votes
W: June 29, 2012

12,776 votes

[60] [61] [62] [63] [64] [65] [66] [67] [68] [69] [70] [71]

Third party and other nominations

Four other parties nominated candidates that had ballot access or write-in access to at least 270 electoral votes, the minimum number of votes needed in the 2012 election to win the presidency through a majority of the electoral college.

Libertarian Party

Green Party

Constitution Party

  • Virgil Goode , former representative from Virginia. [77] Vice-presidential nominee: Jim Clymer from Pennsylvania. [78]

Justice Party

Campaigns

Ballot access

Presidential ticketParty Ballot access [81] VotesPercentage
StatesElectors% of voters
Obama / BidenDemocratic50 + DC 538100%65,915,79551.1%
Romney / RyanRepublican50 + DC538100%60,933,50447.2%
Johnson / GrayLibertarian48 + DC51595.1%1,275,9711.0%
Stein / HonkalaGreen36 + DC43683.1%469,6270.4%
Goode / ClymerConstitution2625749.9%122,3880.1%
Anderson / RodriguezJustice1514528.1%43,018nil
Lindsay / OsorioSocialism & Liberation1311528.6%7,791nil

Candidates in bold were on ballots representing 270 electoral votes.

All other candidates were on the ballots of fewer than 10 states, 100 electors, and less than 20% of voters nationwide.

Financing and advertising

The United States presidential election of 2012 broke new records in financing, fundraising, and negative campaigning. Through grassroots campaign contributions, online donations, and Super PACs, Obama and Romney raised a combined total of more than $2 billion. [82] Super PACs constituted nearly one-fourth of the total financing, with most coming from pro-Romney PACs. [83] Obama raised $690 million through online channels, beating his record of $500 million in 2008. [84] Most of the advertising in the 2012 presidential campaign was decidedly negative—80% of Obama's ads and 84% of Romney's ads were negative. [85] The tax-exempt non-profit Americans for Prosperity, a so-called "outside group", that is, a political advocacy group that is not a political action committee or super-PAC, ran a television advertising campaign opposing Obama described by The Washington Post as "early and relentless". [86] [87] Americans for Prosperity spent $8.4 million in swing states on television advertisements denouncing the American Recovery and Reinvestment Act of 2009 loan guarantee to Solyndra, a manufacturer of solar panels that went bankrupt, [88] an advertising campaign described by The Wall Street Journal in November 2011 as "perhaps the biggest attack on Mr. Obama so far". [89] [90]

Party conventions

Usa edcp location map.svg
Blue pog.svg
Charlotte
Red pog.svg
Tampa
Purple pog.svg
Nashville
Gold pog.svg
Las Vegas
Green pog.svg
Baltimore
Sites of the 2012 national party conventions

Presidential debates

The Commission on Presidential Debates held four debates during the last weeks of the campaign: three presidential and one vice-presidential. The major issues debated were the economy and jobs, the federal budget deficit, taxation and spending, the future of Social Security, Medicare, and Medicaid, healthcare reform, education, social issues, immigration, and foreign policy.

Debate schedule: [97] [98]

Debates among candidates for the 2012 U.S. presidential election
No.DateHostCityModeratorParticipants
Viewership
(million)
P1Wednesday, October 3, 2012 University of Denver Denver, Colorado Jim Lehrer 67.2 [99]
VPThursday, October 11, 2012 Centre College Danville, Kentucky Martha Raddatz 51.4 [99]
P2Tuesday, October 16, 2012 Hofstra University Hempstead, New York Candy Crowley 65.6 [99]
P3Monday, October 22, 2012 Lynn University Boca Raton, Florida Bob Schieffer 59.2 [99]
President Obama talks with Ron Klain during presidential debate preparations. Senator John Kerry, at podium, played the role of Mitt Romney during the preparatory sessions. Barack Obama presidential debate preparations.jpg
President Obama talks with Ron Klain during presidential debate preparations. Senator John Kerry, at podium, played the role of Mitt Romney during the preparatory sessions.

An independent presidential debate featuring minor party candidates took place on Tuesday, October 23 at the Hilton Hotel in Chicago, Illinois. [100] [101] The debate was moderated by Larry King [102] and organized by the Free & Equal Elections Foundation. [101] The participants were Gary Johnson (Libertarian), Jill Stein (Green), Virgil Goode (Constitution), and Rocky Anderson (Justice). [101] [102] A second debate between Stein and Johnson took place on Sunday, November 4, and was moderated by Ralph Nader. [103]

Notable expressions, phrases, and statements

Results

Electoral results

On the day of the election, spread betting firm Spreadex were offering an Obama Electoral College Votes spread of 296–300 to Romney's 239–243. [117] In reality Obama's victory over Romney was far greater, winning 332 electoral votes to Romney's 206. Romney lost all but one of nine battleground states, and received 47 percent of the nationwide popular vote to Obama's 51 percent. [118] [119]

Popular vote totals are from the Federal Election Commission report. [2]

Electoral results
Presidential candidatePartyHome statePopular voteElectoral
vote
Running mate
CountPercentageVice-presidential candidateHome stateElectoral vote
Barack Obama (incumbent) Democratic Illinois 65,915,79551.06%332 Joe Biden (incumbent) Delaware 332
Mitt Romney Republican Massachusetts 60,933,50447.20%206 Paul Ryan Wisconsin 206
Gary Johnson Libertarian New Mexico 1,275,9710.99%0 Jim Gray California 0
Jill Stein Green Massachusetts 469,6270.36%0 Cheri Honkala Minnesota 0
Virgil Goode Constitution Virginia 122,3890.11%0 James N. Clymer Pennsylvania 0
Roseanne Barr Peace and Freedom Utah 67,3260.05%0 Cindy Sheehan California 0
Rocky Anderson Justice Utah 43,0180.03%0 Luis J. Rodriguez Texas 0
Tom Hoefling America's Nebraska 40,6280.03%0 J.D. Ellis Tennessee 0
Other217,1520.17%Other
Total129,085,410100%538538
Needed to win270270
President Obama casts his ballot at the Martin Luther King Jr. Community Center in Chicago. Barack Obama votes in the 2012 election.jpg
President Obama casts his ballot at the Martin Luther King Jr. Community Center in Chicago.
Popular vote
Obama
51.06%
Romney
47.20%
Johnson
0.99%
Stein
0.36%
Others
0.39%
Electoral vote
Obama
61.71%
Romney
38.29%

Results by state

The table below displays the official vote tallies by each state's Electoral College voting method. The source for the results of all states, except those that amended their official results, is the official Federal Election Commission report. [2] The column labeled "Margin" shows Obama's margin of victory over Romney (the margin is negative for every state that Romney won).

Legend
States/districts won by Obama/Biden
States/districts won by Romney/Ryan
At-large results (for states that split electoral votes)
Barack Obama
Democratic
Mitt Romney
Republican
Gary Johnson
Libertarian
Jill Stein
Green
OthersMarginTotal
State/District#%EV#%EV#%EV#%EV#%EV#%#

Flag of Alabama.svg Alabama 795,69638.36%1,255,92560.55%912,3280.59%3,3970.16%6,9920.3%−460,229−22.19%2,074,338AL
Flag of Alaska.svg Alaska 122,64040.81%164,67654.80%37,3922.46%2,9170.97%2,8701.0%−42,036−13.99%300,495AK
Flag of Arizona.svg Arizona 1,025,23244.59%1,233,65453.65%1132,1001.39%7,8160.34%452nil−208,422−9.06%2,299,254AZ
Flag of Arkansas.svg Arkansas 394,40936.88%647,74460.57%616,2761.52%9,3050.87%1,7340.16%−253,335−23.69%1,069,468AR
Flag of California.svg California 7,854,28560.24%554,839,95837.12%143,2211.10%85,6380.66%115,4450.88%3,014,32723.12%13,038,547CA
Flag of Colorado.svg Colorado 1,323,10151.49%91,185,24346.13%35,5451.38%7,5080.29%18,1210.71%137,8585.36%2,569,518CO
Flag of Connecticut.svg Connecticut 905,08358.06%7634,89240.73%12,5800.81%8630.06%5,5420.36%270,19117.33%1,558,960CT
Flag of Delaware.svg Delaware 242,58458.61%3165,48439.98%3,8820.94%1,9400.47%31nil77,10018.63%413,921DE
Flag of the District of Columbia.svg District of Columbia 267,07090.91%321,3817.28%2,0830.71%2,4580.84%7720.26%245,68983.63%293,764DC
Flag of Florida.svg Florida 4,237,75650.01%294,163,44749.13%44,7260.5%8,9470.1%19,3030.2%74,3090.88%8,474,179FL
Flag of Georgia (U.S. state).svg Georgia 1,773,82745.48%2,078,68853.30%1645,3241.2%1,516nil695nil−304,861−7.82%3,900,050GA
Flag of Hawaii.svg Hawaii 306,65870.55%4121,01527.84%3,8400.9%3,1840.7%185,64342.71%434,697HI
Flag of Idaho.svg Idaho 212,78732.40%420,91164.09%49,4531.5%4,4020.7%4,7210.7%−208,124−31.69%652,274ID
Flag of Illinois.svg Illinois 3,019,51257.60%202,135,21640.73%56,2291.1%30,2220.6%835nil884,29616.87%5,242,014IL
Flag of Indiana.svg Indiana 1,152,88743.93%1,420,54354.13%1150,1111.9%625nil368nil−267,656−10.20%2,624,534IN
Flag of Iowa.svg Iowa 822,54451.99%6730,61746.18%12,9260.8%3,7690.2%12,3240.8%91,9275.81%1,582,180IA
Flag of Kansas.svg Kansas 440,72638.05%692,63459.66%620,4561.8%7140.1%5,4410.5%−251,908−21.71%1,159,971KS
Flag of Kentucky.svg Kentucky 679,37037.80%1,087,19060.49%817,0631.0%6,3370.4%7,2520.4%−407,820−22.69%1,797,212KY
Flag of Louisiana.svg Louisiana 809,14140.58%1,152,26257.78%818,1570.9%6,9780.4%7,5270.4%−343,121−17.20%1,994,065LA
Flag of Maine.svg Maine 401,30656.27%2292,27640.98%9,3521.3%8,1191.1%2,1270.3%109,03015.29%713,180ME–AL
Flag of Maine.svg ME-1 Tooltip Maine's 1st congressional district223,03559.57%1142,93738.18%4,5011.2%3,9461.1%80,09821.39%374,149ME1
Flag of Maine.svg ME-2 Tooltip Maine's 2nd congressional district177,99852.94%1149,21544.38%4,8431.4%4,1701.2%28,7838.56%336,226ME2
Flag of Maryland.svg Maryland 1,677,84461.97%10971,86935.90%30,1951.1%17,1100.6%10,3090.4%705,97526.07%2,707,327MD
Flag of Massachusetts.svg Massachusetts 1,921,29060.65%111,188,31437.51%30,9201.0%20,6910.7%6,5520.2%732,97623.14%3,167,767MA
Flag of Michigan.svg Michigan 2,564,56954.21%162,115,25644.71%7,7740.2%21,8970.5%21,4650.5%449,3139.50%4,730,961MI
Flag of Minnesota.svg Minnesota 1,546,16752.65%101,320,22544.96%35,0981.2%13,0230.4%22,0480.8%225,9427.69%2,936,561MN
Flag of Mississippi (2001-2020).svg Mississippi 562,94943.79%710,74655.29%66,6760.5%1,5880.1%3,6250.3%−147,797−11.50%1,285,584MS
Flag of Missouri.svg Missouri 1,223,79644.38%1,482,44053.76%1043,1511.6%7,9360.3%−258,644−9.38%2,757,323MO
Flag of Montana.svg Montana 201,83941.70%267,92855.35%314,1652.9%116nil−66,089−13.65%484,048MT
Flag of Nebraska.svg Nebraska 302,08138.03%475,06459.80%211,1091.4%6,1250.8%−172,983−21.77%794,379NE–AL
Flag of Nebraska.svg NE-1 Tooltip Nebraska's 1st congressional district108,08240.83%152,02157.43%13,8471.2%7620.3%-43,949-16.60%264,712NE1
Flag of Nebraska.svg NE-2 Tooltip Nebraska's 2nd congressional district121,88945.70%140,97652.85%13,3931.3%4690.2%-19,087-7.15%266,727NE2
Flag of Nebraska.svg NE-3 Tooltip Nebraska's 3rd congressional district72,11027.82%182,06770.23%13,8691.5%1,1770.5%−109,957−42.41%259,223NE3
Flag of Nevada.svg Nevada 531,37352.36%6463,56745.68%10,9681.1%9,0100.9%67,8066.68%1,014,918NV
Flag of New Hampshire.svg New Hampshire 369,56151.98%4329,91846.40%8,2121.2%3240.1%2,9570.4%39,6435.58%710,972NH
Flag of New Jersey.svg New Jersey [120] 2,125,10158.38%141,477,56840.59%21,0450.6%9,8880.3%6,6900.2%647,53317.79%3,640,292NJ
Flag of New Mexico.svg New Mexico 415,33552.99%5335,78842.84%27,7883.6%2,6910.3%2,1560.3%79,54710.15%783,758NM
Flag of New York.svg New York [121] 4,485,74163.35%292,490,43135.17%47,2560.7%39,9820.6%17,7490.3%1,995,31028.18%7,081,159NY
Flag of North Carolina.svg North Carolina 2,178,39148.35%2,270,39550.39%1544,5151.0%12,0710.3%−92,004−2.04%4,505,372NC
Flag of North Dakota.svg North Dakota 124,82738.70%188,16358.32%35,2311.6%1,3610.4%3,0450.9%−63,336−19.62%322,627ND
Flag of Ohio.svg Ohio [122] 2,827,70950.67%182,661,43747.69%49,4930.9%18,5730.3%23,6350.4%166,2722.98%5,580,847OH
Flag of Oklahoma.svg Oklahoma 443,54733.23%891,32566.77%7−447,778−33.44%1,334,872OK
Flag of Oregon.svg Oregon 970,48854.24%7754,17542.15%24,0891.4%19,4271.1%21,0911.2%216,31312.09%1,789,270OR
Flag of Pennsylvania.svg Pennsylvania 2,990,27451.97%202,680,43446.59%49,9910.9%21,3410.4%11,6300.2%309,8405.38%5,753,670PA
Flag of Rhode Island.svg Rhode Island 279,67762.70%4157,20435.24%4,3881.0%2,4210.5%2,3590.5%122,47327.46%446,049RI
Flag of South Carolina.svg South Carolina 865,94144.09%1,071,64554.56%916,3210.8%5,4460.3%4,7650.2%−205,704−10.47%1,964,118SC
Flag of South Dakota.svg South Dakota 145,03939.87%210,61057.89%35,7951.6%2,3710.7%−65,571−18.02%363,815SD
Flag of Tennessee.svg Tennessee 960,70939.08%1,462,33059.48%1118,6230.8%6,5150.3%10,4000.4%−501,621−20.40%2,458,577TN
Flag of Texas.svg Texas 3,308,12441.38%4,569,84357.17%3888,5801.1%24,6570.3%2,647nil−1,261,719−15.79%7,993,851TX
Flag of Utah.svg Utah 251,81324.69%740,60072.62%612,5721.2%3,8170.4%8,6380.9%−488,787−47.93%1,017,440UT
Flag of Vermont.svg Vermont 199,23966.57%392,69830.97%3,4871.2%5940.2%3,2721.1%106,54135.60%299,290VT
Flag of Virginia.svg Virginia 1,971,82051.16%131,822,52247.28%31,2160.8%8,6270.2%20,3040.5%149,2983.88%3,854,489VA
Flag of Washington.svg Washington 1,755,39656.16%121,290,67041.29%42,2021.4%20,9280.7%16,3200.5%464,72614.87%3,125,516WA
Flag of West Virginia.svg West Virginia 238,26935.54%417,65562.30%56,3020.9%4,4060.7%3,8060.6%−179,386−26.76%670,438WV
Flag of Wisconsin.svg Wisconsin [123] 1,620,98552.83%101,407,96645.89%20,4390.7%7,6650.3%11,3790.4%213,0196.94%3,068,434WI
Flag of Wyoming.svg Wyoming 69,28627.82%170,96268.64%35,3262.1%3,4871.4%−101,676−40.82%249,061WY
U.S. Total65,915,79551.06%33260,933,50447.20%2061,275,9711.0%469,6270.4%490,5100.4%4,982,2913.86%129,085,410US

Maine and Nebraska each allow for their election results votes to be split between candidates. The winner within each congressional district gets one electoral vote for the district. The winner of the statewide vote gets two additional electoral votes. In the 2012 election, all four of Maine's electoral votes were won by Obama and all five of Nebraska's electoral votes were won by Romney. [124] [125]

Close states

Swing from 2008 to 2012 in each state. Only six states swung more Democratic in 2012: Alaska, Louisiana, Maryland, Mississippi, New Jersey, and New York. The arrows to the right represent how many places up or down on the list the state moved since 2008. States are listed by (increasing) percentage of Democratic votes. Election-state-08-12.png
Swing from 2008 to 2012 in each state. Only six states swung more Democratic in 2012: Alaska, Louisiana, Maryland, Mississippi, New Jersey, and New York. The arrows to the right represent how many places up or down on the list the state moved since 2008. States are listed by (increasing) percentage of Democratic votes.

Reddenotes states (or congressional districts that contribute an electoral vote) won by Republican Mitt Romney; blue denotes those won by Democrat Barack Obama.

State where the margin of victory was under 1% (29 electoral votes):

  1. Florida, 0.88% (74,309 votes)

States where the margin of victory was under 5% (46 electoral votes):

  1. North Carolina, 2.04% (92,004 votes)
  2. Ohio, 2.98% (166,272 votes)
  3. Virginia, 3.88% (149,298 votes)

States/districts where the margin of victory was between 5% and 10% (120 electoral votes):

  1. Colorado, 5.36% (137,858 votes) (tipping point state)
  2. Pennsylvania, 5.38% (309,840 votes)
  3. New Hampshire, 5.58% (39,643 votes)
  4. Iowa, 5.81% (91,927 votes)
  5. Nevada, 6.68% (67,806 votes)
  6. Wisconsin, 6.94% (213,019 votes)
  7. Nebraska's 2nd Congressional District, 7.15% (19,087 votes)
  8. Minnesota, 7.69% (225,942 votes)
  9. Georgia, 7.82% (304,861 votes)
  10. Maine's 2nd Congressional District, 8.56% (28,783 votes)
  11. Arizona, 9.06% (208,422 votes)
  12. Missouri, 9.38% (258,644 votes)
  13. Michigan, 9.50% (449,313 votes)

Statistics

[126]

Counties with highest percent of vote (Democratic)

  1. Shannon County, South Dakota 93.39%
  2. Kalawao County, Hawaii 92.59%
  3. Bronx County, New York 91.45%
  4. Washington, D.C. 90.91%
  5. Petersburg, Virginia 89.79%

Counties with highest percent of vote (Republican)

  1. King County, Texas 95.86%
  2. Madison County, Idaho 93.29%
  3. Sterling County, Texas 92.91%
  4. Franklin County, Idaho 92.77%
  5. Roberts County, Texas 92.13%

Romney's concession

Obama takes a phone call from Romney conceding the election early Wednesday morning in Chicago. Obama takes Romney concession call.jpg
Obama takes a phone call from Romney conceding the election early Wednesday morning in Chicago.

After the networks called Ohio (the state that was arguably the most critical for Romney, as no Republican had ever won the presidency without carrying it) for Obama at around 11:15 pm EST on Election Day, Romney was ready to concede the race, but hesitated when Karl Rove strenuously objected on Fox News to the network's decision to make that call. [127] [128] However, after Colorado and Nevada were called for the President (giving Obama enough electoral votes to win even if Ohio were to leave his column), in tandem with Obama's apparent lead in Florida and Virginia (both were eventually called for Obama), Romney acknowledged that he had lost and conceded at around 1:00 am EST on November 7.

Despite public polling showing Romney behind Obama in the swing states of Nevada, Colorado, Iowa, Wisconsin, Ohio, and New Hampshire, tied with Obama in Virginia, and just barely ahead of Obama in Florida, the Romney campaign said they were genuinely surprised by the loss, having believed that public polling was oversampling Democrats. [129] The Romney campaign had already set up a transition website, and had scheduled and purchased a fireworks display to celebrate in case he won the election. [130] [131]

On November 30, 2012, it was revealed that shortly before the election, internal polling done by the Romney campaign had shown Romney ahead in Colorado and New Hampshire, tied in Iowa, and within a few points of Obama in Wisconsin, Pennsylvania, Minnesota, and Ohio. [132] In addition, the Romney campaign had assumed that they would win Florida, North Carolina and Virginia. [133] The polls had made Romney and his campaign team so confident of their victory that Romney did not write a concession speech until Obama's victory was announced. [134] [135]

Reactions

Foreign leaders reacted with both positive and mixed messages. Most world leaders congratulated and praised Barack Obama on his re-election victory. However, Venezuela and some other states had tempered reactions. Pakistan commented that Romney's defeat had made Pakistan-United States relations safer. Stock markets fell noticeably after Obama's re-election, with the Dow Jones Industrial Average, NASDAQ, and the S&P 500 each declining over two percent the day after the election. [136]

All 50 states had a petition on the White House website We The People calling for their state to secede from the union. These petitions were created by individual people, with some gaining thousands of signatures. [137]

Voter demographics

2012 presidential election by demographic subgroup
Demographic subgroupObamaRomneyOther % of
total vote
Total vote51472100
Ideology
Liberals 8611325
Moderates 5641341
Conservatives 1782135
Party
Democrats 927138
Republicans 693132
Independents 4550529
Gender
Men4552347
Women5544153
Marital status
Married4256260
Unmarried6235340
Sex by marital status
Married men3860229
Married women4653131
Single men5640418
Single women6731223
Race/ethnicity
White 3959272
Black 936113
Asian 732613
Other583842
Hispanic 7127210
Religion
Protestant or other Christian4257153
Catholic 5048225
Mormon 217812
Jewish 693012
Other742337
None 7026412
Religious service attendance
More than once a week3663114
Once a week4158128
A few times a month5544113
A few times a year5642227
Never6234417
White evangelical or born-again Christian?
White evangelical or born-again Christian 2178126
Everyone else6037374
Age
18–24 years old6036411
25–29 years old603828
30–39 years old5542317
40–49 years old4850220
50–64 years old4752128
65 and older4456016
Age by race
Whites 18–29 years old4451511
Whites 30–44 years old3859318
Whites 45–64 years old3861129
Whites 65 and older3961n/a14
Blacks 18–29 years old91813
Blacks 30–44 years old94514
Blacks 45–64 years old937n/a4
Blacks 65 and older93611
Latinos 18–29 years old742334
Latinos 30–44 years old712813
Latinos 45–64 years old683113
Latinos 65 and older6535n/a1
Others673125
LGBT
Yes 762225
No4949295
Education
Not a high school graduate643513
High school graduate5148121
Some college education4948329
College graduate4751229
Postgraduate education 5542318
Family income
Under $30,0006335220
$30,000–49,9995742121
$50,000–99,9994652231
$100,000–199,9994454221
$200,000–249,999475213
Over $250,000425534
Union households
Union 5840218
Non-union4948382
Issue regarded as most important
Economy 4751259
Federal budget deficit 3266215
Foreign policy 5633115
Health care 7524118
Region
Northeast 5940118
Midwest 5048224
South 4653136
West 5443322
Community size
Big cities (population over 500,000)6929211
Mid-sized cities (population 50,000 to 500,000)5840221
Suburbs4850247
Towns (population 10,000 to 50,000)425628
Rural areas3761214

Hispanic vote

The United States has a population of 50 million Hispanic and Latino Americans, 27 million of whom are citizens eligible to vote (13% of total eligible voters). Traditionally, only half of eligible Hispanic voters vote (around 7% of voters); of them, 71% voted for Barack Obama (increasing his percentage of the vote by 5%); therefore, the Hispanic vote was an important factor in Obama's re-election, since the vote difference between the two main parties was only 3.9% [138] [139] [140] [141]

Exit polls were conducted by Edison Research of Somerville, New Jersey, for the National Election Pool, a consortium of ABC News, Associated Press, CBS News, CNN, [142] Fox News, [143] and NBC News. [144]

Analysis

Combined with the re-election victories of his two immediate predecessors, Bill Clinton (1996) and George W. Bush (2004), Obama's victory in the 2012 election marked only the second time in American history that three consecutive presidents were each elected to two full terms after the consecutive two-term presidencies of Thomas Jefferson, James Madison, and James Monroe ending in 1820, which is the only other time any two-term president succeeded another. [145] This was also the first election since 1928 in which neither of the major candidates had any military experience. [146] Eight years later, Obama's successor, Donald Trump, also ran for his own re-election in 2020, but ultimately defeated by Joe Biden, who served as vice president under Obama.

The 2012 election marked the first time since Franklin D. Roosevelt's last two re-elections in 1940 and 1944 that the incumbent Democratic president won a majority of the popular vote in two consecutive elections. [147] Obama was also the first president of either party to secure a majority of the popular vote in two elections since Ronald Reagan in 1980 and 1984. [148] Obama is the third Democratic president to secure at least 51% of the vote twice, after Andrew Jackson and Franklin D. Roosevelt. [149] Romney won the popular vote in 226 congressional districts making this the first time since 1960 that the winner of the election did not win the popular vote in a majority of the congressional districts. [150]

Romney lost his home state of Massachusetts, becoming the first major party presidential candidate to lose his home state since Democrat Al Gore lost his home state of Tennessee to Republican George W. Bush in the 2000 election. [151] Romney lost his home state by more than 23%, the worst losing margin for a major party candidate since John Frémont in 1856. [152] Even worse than Frémont, Romney failed to win a single county in his home state, something last seen by Theodore Roosevelt in 1912. [153] [154] In addition, since Obama carried Ryan's home state of Wisconsin, the Romney–Ryan ticket was the first major party ticket since the 1972 election to have both of its nominees lose their home states. [155] Romney won the popular vote in every county of three states: Utah, Oklahoma, and West Virginia; Obama did so in four states: Vermont, Massachusetts, Rhode Island, and Hawaii. [156]

Romney's loss prompted the Republican National Committee to try to appeal to the American Latino population by concentrating on different approaches to immigration. These were short-lived due to activity and anger from the Republican base and may have contributed to the selection of Donald Trump as their presidential candidate four years later. [157]

Gary Johnson's popular vote total set a Libertarian Party record, and his popular vote percentage was the second-best showing for a Libertarian in a presidential election, trailing only Ed Clark's in 1980. [158] Johnson would go on to beat this record in the 2016 presidential election, winning the most votes for the Libertarian ticket in history. At the time, Green Party candidate Jill Stein's popular vote total made her the most successful female presidential candidate in a general election in United States history. [159] [160] This was later surpassed by Hillary Clinton in the 2016 election.

Obama's vote total was the fourth most votes received in the history of presidential elections (behind Obama's 2008 victory and both major candidates in 2020) and the most ever for a reelected president. The 2012 election marked the first time since 1988 in which no state was won by a candidate with a plurality of the state's popular vote. Furthermore, it is the only post-World War II presidential election in which no states were won by margins smaller than 30,000 votes. Obama's narrowest victories were in New Hampshire by 39,643 votes, followed by Florida by 74,309 votes. Every other presidential election in modern history has seen states narrowly won by several thousand votes. So far, this is the only presidential election in history where both the Republican and Democratic vice presidential candidates are practicing Roman Catholics. It is also the only presidential election where there are no white Protestants on either major party ticket.

Obama was the fourth of just four presidents in United States history to win re-election with a lower percentage of the electoral vote than in their prior elections, the other three were James Madison in 1812, Woodrow Wilson in 1916 and Franklin Roosevelt in 1940 and 1944. Additionally, Obama was the fifth of only five presidents to win re-election with a smaller percentage of the popular vote than in prior elections, the other four are James Madison in 1812, Andrew Jackson in 1832, Grover Cleveland in 1892, and Franklin Roosevelt in 1940 and 1944.

Maps

See also

Related Research Articles

The following is a timeline of major events leading up to the United States presidential election of 2012. The election was the 57th quadrennial United States presidential election and was held on November 6, 2012.

<span class="mw-page-title-main">2012 Republican Party presidential primaries</span> Review of the elections

Voters of the Republican Party elected state delegations to the 2012 Republican National Convention in presidential primaries. The national convention then selected its nominee to run for President of the United States in the 2012 presidential election. There were 2,286 delegates chosen, and a candidate needed to accumulate 1,144 delegate votes at the convention to win the nomination. The caucuses allocated delegates to the respective state delegations to the national convention, but the actual election of the delegates were, many times, at a later date. Delegates were elected in different ways that vary from state to state. They could be elected at local conventions, selected from slates submitted by the candidates, selected at committee meetings, or elected directly at the caucuses and primaries.

A series of political debates were held prior to and during the 2012 Republican primaries, among candidates for the Republican presidential nomination in the national election of 2012. The first debate occurred on May 5, 2011, in Greenville, South Carolina, and was hosted by Fox News, while the last debate was held February 22, 2012, in Mesa, Arizona, and was hosted by CNN.

<span class="mw-page-title-main">2012 United States presidential election in Iowa</span>

The 2012 United States presidential election in Iowa took place on November 6, 2012, as part of the 2012 United States presidential election in which all 50 states plus the District of Columbia participated. Iowa voters chose six electors to represent them in the Electoral College via a popular vote pitting incumbent Democratic President Barack Obama and his running mate, Vice President Joe Biden, against Republican challenger and former Massachusetts Governor Mitt Romney and his running mate, Congressman Paul Ryan.

<span class="mw-page-title-main">Newt Gingrich 2012 presidential campaign</span> 2012 American presidential campaign

The 2012 presidential campaign of Newt Gingrich, former U.S. Representative from Georgia and Speaker of the House, began shortly following the 2010 midterm elections. He was politically active during the midterm elections, and helped several Tea Party-backed Republicans with his endorsements and fundraising abilities.

<span class="mw-page-title-main">Rick Santorum 2012 presidential campaign</span>

Former Senator Rick Santorum of Pennsylvania began a campaign for the 2012 Republican Party nomination for president of the United States in April 2011. He had been preparing for a run since shortly after the 2008 presidential election.

<span class="mw-page-title-main">2012 United States presidential election in New Hampshire</span> Election in New Hampshire

The 2012 United States presidential election in New Hampshire took place on November 6, 2012, as part of the 2012 United States presidential election in which all 50 states plus the District of Columbia participated. New Hampshire voters chose four electors to represent them in the Electoral College via a popular vote pitting incumbent Democratic President Barack Obama and his running mate, Vice President Joe Biden, against Republican challenger and former Massachusetts Governor Mitt Romney and his running mate, Congressman Paul Ryan.

<span class="mw-page-title-main">2012 Iowa Republican presidential caucuses</span>

The 2012 Iowa Republican presidential caucuses took place on January 3, 2012.

<span class="mw-page-title-main">2012 United States presidential election in South Carolina</span> Election in South Carolina

The 2012 United States presidential election in South Carolina took place on November 6, 2012, as part of the 2012 United States presidential election in which all 50 states plus the District of Columbia participated. South Carolina voters chose 9 electors to represent them in the Electoral College via a popular vote pitting incumbent Democratic President Barack Obama and his running mate, Vice President Joe Biden, against Republican challenger and former Massachusetts Governor Mitt Romney and his running mate, Congressman Paul Ryan.

<span class="mw-page-title-main">2012 Florida Republican presidential primary</span>

The 2012 Florida Republican presidential primary was held on January 31, 2012. Fifty delegates were at stake, none of them RNC delegates; it is unclear whether these delegates will be allocated proportionally or winner-take-all. Originally awarded 99 delegates, the Republican National Committee removed half of Florida's delegates because the state committee moved its Republican primary before March 6; the Republican National Committee rules also set the delegate allocation to be proportional because the contest was held before April 1. It is a closed primary. There were 4,063,853 registered Republican voters as of January 3, 2012.

<span class="mw-page-title-main">2012 United States presidential election in Nevada</span>

The 2012 United States presidential election in Nevada took place on November 6, 2012, as part of the 2012 United States presidential election in which all 50 states plus the District of Columbia participated. State voters chose six electors to represent them in the Electoral College via a popular vote pitting incumbent Democratic President Barack Obama and his running mate, Vice President Joe Biden, against Republican challenger and former Massachusetts Governor Mitt Romney and his running mate, Congressman Paul Ryan.

<span class="mw-page-title-main">2012 United States presidential election in Michigan</span> Election in Michigan

The 2012 United States presidential election in Michigan took place on November 6, 2012, as part of the 2012 United States presidential election in which all 50 states plus the District of Columbia participated. Voters chose 16 electors to represent them in the Electoral College via a popular vote pitting incumbent Democratic President Barack Obama and his running mate, Vice President Joe Biden, against Republican challenger and former Massachusetts Governor Mitt Romney and his running mate, Congressman Paul Ryan.

<span class="mw-page-title-main">2012 New Hampshire Republican presidential primary</span>

The 2012 New Hampshire Republican presidential primary took place on Tuesday, January 10, 2012. Former Massachusetts Governor Mitt Romney won the primary.

<span class="mw-page-title-main">2012 United States presidential election in Arkansas</span>

The 2012 United States presidential election in Arkansas took place on November 6, 2012, as part of the 2012 General Election in which all 50 states plus the District of Columbia participated. Arkansas voters chose six electors to represent them in the Electoral College via a popular vote pitting incumbent Democratic President Barack Obama and his running mate, Vice President Joe Biden, against Republican challenger and former Massachusetts Governor Mitt Romney and his running mate, Congressman Paul Ryan.

<span class="mw-page-title-main">2012 United States presidential election in Idaho</span> Election in Idaho

The 2012 United States presidential election in Idaho took place on November 6, 2012, as part of the 2012 United States presidential election in which all 50 states plus the District of Columbia participated. Idaho voters chose four electors to represent them in the Electoral College via a popular vote pitting incumbent Democratic President Barack Obama and his running mate, Vice President Joe Biden, against Republican challenger and former Massachusetts Governor Mitt Romney and his running mate, Congressman Paul Ryan. Prior to the election, 17 news organizations considered this a state Romney would win, or otherwise considered as a safe red state. Romney and Ryan carried Idaho with 64.09% of the popular vote to Obama's and Biden's 32.40%, thus winning the state's four electoral votes. Romney's victory in Idaho made it his fourth strongest state in the 2012 election after Utah, Wyoming and Oklahoma. He improved on McCain's performance in 2008, expanding his margin from 25.3% to 31.69% and flipping Teton County which had previously voted for Obama.

<span class="mw-page-title-main">2012 United States presidential election in North Carolina</span>

The 2012 United States presidential election in North Carolina took place on November 6, 2012, as part of the 2012 general election in which all 50 states plus the District of Columbia participated. North Carolina voters chose 15 electors to represent them in the Electoral College via a popular vote pitting incumbent Democratic President Barack Obama and his running mate, Vice President Joe Biden, against Republican challenger and former Massachusetts Governor Mitt Romney and his running mate, Congressman Paul Ryan.

<span class="mw-page-title-main">2012 United States presidential election in Ohio</span> Election in Ohio

The 2012 United States presidential election in Ohio took place on November 6, 2012, as part of the 2012 United States presidential election in which all 50 states plus the District of Columbia participated. Ohio voters chose 18 electors to represent them in the Electoral College via a popular vote pitting incumbent Democratic President Barack Obama and his running mate, Vice President Joe Biden, against Republican challenger and former Massachusetts Governor Mitt Romney and his running mate, Congressman Paul Ryan. This election continued Ohio's bellwether streak, as the state voted for the winner of the presidency in every election from 1964 to 2016.

<span class="mw-page-title-main">2012 United States presidential election in Pennsylvania</span> Selection of Pennsylvanias presidential electors

The 2012 United States presidential election in Pennsylvania took place on November 6, 2012, as part of the 2012 United States presidential election in which all 50 states plus the District of Columbia participated. The primary election to select the Democratic and Republican candidates had been held on April 24, 2012. Pennsylvania voters chose 20 electors to represent them in the Electoral College via a popular vote pitting incumbent Democratic President Barack Obama and his running mate, Vice President Joe Biden, against Republican challenger and former Massachusetts Governor Mitt Romney and his running mate, Congressman Paul Ryan. Pennsylvania's electoral vote number was a reduction from the 2008 delegation, which had 21 electors. This change was due to reapportionment following the 2010 United States Census. Pennsylvania's 20 electoral votes are allotted on a winner-take-all basis.

<span class="mw-page-title-main">2012 United States presidential election in Kansas</span> Election in Kansas

The 2012 United States presidential election in Kansas took place on November 6, 2012, as part of the 2012 United States presidential election in which all 50 states plus the District of Columbia participated. Kansas voters chose six electors to represent them in the Electoral College via a popular vote pitting incumbent Democratic President Barack Obama and his running mate, Vice President Joe Biden, against Republican challenger and former Massachusetts Governor Mitt Romney and his running mate, Congressman Paul Ryan. Romney and Ryan carried the state with 59.59 percent of the popular vote to Obama's and Biden's 38.00 percent, thus winning the state's six electoral votes.

<span class="mw-page-title-main">2012 United States presidential election in the District of Columbia</span> Election in the District of Columbia

The 2012 United States presidential election in the District of Columbia took place on November 6, 2012, as part of the 2012 United States presidential election in which all 50 states and the District of Columbia participated. D.C. voters chose three electors to represent them in the Electoral College via a popular vote pitting incumbent Democratic President Barack Obama and his running mate, Vice President Joe Biden, against Republican challenger and former Massachusetts Governor Mitt Romney and his running mate, Congressman Paul Ryan. Prior to the election, Washington DC was considered to be a definite win for Obama; the nation's capital is heavily Democratic and has always voted for Democratic nominees for president by overwhelming margins.

References

  1. "National General Election VEP Turnout Rates, 1789-Present". United States Election Project. CQ Press.
  2. 1 2 3 4 5 "Federal Elections 2012" (PDF). Federal Election Commission. Washington, D.C. 2013. Retrieved January 20, 2021.
  3. "Obama: Romney is out of touch". The Christian Science Monitor. September 20, 2012. Retrieved December 11, 2022.
  4. "Romney hits Obama on deficit". Politico. May 16, 2012. Retrieved December 11, 2022.
  5. Congressional Record at H50 (January 4, 2013).
  6. Cillizza, Chris (April 16, 2012). "The 9 swing states of 2012". Washington Post. Retrieved May 19, 2021.
  7. "David Callahan: Ohio's Voter ID Law and the 2012 Election". Huffington Post Politics blog. March 25, 2011. Retrieved October 20, 2011.
  8. "New SC voter ID requirements clears Senate". Charleston: WCBD-TV 2. Archived from the original on September 9, 2011. Retrieved October 20, 2011.
  9. "Rick Perry's agenda may signal run for W.H. – Andy Barr". Politico.Com. February 7, 2011. Retrieved October 20, 2011.
  10. "The Next Election: The Surprising Reality by Andrew Hacker". The New York Review of Books. Retrieved October 20, 2011.
  11. "Bill Clinton likens GOP effort to Jim Crow laws – Darren Samuelsohn". Politico.Com. July 6, 2011. Retrieved October 20, 2011.
  12. Sonmez, Felicia (May 23, 2011). "Republicans rewriting state election laws in ways that could how hurt Democrat". The Washington Post. Retrieved October 20, 2011.
  13. Jackson, Jesse. "38-states-rigging-voting-rules-for-GOP". Chicago Sun-Times. Archived from the original on October 9, 2011. Retrieved October 20, 2011.
  14. Provance, Jim. "Obama campaign fighting Ohio voting law". Toledo Blade. Retrieved October 20, 2011.
  15. "Pennsylvania's 'Democrat-screwing' 2012 'genius plan'". The Week. New York. September 15, 2011. Retrieved October 20, 2011.
  16. Olson, Laura (September 13, 2011). "Change proposed for state's electoral vote process". Pittsburgh Post-Gazette. Retrieved October 20, 2011.
  17. Rosenbaum, Ron (September 13, 2011). "Pennsylvania Ponders Bold Democrat-Screwing Electoral Plan". Slate. Retrieved October 20, 2011.
  18. "Pennsylvania GOP looks to split electoral votes". The Washington Times. September 15, 2011. Retrieved October 20, 2011.
  19. Jackson, David (April 4, 2012)"It's official: Obama clinches Democratic nomination", USA Today . Retrieved April 10, 2012.
  20. (April 4, 2012) "Obama Clinches Democratic Nomination" Archived October 5, 2020, at the Wayback Machine , CNN. Retrieved April 12, 2012.
  21. Goldman, Russell (July 5, 2012). "Michele Bachmann Drops Out of Presidential Race". ABC News.
  22. Summers, Juana (August 11, 2011). "Barred hopefuls make debate plans". Politico . Retrieved July 5, 2012.
  23. Reid, Tim (January 9, 2012). "Romney's rivals running out of time to stop him". Reuters . Retrieved July 5, 2012.
  24. Norington, Brad. "Romney has money but lacks conviction". The Australian . Retrieved July 12, 2012.
  25. Cohn, Alicia M. (December 9, 2011). "Trump says Romney lacks the 'courage' to participate in Newsmax debate". The Hill . Archived from the original on January 11, 2021. Retrieved July 12, 2012.
  26. Stanley, Timothy (March 30, 2012). "If only Sarah Palin had run ..." CNN . Retrieved July 12, 2012.
  27. Avlon, John (August 31, 2011). "Chris Christie's 2012 Tease". The Daily Beast .
  28. Cohen, Tom; Silverleib, Alan (September 1, 2011). "Seeking the 'anti-Romney' in the Republican presidential race". CNN. Archived from the original on July 12, 2012. Retrieved July 12, 2012.
  29. "Herman Cain suspends presidential campaign". Newsday. December 3, 2011. Retrieved July 5, 2012.
  30. Stewart, Rebecca (December 28, 2011). "'Liberated' Gary Johnson seeks Libertarian nomination". CNN. Archived from the original on August 17, 2020. Retrieved December 28, 2011.
  31. Knickerbocker, Brad (January 21, 2012). "Newt Gingrich wins South Carolina. Can he do the same in Florida?". The Christian Science Monitor . Retrieved July 10, 2012.
  32. Rick Santorum Is Declared Winner of Iowa Caucuses by State Party Leaders" (January 21, 2012). Bloomberg News. Archived October 20, 2012, at the Wayback Machine
  33. "2012 GOP caucus count unresolved". Iowa Caucuses. Archived from the original on January 20, 2012. Retrieved November 29, 2015.
  34. "Yes, Ron Paul won the Iowa caucuses". The Des Moines Register. Retrieved November 29, 2015.[ dead link ]
  35. Begala, Paul (January 21, 2012). "Newt Gingrich's Surprise Win in South Carolina Panics Republicans".
  36. Wheaton, Sarah (January 4, 2012). "Bachmann Says She Will Not Continue in the Race". The New York Times.
  37. Zeleny, Jeff; Shear, Michael D. (January 19, 2012). "Perry to End Bid for Presidency". The New York Times. Retrieved July 10, 2012.
  38. Madison, Lucy (February 8, 2012). "Santorum hopes to build momentum from 3-state sweep". CBS News . Retrieved August 27, 2012.
  39. "Results: March 6, 2012 – Super Tuesday". CNN . Retrieved July 12, 2012.
  40. Gabriel, Trip (April 10, 2012). "Gingrich Says He's in the Race to the End". The New York Times .
  41. "Overheard on CNN.com: What brought down Gingrich's campaign? What's next?". CNN . April 25, 2012. Archived from the original on November 25, 2020. Retrieved May 9, 2012.
  42. Shear, Michael D. (April 25, 2012). "Republican National Committee Backs Romney". The New York Times. Retrieved May 2, 2012.
  43. Holland, Steve (May 30, 2012). "Romney clinches Republican 2012 nomination in Texas". Reuters . Retrieved May 30, 2012.
  44. Caldwell, Leigh Ann (August 28, 2012). "Republican delegates nominate Mitt Romney". CBS News. Retrieved August 28, 2012.
  45. O'Brien, Michael (August 30, 2012). "Romney accepts nomination, says 'The time has come to turn the page'". NBC News . Retrieved August 31, 2012.
  46. "Mitt Romney announces bid to be US president in 2012", BBC. June 2, 2011
  47. Elliott, Philip (June 2, 2011). "Romney opens presidential bid — he's got company". Deseret News. Retrieved October 5, 2012.
  48. Good, Chris (May 14, 2012). "Ron Paul to Stop Campaigning in New States". ABC News . Retrieved October 8, 2012.
  49. Marr, Kendra (May 11, 2011). "Newt Gingrich running for president". Politico. Archived from the original on May 13, 2011. Retrieved May 11, 2011.
  50. O'Brien, Michael (April 25, 2012). "Gingrich to leave campaign, but not the national spotlight". MSNBC . Archived from the original on April 25, 2012. Retrieved April 25, 2012.
  51. George, Stephanopoulos (June 6, 2011). "Rick Santorum Will Run for President: 'We're In It to Win'". ABC News . Retrieved June 6, 2011.
  52. Salant, Jonathan D. (June 6, 2011). "Ex-Pennsylvania Senator Santorum Announces '12 Republican Presidential Bid". Bloomberg News . Retrieved June 6, 2011.
  53. "Republican Rick Santorum announces presidential run". The Patriot News . Associated Press. June 6, 2011. Retrieved June 6, 2011.
  54. "Roemer kicks off 2012 presidential bid". KRQE. July 21, 2011. Archived from the original on December 6, 2012. Retrieved October 5, 2012.
  55. McKinnon, Mark (July 21, 2011). "Listen to Candidate Roemer". The Daily Beast. Retrieved July 21, 2011.
  56. Hamby, Peter (January 19, 2012). "Perry drops out, endorses Gingrich". CNN. Archived from the original on January 24, 2012. Retrieved January 25, 2012.
  57. Reston, Maeve (August 13, 2011). "Texas Gov. Rick Perry declares GOP presidential bid". Los Angeles Times. Retrieved August 18, 2011.
  58. "Huntsman's sly web strategy", The Hill. May 11, 2011.
  59. "Jon Huntsman: My Mormonism is 'tough to define'", Politico. May 12, 2011.
  60. Rucker, Philip (January 4, 2012). "Michele Bachmann drops out of GOP race after Iowa caucuses". The Washington Post . Retrieved January 5, 2012.
  61. Rosenwald, Michael S. (June 14, 2011). "Michele Bachmann files paperwork to run for president". The Washington Post.
  62. Burns, Alexander (June 13, 2011). "Michele Bachmann is in". Politico. Retrieved December 3, 2011.
  63. Camia, Catalina (April 21, 2011). "Ex-N.M. governor Gary Johnson announces for president". USA Today.
  64. "Gary Johnson throws his hat into the GOP presidential ring, will he be the 2012 Ron Paul?". Los Angeles Times. April 21, 2011.
  65. Green, Joshua (May 21, 2011) "Herman Cain Makes It Official", The Atlantic. Retrieved May 21, 2011.
  66. Creed, Ryan (May 21, 2011) "Herman Cain, Former CEO of Godfather's Pizza, Announces His Candidacy", ABC News. Retrieved May 22, 2011.
  67. Madison, Lucy (July 1, 2011). "Michigan Rep. Thaddeus McCotter to jump into Republican presidential race". CBS News . Archived from the original on July 4, 2011. Retrieved June 27, 2012.
  68. Summers, Juana (July 20, 2011). "Candidates face off on Twitter". Politico . Retrieved June 27, 2012.
  69. Bakst, Brian (August 14, 2011). "Ex-Minn. Gov. Tim Pawlenty ends White House bid". The Huffington Post. Associated Press . Retrieved August 14, 2011.
  70. Reinhard, Beth (August 13, 2011). "Bachmann Boom; TPaw Bust?". National Journal . Archived from the original on October 25, 2011. Retrieved August 14, 2011.
  71. "Fred Karger officially ends 2012 presidential campaign". Wikinews . June 30, 2012. Retrieved July 5, 2015.
  72. Pratt, Timothy (May 5, 2012). "Libertarians nominate ex-Governor Gary Johnson for president". Reuters . Retrieved May 6, 2012.
  73. Riggs, Mike (May 5, 2012). "Judge Jim Gray Is the 2012 Libertarian Party Vice Presidential Nominee". Reason . Retrieved May 6, 2012.
  74. 1 2 "Mass. doctor Jill Stein wins Green Party's presidential nod". USA Today . Associated Press. July 14, 2012. Archived from the original on July 15, 2012. Retrieved July 15, 2012.
  75. Kilar, Steve (July 14, 2012). "Green Party nominates Jill Stein for president at Baltimore convention". The Baltimore Sun . Archived from the original on June 7, 2013. Retrieved July 15, 2012.
  76. Steinmetz, Katy (July 11, 2012). "The Green Team: Jill Stein's Third-Party Bid to Shake Up 2012". Time . Retrieved July 11, 2012.
  77. "Goode gets Constitution Party's nomination for president". The Roanoke Times . April 21, 2012. Archived from the original on September 8, 2012. Retrieved April 22, 2012.
  78. Hill, Trent (April 21, 2012). "Constitution Party Convention Wrap-Up: vice Presidential Candidate and Officer Elections". Independent Political Report. Retrieved April 22, 2012.
  79. Gehrke, Robert (July 17, 2012). "Rocky picks activist-author as his VP running mate". The Salt Lake Tribune . Retrieved July 18, 2012.
  80. Schwarz, Hunter (January 13, 2012). "Rocky Anderson accepts his newly-formed party's presidential nomination". Deseret News . Retrieved February 1, 2012.
  81. "2012 Ballot Status for President". Ballot-access.org. October 27, 2012. Retrieved July 7, 2013.
  82. Braun, Stephen (December 6, 2012). "$2 Billion Price Tag for Presidential Election". Associated Press. Archived from the original on December 8, 2012. Retrieved December 9, 2012.
  83. Confessore, Nicholas (December 7, 2012). "Little to Show for Cash Flood by Big Donors". The New York Times . Retrieved December 9, 2012.
  84. Scherer, Michael (November 27, 2012). "Exclusive: Obama's 2012 Digital Fundraising Outperformed 2008". Time . Retrieved December 9, 2012.
  85. Hunt, Albert (October 14, 2012). "Barrage of Negative Ads May Haunt President-Elect". Bloomberg News . Retrieved December 9, 2012. The hundreds of thousands of television commercials broadcast by the presidential candidates are lopsidedly negative; this is the case with 80 percent of those put out by President Barack Obama and 84 percent of those for Mitt Romney.
  86. Gold, Matea (January 5, 2014). "The players in the Koch-backed $400 million political donor network". The Washington Post . Retrieved May 9, 2015. Americans for Prosperity, the Virginia-based nonprofit that finances grass-roots activities across the country and ran an early and relentless television ad assault against President Obama during the 2012 campaign.
  87. Boorstin, Julia (November 8, 2011). "Record Political Ad Spending Powered by Special Interests". CNBC . Retrieved April 30, 2015.
  88. Bathon, Michael (October 17, 2012). "Solyndra Lenders Ahead of Government Won't Recover Fully". Bloomberg Business . Retrieved November 14, 2014.
  89. Lacey, Stephen (November 28, 2011). "Koch-Fueled Americans for Prosperity Spends $2.4 Million on Solyndra Attack Ad". ThinkProgress . Center for American Progress. Archived from the original on May 5, 2015. Retrieved May 10, 2015.
  90. Mullins, Brody (January 14, 2012). "Americans for Prosperity to Air Ads Slamming Obama's Ties to Solyndra". The Wall Street Journal. Washington Wire blog. Retrieved April 19, 2015.
  91. Winger, Richard (November 18, 2010) "2012 Constitution Party National Convention Set for Nashville", Ballot Access News. Retrieved November 29, 2010.
  92. Myers, Laura (November 30, 2010) "Las Vegas will host Libertarian convention" Las Vegas Review-Journal . Retrieved November 30, 2010.
  93. Cristina Silva (May 5, 2012). "Gary Johnson Wins 2012 Libertarian Nomination". The Huffington Post. Associated Press. Retrieved June 17, 2012.
  94. "Green Party National Convention will be in Baltimore". Ballot Access News. November 11, 2011. Retrieved November 12, 2011.
  95. Barr, Andy; Mike Allen (May 12, 2010) "Republicans pick Tampa for 2012 convention", Politico. Retrieved May 13, 2010.
  96. Falcone, Michael (February 1, 2011). "2012 Democratic National Convention To Be Held In Charlotte, N.C." ABC News. Archived from the original on September 1, 2012. Retrieved October 5, 2012.
  97. Kiely, Kathy (October 31, 2011). "Fall 2012 Presidential Debates Set". National Journal. Retrieved October 31, 2011.
  98. Blake, Aaron (August 13, 2012) "Presidential debate moderators announced: Crowley is first woman in 20 years", The Washington Post . Retrieved August 15, 2012.
  99. 1 2 3 4 "CPD: 2012 Debates". www.debates.org. Retrieved January 8, 2019.
  100. "Third-party candidates finally get their own presidential debate", The Washington Post. October 24, 2012. Retrieved February 11, 2013.
  101. 1 2 3 Sullivan, Sean (October 23, 2012). "Third-party candidates debate: United against Obama, Romney". The Seattle Times . Retrieved October 24, 2012.
  102. 1 2 "Larry King to moderate third-party debate". CBS News . Associated Press. October 17, 2012. Retrieved October 18, 2012.
  103. Lowrey, Annie (November 5, 2012). "Another Presidential Debate, but This Time the Candidates Are Much Less Familiar (Published 2012)". The New York Times. ISSN   0362-4331 . Retrieved February 8, 2021.
  104. David A. Fahrenthold (February 16, 2012). "Mitt Romney reframes himself as a 'severely conservative' governor". The Washington Post.
  105. Mitt Romney's 'Severe Conservatism'. The Weekly Standard (September 18, 2012). Retrieved August 12, 2013.
  106. Frum, David (February 13, 2012). ""Mitt Romney's 'severely' bad moves"". CNN.
  107. Paul Krugman (February 13, 2012). "Severe Conservative Syndrome". The New York Times.
  108. "Rush On Romney @ CPAC: I Have Never Heard Anybody Say 'I'm Severely Conservative'". Daily Rushbo. February 10, 2012. Archived from the original on April 2, 2015.
  109. Jillian Rayfield (October 23, 2012). "Obama: The '80s called, they want their foreign policy back". Salon.
  110. Rogers, Katie (October 23, 2012). "Horses and bayonets catch on during final US presidential debate". The Guardian.
  111. Burns, Alexander (September 22, 2011). "Gary Johnson's moment". Politico.
  112. "Romnesia". hcfama.org. Archived from the original on December 1, 2011.
  113. Kantrowitz, Alex (October 21, 2012). "#Romnesia: A Made for Social Media Attack Line". Forbes. Retrieved October 22, 2012.
  114. Collins, Lauren (September 18, 2012). "Romneyshambles, Part II". The New Yorker.
  115. "'Gangnam Style,' 'fiscal cliff,' 'Romneyshambles' chosen as Collins Dictionary's words of the year". Daily News . December 20, 2012.
  116. Korecki, Natasha (December 2, 2019). "No malarkey? Biden's old-school slogan gets mocked and praised in Iowa". Politico.
  117. "US Election Betting | Financial Spread Betting | Spreadex". www.spreadex.com. November 7, 2012. Retrieved August 11, 2020.
  118. "Obama defeats Romney to win second term, vows he has 'more work to do'". Fox News. November 7, 2012.
  119. Memoli, Michael A. (January 4, 2013). "It's official: Obama, Biden win second term". Los Angeles Times.
  120. "2012 Election Information" . Retrieved February 25, 2013.
  121. "NYS Board of Elections President and Vice-President Election Returns Nov. 6, 2012" (PDF). Archived from the original (PDF) on July 25, 2013. Retrieved May 2, 2013.
  122. "Final Results". Archived from the original on July 29, 2013. Retrieved February 25, 2013.
  123. "Wisconsin Fall 2012 General Election Results". Archived from the original on January 29, 2013. Retrieved January 18, 2013.
  124. "State of Maine Certificate of Ascertainment of Electors" (PDF). Retrieved December 18, 2012.
  125. "Official Results of Nebraska General Election – November 6, 2012" (PDF). Retrieved December 26, 2012.
  126. 2012 Presidential General Election Data – National, Uselectionatlas.org.
  127. Kranish, Michael (December 22, 2012). "The story behind Mitt Romney's loss in the presidential campaign to President Obama". Boston Globe. Archived from the original on May 28, 2013. Retrieved February 1, 2016.
  128. "The Real Reason for Karl Rove's Election Night Denial". Newsweek . January 21, 2014.
  129. "Adviser: Romney "shellshocked" by loss". CBS News. November 8, 2012. Archived from the original on November 9, 2012. Retrieved November 10, 2012.
  130. "Romney's Transition Site". Political Wire. November 7, 2012. Archived from the original on November 8, 2012. Retrieved November 30, 2012.
  131. "Romney campaign spent $25,000 on fireworks". Boston Globe. November 9, 2012. Archived from the original on November 11, 2012. Retrieved November 11, 2012.
  132. Silver, Nate (December 1, 2012). "When Internal Polls Mislead, a Whole Campaign May Be to Blame". The New York Times . Retrieved December 21, 2012.
  133. "Exclusive: The Internal Polls That Made Mitt Romney Think He'd Win". The New Republic . November 30, 2012. Retrieved November 30, 2012.
  134. Rucker, Phillip (November 7, 2012). "Romney's belief in himself never wavered". The Washington Post . Retrieved November 30, 2012.
  135. Reeve, Elspeth (November 8, 2012). "The Whole Romney Ticket Believed in Unskewed Polls?". The Atlantic Wire . Archived from the original on December 30, 2012. Retrieved December 17, 2012.
  136. Cheng, Jonathan (November 7, 2012). "Dow's 300-Point Slide Takes It Back to August Levels". The Wall Street Journal. Retrieved November 7, 2012.
  137. Ryan, Danielle (November 14, 2012). "White House receives secession pleas from all 50 states". Los Angeles Times. Retrieved July 10, 2023.
  138. Krogstad, Jens Manuel; Lopez, Mark Hugo; López, Gustavo; Passel, Jeffrey S.; Patten, Eileen (January 19, 2016). "1. Looking Forward to 2016: The Changing Latino Electorate". Pew Research Center.
  139. Krogstad, Jens Manuel; Lopez, Mark Hugo; López, Gustavo; Passel, Jeffrey S.; Patten, Eileen (January 19, 2016). "Millennials Make Up Almost Half of Latino Eligible Voters in 2016". Pew Research Center.
  140. Krogstad, Jens Manuel (February 3, 2016). "2016 electorate will be the most diverse in U.S. history". Pew Research Center.
  141. Valdes, Marcela (September 18, 2016). "27 Million Potential Hispanic Votes. But What Will They Really Add Up To?". The New York Times.
  142. "Presidential Race – 2012 Election Center – Elections & Politics from CNN.com". CNN. Retrieved February 5, 2018.
  143. "Fox News Exit Polls". Fox News. Archived from the original on January 26, 2013. Retrieved January 27, 2013.
  144. "President Exit Polls". The New York Times. Retrieved January 27, 2013.
  145. Hum, Robert (November 7, 2012). "Two-Term Presidency Musings". CNBC. Archived from the original on July 29, 2013. Retrieved February 12, 2013.
  146. Dilanian, Ken (August 11, 2012) "Ryan pick cements lack of military service in presidential race", Los Angeles Times . Retrieved December 11, 2014.
  147. Nichols, John (November 9, 2012). "Obama's 3 Million Vote, Electoral College Landslide, Majority of States Mandate". The Nation. New York. Retrieved November 18, 2012.
  148. Giroux, Greg (January 4, 2013). "Final Tally Shows Obama First Since '56 to Win 51% Twice". Bloomberg. Retrieved February 12, 2013.
  149. Frank, Steve (January 7, 2014) "Obama first presidential candidate since Eisenhower to top 51% twice", MSNBC.com. Retrieved December 11, 2014.
  150. Bensen, Clark (April 4, 2013). "Presidential Results By Congressional Districts: Obama is reelected but Romney carries a majority of districts" (PDF). Cookpolitical.com. Retrieved June 25, 2017.
  151. Gabbatt, Adam (October 19, 2012). "Romney poised to lose home state by wider margin than any other candidate". The Guardian. London. Retrieved February 12, 2013.
  152. Ostermeier, Eric (November 14, 2012). "20 Presidential Tickets That Lost Both Home States". Smart Politics (University of Minnesota blog). Archived from the original on November 15, 2012. Retrieved February 12, 2013.
  153. "2012 Presidential General Election Data – Massachusetts by County". Dave Leip's U.S. Election Atlas. Retrieved March 8, 2013.
  154. "Presidential Election of 1856 – Map by counties". Atlas of U.S. Presidential Elections. Retrieved March 9, 2013.
  155. Ostermeier, Eric (November 14, 2012). "20 Presidential Tickets That Lost Both Home States". Smart Politics.
  156. Blow, Charles M. (November 9, 2012) "Election Data Dive", The New York Times . Retrieved December 11, 2014.
  157. Harwood, John. "Donald Trump Takes Advantage of a Republican Party Pitted Against Itself." New York Times. October 6, 2016. October 6, 2016.
  158. Harrington, Gerry (November 8, 2012). "Libertarian Party buoyant; Greens hopeful". United Press International. Retrieved February 12, 2013.
  159. Wood, Daniel (November 30, 2015). "Harvard Grad Jill Stein Faces Uphill Battle for Presidency". The Harvard Crimson.
  160. Herzog, Katie (March 14, 2016). "Meet the presidential candidate who makes Bernie Sanders look conservative". Grist Magazine.
  161. Wells, Charlie (November 6, 2012). "Empire State Building lights up to broadcast election results". Daily News . New York.

Further reading