| Candidates | 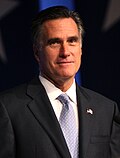
Mitt
Romney | 
Ron
Paul | 
Newt
Gingrich | 
Rick
Santorum | 
Rick
Perry | 
Jon
Huntsman | 
Michele
Bachmann | Totals |
Total delegates (Projection)
(Total: 2,286, Unprojected: 239) | 1,489
(65.1%) | 154
(6.7%) | 142
(6.2%) | 258
(11.3%) | 0
(0.0%) | 3
(0.1%) | 1
(0.1%) | 2,047
(89.5%) |
Superdelegates (Pledged)
(Total: 120 , Unprojected: 60) [7] | 54
(43.3%) | 1
(0.8%) | 2
(1.7%) | 1
(0.8%) | 0
(0.0%) | 0
(0.0%) | 0
(0.0%) | 60
(50.0%) |
Projected delegates [2]
(Total: 2,166, Unprojected: 257) | 1,355
(62.6%) | 153
(7.0%) | 140
(6.4%) | 257
(20.3%) | 0
(0.0%) | 3
(0.1%) | 1
(0.1%) | 1,909
(88.1%) |
Popular vote totalsb
| 10,031,336
(52.13%) | 2,095,762
(10.89%) | 2,734,571
(14.21%) | 3,932,069
(20.43%) | 54,769
(0.28%) | 83,918
(0.44%) | 41,199
(0.21%) | 18,973,624
(19,242,663) |
| Jan. 3 | Iowa
Nonbinding Precinct Caucuses | 25%
(0 delegates)
(29,805 votes) | 21%
(21 delegates)
(26,036 votes) | 13%
(0 delegates)
(16,163 votes) | 25%
(1 delegates)
(29,839 votes) | 10%
(0 delegates)
(12,557 votes) | 1%
(0 delegates)
(739 votes) | 5%
(0 delegates)
(6,046 votes) | 22
(121,501 votes) |
| Jan. 10 | New Hampshire
Binding Primary | 39%
(7 delegates)
(97,591 votes) | 23%
(3 delegates)
(56,872 votes) | 9%
(0 delegates)
(23,421 votes) | 9%
(0 delegates)
(23,432 votes) | 1%
(0 delegates)
(1,764 votes) | 17%
(2 delegates)
(41,964 votes) | 0%
(0 delegates)
(350 votes) | 12 *
(2 unprojected)
(248,475 votes) |
| Jan. 21 | South Carolina
Binding Primary | 28%
(2 delegates)
(168,123 votes) | 13%
(0 delegates)
(78,360 votes) | 40%
(23 delegates)
(244,065 votes) | 17%
(0 delegates)
(102,475 votes) | 0%
(0 delegates)
(2,534 votes) | 0%
(0 delegates)
(1,173 votes) | 0%
(0 delegates)
(491 votes) | 25 *
(603,770 votes) |
| Jan. 31 | Florida
Binding Primary | 46%
(50 delegates)
(776,159 votes) | 7%
(0 delegates)
(117,461 votes) | 32%
(0 delegates)
(534,121 votes) | 13%
(0 delegates)
(223,249 votes) | 0%
(0 delegates)
(6,775 votes) | 0%
(0 delegates)
(6,204 votes) | 0%
(0 delegates)
(3,967 votes) | 50 *
(1,672,634 votes) |
| Feb. 4 | Nevada
Binding Precinct Caucuses | 50%
(14 delegates)
(16,486 votes) | 19%
(5 delegates)
(6,175 votes) | 21%
(6 delegates)
(6,956 votes) | 10%
(3 delegates)
(3,277 votes) | | | | 28
(32,961 votes) |
| Feb. 7 | Colorado
Nonbinding Precinct Caucuses | 35%
(12 delegates)
(23,012 votes) | 12%
(4 delegates)
(7,759 votes) | 13%
(4 delegates)
(8,445 votes) | 40%
(13 delegates)
(26,614 votes) | 0%
(0 delegates)
(52 votes) | 0%
(0 delegates)
(46 votes) | 0%
(0 delegates)
(28 votes) | 0
(3 unprojected)
(66,027 votes) |
Minnesota
Nonbinding Precinct Caucuses | 17%
(1 delegates)
(8,240 votes) | 27%
(32 delegates)
(13,282 votes) | 11%
(0 delegates)
(5,263 votes) | 45%
(2 delegates)
(21,988 votes) | | | | 0
(2 unprojected)
(48,916 votes) |
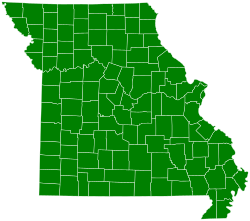
Missouri a
Nonbinding Primary | 25%
(0 delegates)
(63,882 votes) | 12%
(0 delegates)
(30,647 votes) | | 55%
(0 delegates)
(139,272 votes) | 1%
(0 delegates)
(2,456 votes) | 0%
(0 delegates)
(1,044 votes) | 1%
(0 delegates)
(1,680 votes) | 0
(252,185 votes) |
Feb. 4–11
(Jan. 29 –
Mar. 3) c | Maine (disputed)
Nonbinding Municipal Caucuses | 38%
(2 delegates)
(2,373 votes) | 36%
(21 delegates)
(2,258 votes) | 6%
(0 delegates)
(405 votes) | 18%
(0 delegates)
(1,136 votes) | | | | 0
(1 unprojected)
(6,250 votes) |
| Feb. 28 | Arizona
Binding Primary | 47%
(29 delegates)
(239,167 votes) | 9%
(0 delegates)
(43,952 votes) | 16%
(0 delegates)
(81,748 votes) | 27%
(0 delegates)
(138,031 votes) | 0%
(0 delegates)
(2,023 votes) | | | 29 *
(510,258 votes) |
Michigan
Binding Primary | 41%
(16 delegates)
(409,522 votes) | 12%
(0 delegates)
(115,911 votes) | 7%
(0 delegates)
(65,027 votes) | 38%
(14 delegates)
(377,372 votes) | 0%
(0 delegates)
(1,816 votes) | 0%
(0 delegates)
(1,674 votes) | 0%
(0 delegates)
(1,735 votes) | 30 *
(996,499 votes) |
| Feb. 11–29 | Wyoming
Nonbinding Precinct Caucuses | 39%
(0 delegates)
(822 votes) | 21%
(0 delegates)
(439 votes) | 8%
(0 delegates)
(165 votes) | 32%
(0 delegates)
(673 votes) | | | | 0
(2 unprojected)
(2,108 votes) |
| Mar. 3 | Washington
Nonbinding Precinct Caucuses | 38%
(16 delegates)
(19,111 votes) | 25%
(10 delegates)
(12,594 votes) | 10%
(4 delegates)
(5,221 votes) | 24%
(10 delegates)
(12,089 votes) | – | – | – | 0
(3 unprojected)
(50,764 votes) |
Mar. 6
Super Tuesday |
Alaska
Binding Legislative District Conventions | 32%
(8 delegates)
(4,285 votes) | 24%
(6 delegates)
(3,175 votes) | 14%
(3 delegates)
(1,865 votes) | 29%
(7 delegates)
(3,860 votes) | | | | 27
(3 unprojected)
(13,219 votes) |
Georgia
Binding Primary | 26%
(20 delegates)
(233,611 votes) | 7%
(0 delegates)
(59,100 votes) | 47%
(53 delegates)
(425,395 votes) | 20%
(3 delegates)
(176,259 votes) | 0%
(0 delegates)
(1,696 votes) | 0%
(0 delegates)
(1,813 votes) | 0%
(0 delegates)
(1,714 votes) | 76
(901,470 votes) |
Idaho
Binding County Caucuses | 62%
(32 delegates)
(27,514 votes) | 18%
(0 delegates)
(8,086 votes) | 2%
(0 delegates)
(940 votes) | 18%
(0 delegates)
(8,115 votes) | | | | 32
(44,672 votes) |
Massachusetts
Binding Primary | 72%
(38 delegates)
(266,313 votes) | 10%
(0 delegates)
(35,219 votes) | 5%
(0 delegates)
(16,991 votes) | 12%
(0 delegates)
(44,564 votes) | 0%
(0 delegates)
(991 votes) | 1%
(0 delegates)
(2,268 votes) | 0%
(0 delegates)
(865 votes) | 41
(3 unprojected)
(370,425 votes) |
North Dakota
Binding Legislative Districts Caucuses
| 24%
(7 delegates)
(2,691 votes) | 28%
(8 delegates)
(3,186 votes) | 8%
(2 delegates)
(962 votes) | 40%
(11 delegates)
(4,510 votes) | | | | 28
(11,349 votes) |
Ohio
Binding Primary | 38%
(35 delegates)
(460,831 votes) | 9%
(0 delegates)
(113,256 votes) | 15%
(0 delegates)
(177,183 votes) | 37%
(21 delegates)
(448,580 votes) | 1%
(0 delegates)
(7,539 votes) | 1%
(0 delegates)
(6,490 votes) | | 66
(3 unprojected)
(1,213,879) |
Oklahoma
Binding Primary | 28%
(13 delegates)
(80,356 votes) | 10%
(0 delegates)
(27,596 votes) | 27%
(13 delegates)
(78,730 votes) | 34%
(14 delegates)
(96,849 votes) | 0%
(0 delegates)
(1,291 votes) | 0%
(0 delegates)
(750 votes) | 0%
(0 delegates)
(951 votes) | 43
(3 unprojected)
(286,523 votes) |
Tennessee
Binding Primary | 28%
(16 delegates)
(155,630 votes) | 9%
(0 delegates)
(50,156 votes) | 24%
(10 delegates)
(132,889 votes) | 37%
(29 delegates)
(205,809 votes) | 0%
(0 delegates)
(1,966 votes) | 0%
(0 delegates)
(1,239 votes) | 0%
(0 delegates)
(1,895 votes) | 58
(3 unprojected)
(554,573 votes) |
Vermont
Binding Primary | 39%
(9 delegates)
(24,008 votes) | 25%
(4 delegates)
(15,391 votes) | 8%
(0 delegates)
(4,949 votes) | 24%
(4 delegates)
(14,368 votes) | 1%
(0 delegates)
(544 votes) | 2%
(0 delegates)
(1,198 votes) | | 17
(60,850 votes) |
Virginia
Binding Primary | 60%
(43 delegates)
(158,119 votes) | 40%
(3 delegates)
(107,451 votes) | | | | | | 49
(3 unprojected)
(265,570 votes) |
| Mar. 10 | Kansas
Binding Precinct Caucuses | 21%
(7 delegates)
(6,250 votes) | 13%
(0 delegates)
(3,767 votes) | 14%
(0 delegates)
(4,298 votes) | 51%
(33 delegates)
(15,290 votes) | 0%
(0 delegates)
(37 votes) | 0%
(0 delegates)
(38 votes) | 0%
(0 delegates)
(16 votes) | 40
(29,857 votes) |
Guam
Territorial Caucus | 96%
(6 delegates)
(207 votes) | 0%
(0 delegates)
(0 votes) | 0%
(0 delegates)
(0 votes) | 0%
(0 delegates)
(0 votes) | – | – | – | 9
(3 unprojected)
(215 votes) |
N. Mariana Islands
Convention Caucus | 87%
(6 delegates)
(740 votes) | 3%
(0 delegates)
(28 votes) | 3%
(0 delegates)
(27 votes) | 6%
(0 delegates)
(53 votes) | – | – | – | 9
(3 unprojected)
(848 votes) |
U.S. Virgin Islands f
Territorial Caucuses | 27%
(8 delegates)
(104 votes) | 29%
(1 delegate)
(112 votes) | 5%
(0 delegates)
(19 votes) | 6%
(0 delegates)
(23 votes) | | | | 9
(390 votes) |
| Mar. 13 | Alabama
Binding Primary | 29%
(11 delegates)
(180,321 votes) | 5%
(0 delegates)
(30,937 votes) | 29%
(14 delegates)
(182,276 votes) | 35%
(22 delegates)
(215,105 votes) | 0%
(0 delegates)
(1,867 votes) | 0%
(0 delegates)
(1,049 votes) | 0%
(0 delegates)
(1,700 votes) | 50
(3 unprojected)
(622,514 votes) |
Hawaii
Binding Precinct Caucuses | 44%
(9 delegates)
(4,548 votes) | 19%
(3 delegates)
(1,975 votes) | 11%
(0 delegates)
(1,116 votes) | 25%
(5 delegates)
(2,589 votes) | | | | 20
(3 unprojected)
(10,228 votes) |
Mississippi
Binding Primary | 31%
(12 delegates)
(90,161 votes) | 4%
(0 delegates)
(12,955 votes) | 31%
(12 delegates)
(91,612 votes) | 33%
(13 delegates)
(96,258 votes) | 0%
(0 delegates)
(1,350 votes) | 0%
(0 delegates)
(413 votes) | 0%
(0 delegates)
(971 votes) | 40
(3 unprojected)
(294,112 votes) |
American Samoa
Territorial Caucus | N/A
(6 delegates)
(N/A votes) | N/A
(0 delegates)
(N/A votes) | N/A
(0 delegates)
(N/A votes) | N/A
(0 delegates)
(N/A votes) | – | – | – | 9
(3 unprojected)
(~70 votes) |
| Mar. 18 | Puerto Rico
Binding Primary | 83%
(20 delegates)
(106,431 votes) | 1%
(0 delegates)
(1,595 votes) | 2%
(0 delegates)
(2,702 votes) | 8%
(0 delegates)
(10,574 votes) | | | | 23
(3 unprojected)
(128,834 votes) |
| Mar. 20 | Illinois e
Binding Primary | 47%
(42 delegates)
(435,859 votes) | 9%
(0 delegates)
(87,044 votes) | 8%
(0 delegates)
(74,482 votes) | 35%
(12 delegates)
(326,778 votes) | 1%
(0 delegates)
(5,568 votes) | | | 54
(933,454 votes) |
| Mar. 24 | Louisiana e
Binding Primary | 27%
(5 delegates)
(49,758 votes) | 6%
(0 delegates)
(11,467 votes) | 16%
(0 delegates)
(29,656 votes) | 49%
(10 delegates)
(91,321 votes) | 1%
(0 delegates)
(955 votes) | 0%
(0 delegates)
(242 votes) | 0%
(0 delegates)
(622 votes) | 20
(5 unprojected) [8]
(186,410 votes) |
| Apr. 3 | Maryland
Binding Primary | 49%
(37 delegates)
(122,400 votes) | 10%
(0 delegates)
(23,609 votes) | 11%
(0 delegates)
(27,240 votes) | 29%
(0 delegates)
(71,349 votes) | 0%
(0 delegates)
(1,108 votes) | 1%
(0 delegates)
(1,484 votes) | | 37
(248,468 votes) |
Washington, D.C.
Binding Primary | 68%
(18 delegates)
(3,577 votes) | 12%
(0 delegates)
(621 votes) | 11%
(0 delegates)
(558 votes) | | | 7%
(0 delegates)
(348 votes) | | 19
(1 unprojected)
(5,257 votes) |
Wisconsin
Binding Primary | 44%
(30 delegates)
(346,876 votes) | 11%
(0 delegates)
(87,858 votes) | 6%
(0 delegates)
(45,978 votes) | 37%
(6 delegates)
(290,139 votes) | | 1%
(0 delegates)
(5,083 votes) | 1%
(0 delegates)
(6,045 votes) | 42
(6 unprojected)
(787,847 votes) |
| Apr. 24 | Connecticut
Binding Primary | 67%
(25 delegates)
(40,171 votes) | 13%
(0 delegates)
(8,032 votes) | 10%
(0 delegates
(6,132 votes) | 7%
(0 delegates)
(4,072 votes) | | | | 28
(3 unprojected)
(59,578 votes) |
Delaware
Binding Primary | 56%
(17 delegates)
(16,143 votes) | 11%
(0 delegates)
(3,017 votes) | 27%
(0 delegates)
(7,742 votes) | 6%
(0 delegates)
(1,690 votes) | | | | 17
(28,592 votes) |
New York
Binding Primary | 62%
(92 delegates)
(118,912 votes) | 15%
(0 delegates)
(27,699 votes) | 13%
(0 delegates)
(23,990 votes) | 10%
(0 delegates)
(18,997 votes) | | | | 95
(3 unprojected)
(190,515 votes) |
Pennsylvania e
Binding Primary | 58%
(0 delegates)
(468,374 votes) | 13%
(0 delegates)
(106,148 votes) | 10%
(0 delegates)
(84,537 votes) | 18%
(0 delegates)
(149,056 votes) | | | | 59
(59 unprojected)
(808,115 votes) |
Rhode Island
Binding Primary | 63%
(12 delegates)
(9,178 votes) | 24%
(4 delegates)
(3,473 votes) | 6%
(0 delegates)
(880 votes) | 6%
(0 delegates)
(825 votes) | | | | 19
(3 unprojected)
(14,564 votes) |
| May 8 | Indiana e
Binding Primary | 65%
(27 delegates)
(410,635 votes) | 16%
(0 delegate)
(98,487 votes) | 6%
(0 delegate)
(41,135 votes) | 13%
(0 delegate)
(85,332 votes) | | | | 27
(635,589 votes) |
North Carolina
Binding Primary | 66%
(36 delegates)
(638,601 votes) | 11%
(6 delegates)
(108,217 votes) | 8%
(4 delegates)
(74,367 votes) | 10%
(6 delegates)
(101,093 votes) | | | | 55
(3 unprojected)
(973,206 votes) |
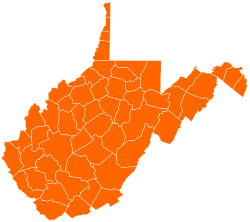
West Virginia
Binding Primary | 70%
(21 delegates)
(78,197 votes) | 11%
(0 delegate)
(12,412 votes) | 6%
(0 delegate)
(7,076 votes) | 12%
(2 delegates)
(13,590 votes) | | | | 31
(5 unprojected)
(112,416 votes) |
| May 15 | Nebraska
Nonbinding Primary | 71%
(0 delegates)
(131,436 votes) | 10%
(0 delegates)
(18,508 votes) | 5%
(0 delegates)
(9,628 votes) | 14%
(0 delegates)
(25,830 votes) | | | | 0
(185,402 votes) |
Oregon
Binding Primary | 71%
(18 delegates)
(204,176 votes) | 13%
(3 delegates)
(36,810 votes) | 5%
(1 delegate)
(15,451 votes) | 9%
(3 delegates)
(27,042 votes) | | | | 28
(3 unprojected)
(287,955 votes) |
| May 22 | Arkansas
Binding Primary | 68%
(33 delegates)
(104,200 votes) | 13%
(0 delegates)
(20,399 votes) | 5%
(0 delegates)
(7,453 votes) | 13%
(0 delegates)
(20,308 votes) | | | | 36
(3 unprojected)
(152,360 votes) |
Kentucky
Binding Primary | 67%
(42 delegates)
(117,621 votes) | 13%
(0 delegates)
(22,074 votes) | 6%
(0 delegates)
(10,479 votes) | 9%
(0 delegates)
(15,629 votes) | | | | 45
(3 unprojected)
(176,160 votes) |
| May 29 [9] | Texas
Binding Primary | 69%
(105 delegates)
(1,001,387 vot.) | 12%
(18 delegates)
(174,207 votes) | 5%
(7 delegates)
(68,247 votes) | 8%
(12 delegates)
(115,584 votes) | | 1%
(1 delegate)
(8,695 votes) | 1%
(1 delegate)
(12,097 votes) | 155
(9 unprojected)
(1,449,477 votes) |
| June 5 | California
Binding Primary | 80%
(169 delegates)
(1,530,513 vot.) | 10%
(0 delegates)
(199,246 votes) | 4%
(0 delegates)
(72,022 votes) | 5%
(0 delegates)
(102,258 votes) | | | | 172
(3 unprojected)
(1,924,970 votes) |
Montana
Nonbinding Primary | 68%
(1 delegate)
(96,121 votes) | 14%
(0 delegates)
(20,227 votes) | 4%
(0 delegates)
(6,107 votes) | 9%
(0 delegates)
(12,546 votes) | | | | 0
(140,457 votes) |
New Jersey
Binding Primary | 81%
(50 delegates)
(188,121 votes) | 10%
(0 delegates)
(24,017 votes) | 3%
(0 delegates)
(7,212 votes) | 5%
(0 delegates)
(12,115 votes) | | | | 50
(231,465 votes) |
New Mexico
Binding Primary | 73%
(20 delegates)
(65,935 votes) | 10%
(0 delegates)
(9,363 votes) | 6%
(0 delegates)
(5,298 votes) | 10%
(0 delegates)
(9,517 votes) | | | | 23
(3 unprojected)
(90,113 votes) |
South Dakota
Binding Primary | 66%
(25 delegates)
(34,035 votes) | 13%
(0 delegates)
(6,708 votes) | 4%
(0 delegates)
(2,071 votes) | 11%
(0 delegates)
(5,917 votes) | | | | 28
(3 unprojected)
(51,527 votes) |
| June 26 | Utah
Binding Primary | 93%
(25 delegates)
(220,865 votes) | 5%
(0 delegates)
(11,209 votes) | 0%
(0 delegates)
(1,124 votes) | 2%
(0 delegates)
(3,541 votes) | | | | 40
(237,317 votes) |
| Withdrawal date | Presidential
nominee | ---- | May 2,
2012 | April 10,
2012 | January 19,
2012 | January 16,
2012 | January 4,
2012 | |