1912 Democratic Party presidential primaries

Last updated

1912 Democratic Party presidential primaries
Flag of the United States (1908-1912).svg
March 19 to June 4, 1912 1916  

1,088 delegates to the 1912 Democratic National Convention
726 (two-thirds) votes needed to win
  President Woodrow Wilson portrait December 2 1912.jpg ChampClark.png
Candidate Woodrow Wilson Champ Clark
Home state New Jersey Missouri
Delegate count324440.5
Contests won55
Popular vote435,169405,537
Percentage44.6%41.6%

  HARMON, JUDSON. GOVERNOR LCCN2016856774.jpg Oscar W. Underwood.jpg
Candidate Judson Harmon Oscar Underwood
Home state Ohio Alabama
Delegate count148117.5
Contests won1
Popular vote116,294
Percentage11.9%

1912 Democratic presidential primaries.svg
First ballot of the 1912 Democratic National Convention.svg
     Wilson     Clark     Underwood
     Harmon     Baldwin     Various [a]

Previous Democratic nominee

William Jennings Bryan

Democratic nominee

Woodrow Wilson

From March 19 to June 4, 1912, voters of the Democratic Party elected delegates to the 1912 Democratic National Convention for the purpose of choosing a nominee for president in the 1912 election. [1]

Contents

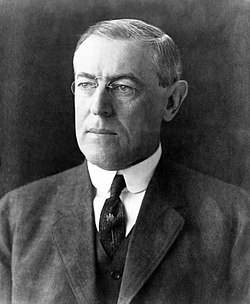
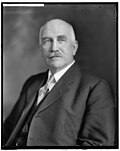
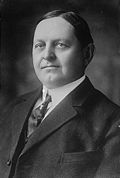
The primaries were inconclusive, with Speaker of the House Champ Clark holding a lead over Woodrow Wilson, but neither candidate close to the two-thirds of the delegates necessary to secure the nomination. In third place, Ohio governor Judson Harmon boasted the support of his home state and New York, the largest single delegation. House Majority Leader Oscar Underwood had strong support from the Deep South but little appeal outside the region.

At the convention, Wilson eventually secured the nomination over Clark after forty back-and-forth ballots.

Candidates

Nominee

CandidateExperienceHome stateCampaignPopular voteContests wonRunning mate
Woodrow Wilson Woodrow Wilson (1912).jpg Governor of New Jersey
(1910–1913)
President of Princeton University
(1902–1910)
Flag of New Jersey.svg  New Jersey (Campaign)
Secured nomination:
July 2, 1912
435,169
(44.6%)
[ data missing ] Thomas R. Marshall

Defeated at convention

CandidateExperienceHome stateCampaignPopular voteContests won
Champ Clark ChampClark.png Speaker of the United States House of Representatives
(1911–1919)
Leader of the House Democratic Caucus
(1909–1921)
U.S. Representative from Missouri
(1893–95, 1897–1921)
Flag of Missouri.svg  Missouri (Campaign)

Defeated at convention:
July 2, 1912

405,537
(41.6%)
[ data missing ]
Judson Harmon JudsonHarmon.png Governor of Ohio
(1909–1913)
United States Attorney General
(1895–1897)
Flag of Ohio.svg  Ohio (Campaign)
Defeated at convention:
July 2, 1912
116,294
(11.9%)
[ data missing ]
Oscar Underwood Oscar Wilder Underwood circa 1920 (cropped).jpg House Majority Leader
(1911–1915)
House Minority Whip
(1899–1901)
U.S. Representative from Alabama
(1895–96, 1897–1915)
Flag of Alabama.svg  Alabama (Campaign)

Defeated at convention:
July 2, 1912

[ data missing ]
Simeon E. Baldwin Simeon E. Baldwin LCCN2014685131 (3x4a).jpg Governor of Connecticut
(1911–1915)
Chief Justice of the Connecticut Supreme Court
(1907–1910)
Associate Justice of the Connecticut Supreme Court
(1897–1907)
Flag of Connecticut.svg  Connecticut Withdrew at convention[ data missing ]

Favorite sons

Results

Total

CandidateVotes%
Woodrow Wilson 435,16944.64
Champ Clark 405,53741.60
Judson Harmon116,29411.93
John Burke9,3570.96
Others8,4180.86
Total974,775100.00
Source: [2]

By state

StateDate Woodrow Wilson Champ Clark Judson Harmon John Burke Others
North Dakota March 19N/AN/AN/A100.0%
9,357
N/A
Wisconsin April 255.7%
45,945
44.2%
36,464
N/AN/A0.2%
148
Illinois April 925.7
75,527
74.3%
218,483
N/AN/AN/A
Pennsylvania April 13100.0%
98,000 [b]
N/AN/AN/AN/A
Nebraska April 1927.9%
14,289
41.0%
21,027
24.3%
12,454
N/A6.8%
3,499
Oregon April 1953.0%
9,588
43.4%
7,857
3.3%
606
N/A0.3%
49
Massachusetts April 3029.9%
15,002
68.9%
34,575
N/AN/A1.2%
627
Maryland May 634.3%
21,490
54.4%
34,021
11.3%
7,070
N/AN/A
California May 1428.5%
17,214
71.5%
43,163
N/AN/AN/A
Ohio May 2145.7%
85,084
1.3%
2,428
51.7%
96,164
N/A1.3%
2,440
New Jersey May 2898.9%
48,336
1.1%
522 [c]
N/AN/AN/A
South Dakota June 435.2%
4,694
32.0%
4,275
20.4%
2,722 [d]
N/AN/A12.4%
1,655
Legend:  1st place
(popular vote)
2nd place
(popular vote)
3rd place
(popular vote)


See also

Notes

    1. Favorite sons received the support of Indiana (Thomas R. Marshall) and North Dakota (John Burke).
    2. "Unofficial" figure
    3. Write-in candidate
    4. The pro-Clark vote was split between two slates of delegates. The first one, labeled "Wilson-Clark-Bryan" received 32% while the second one, labeled "Champ Clark" received 20%. Clark's people accused the latter slate of being a scheme to split the vote.

    References

    1. Kalb, Deborah (February 19, 2016). Guide to U.S. Elections - Google Books. ISBN   9781483380353 . Retrieved February 19, 2016.
    2. Presidential elections, 1789-1996. Congressional Quarterly. 1997. pp. 149–150. ISBN   9781568020655.{{cite book}}: |archive-url= requires |url= (help)