Results of the 2016 Democratic Party presidential primaries

Last updated

Results of the Democratic Party presidential primaries
2012
2020

This article includes the entire 2016 Democratic Party presidential primary schedule in a format that includes result tabulation. Below are the vote totals for everyone that appeared on the ballot during the 2016 Democratic presidential primaries. Two candidates, Bernie Sanders and Hillary Clinton, appeared on all 57 ballots. Two others, Martin O'Malley and Rocky De La Fuente, appeared in over 30 states and six others appeared on between two and ten states. Nearly 20 appeared on only New Hampshire's ballot. As of June 8, Hillary Clinton was considered the presumptive nominee according to media organizations. [1] On July 26, the second day of the Democratic National Convention, Clinton was confirmed the Democratic nominee for the 2016 United States presidential election. [2]

Contents

Overview

U.S. States by Vote Distribution, 2016 (Democratic Party).svg Democratic Party presidential primaries results, 2016 by margin of victory.svg Delegation Vote, 2016 (Democratic Party, only pledged delegates).svg Delegation Vote ,2016 (Democratic Party, total delegates).svg Democratic Party presidential primaries results by county, 2016.svg Democratic Party presidential primary results by county by popular vote margin 2.svg

2016 Democratic Party presidential primaries delegate count.svg

2016 Democratic Party presidential primaries delegates.svg 2016 Democratic Party presidential primaries popular vote.svg

Major candidates

The following are the results of candidates that have won at least one state. These candidates are on the ballots for every state, territory, and federal district contest. The results of caucuses do not always have attached preference polls and attendance can be extremely limited. The unpledged delegate count may not always reflect the latest declared preferences. Results are collected by The New York Times . [3] For explanations of the various types of primaries see primary elections in the United States.

DateState/territoryCalculated delegatesType [lower-alpha 1] Popular vote or equivalent [lower-alpha 2] Estimated delegates [lower-alpha 3]
Clinton
Hillary Clinton by Gage Skidmore 2.jpg
Sanders
Bernie Sanders September 2015 cropped.jpg
Clinton Sanders Available [lower-alpha 4]
PUTPUTPUTPUT
Feb 1 Iowa [4] 44751Semi-open caucus700 SDE (49.8%)697 SDE (49.6%)2362921021011
Feb 9 New Hampshire [5] 24832Semi-closed primary95,355 (37.7%)152,193 (60.1%)961515116011
Feb 20 Nevada [6] 35843Closed caucus6,316 CD (52.6%)5,678 CD (47.3%)2072715116000
Feb 27 South Carolina [7] 53659Open primary272,379 (73.4%)96,498 (26.0%)3954414014011
Mar 1 Alabama [8] 53760Open primary309,926 (77.8%)76,401 (19.2%)44650909011
American Samoa [9] 6511Closed caucus162 (68.4%)61 (25.7%)448213000
Arkansas [10] 32537Open primary146,057 (66.1%)66,236 (30.0%)2252710010000
Colorado [11] 661278Closed caucus49,789 (40.3%)72,846 (59.0%)2593441041033
Georgia [12] 10215117Open primary543,008 (71.3%)214,332 (28.2%)73118429029044
Massachusetts [13] [14] 9124115Semi-closed primary606,822 (49.7%)589,803 (48.3%)46216745146022
Minnesota [15] 771693Open caucus73,510 (38.4%)118,135 (61.6%)31124346248022
Oklahoma [16] [17] 38442Semi-closed primary139,443 (41.5%)174,228 (51.9%)1711821122022
Tennessee [18] 67875Open primary245,930 (66.1%)120,800 (32.5%)4485223023000
Texas [19] 22229251Open primary936,004 (65.2%)476,547 (33.2%)1472116875075088
Vermont [20] [21] 161026Open primary18,338 (13.6%)115,900 (85.7%)05516521000
Virginia [22] 9513108Open primary504,741 (64.3%)276,370 (35.2%)62127433033011
Mar 5 Kansas [23] 33437Closed caucus12,593 (32.3%)26,450 (67.7%)1041423023000
Louisiana [24] 51859Closed primary221,733 (71.1%)72,276 (23.2%)3764314014022
Nebraska [25] 25530Closed caucus14,340 (42.9%)19,120 (57.1%)1031315116011
Mar 6 Maine [26] 25530Closed caucus1,232 SCD (35.5%)2,231 SCD (64.3%)841217118000
Mar 1–8 Democrats Abroad [27] 134 [lower-alpha 5] 17Closed primary10,689 (30.9%)23,779 (68.9%)49½011
Mar 8 Michigan [28] [29] 13017147Open primary581,775 (48.3%)598,943 (49.7%)63137667067044
Mississippi [30] 36541Open primary187,334 (82.5%)37,748 (16.6%)31334527000
Mar 12 Northern Marianas [31] 6511Closed caucus102 (54.0%)65 (34.4%)459202000
Mar 15 Florida [32] [33] 21432246Closed primary1,101,414 (64.4%)568,839 (33.3%)1412416573275066
Illinois [34] 15627183Open primary1,039,555 (50.6%)999,494 (48.6%)79241037717801 [lower-alpha 4] 1 [lower-alpha 4]
Missouri [35] 711384Open primary312,285 (49.6%)310,711 (49.4%)36114735035022
North Carolina [36] 10714121Semi-closed primary622,915 (54.5%)467,018 (40.9%)6096947249033
Ohio [37] [38] 14317160Semi-open primary696,681 (56.1%)535,395 (43.1%)81169762163000
Mar 22 Arizona [39] [40] 751085Closed primary262,459 (56.3%)192,962 (41.4%)4264833134033
Idaho [41] 23427Open caucus5,065 (21.2%)18,640 (78.0%)51618220011
Utah [42] 33437Semi-open caucus15,666 (20.3%)61,333 (79.3%)62827229000
Mar 26 Alaska [43] [44] 16420Closed caucus2,146 (20.2%)8,447 (79.6%)31413114022
Hawaii [45] 25934Semi-closed caucus10,125 (30.0%)23,530 (69.8%)851317219022
Washington [46] 10117118Open caucus7,140 LDD (27.1%)19,159 LDD (72.7%)27113874074066
Apr 5 Wisconsin [47] [48] 861096Open primary433,739 (43.1%)570,192 (56.6%)3894748149000
Apr 9 Wyoming [49] 14418Closed caucus124 SCD (44.3%)156 SCD (55.7%)7411707000
Apr 19 New York [50] [51] [52] 24744291Closed primary1,133,980 (57.5%)820,256 (41.6%)139411801080108033
Apr 26 Connecticut [53] [54] 551671Closed primary170,045 (51.8%)152,379 (46.4%)28154327027011
Delaware [55] [56] 211132Closed primary55,954 (59.8%)36,662 (39.2%)121123909000
Maryland [57] [58] 9524119Closed primary573,242 (62.5%)309,990 (33.8%)60177735136066
Pennsylvania [59] 18919208Closed primary935,107 (55.6%)731,881 (43.5%)1061912583083011
Rhode Island [60] [61] 24933Semi-closed primary52,749 (43.1%)66,993 (54.7%)1192013013000
May 3 Indiana [62] 83992Open primary303,705 (47.5%)335,074 (52.5%)3974644044022
May 7 Guam [63] 7512Closed caucus777 (59.5%)528 (40.5%)459303000
May 10 Nebraska [64] Closed primary42,692 (53.1%)37,744 (46.9%)Non-binding primary with no delegates allocated.
West Virginia [65] 29837Semi-closed primary86,914 (35.8%)124,700 (51.4%)1161718220000
May 17 Kentucky [66] [67] 55560Closed primary212,534 (46.8%)210,623 (46.3%)2823027027033
Oregon [68] [69] 611374Closed primary269,846 (42.1%)360,829 (56.2%)2573236339033
May 24 Washington [70] Open primary [71] [lower-alpha 6] 420,461 (52.4%)382,293 (47.6%)Non-binding primary with no delegates allocated.
Jun 4 Virgin Islands [72] [73] [74] 7512Closed caucus1,326 (87.12%)196 (12.88%)7512000000
Jun 5 Puerto Rico [75] 60767Open primary52,658 (59.7%)33,368 (37.9%)3764323023011
Jun 7 California [76] [77] 47576551Semi-closed primary2,745,302 (53.1%)2,381,722 (46.0%)25466320221022101010
Montana [78] [79] 21627Open primary55,805 (44.2%)65,156 (51.6%)1051511112000
New Jersey [80] [81] [82] 12616142Semi-closed primary566,247 (63.3%)328,058 (36.7%)79129147249022
New Mexico [83] [84] 34943Closed primary111,334 (51.5%)104,741 (48.5%)1892716016000
North Dakota [85] 18523Open caucus [86] [lower-alpha 7] 106 SCD (25.6%)258 SCD (64.2%)51613114033
South Dakota [87] [88] 20525Semi-closed primary [89] 27,047 (51.0%)25,959 (49.0%)1021210010033
Jun 14 District of Columbia [90] [91] 202545Closed primary76,704 (78.0%)20,361 (20.7%)162339426000
Total4,0517124,76316,847,084
(55.20%) [lower-alpha 8]
13,168,222
(43.14%) [lower-alpha 8]
2,205570½2,775½1,84643½1,889½097 [lower-alpha 4] 97 [lower-alpha 4]
DateState/territoryPUTTypeClintonSandersPUTPUTPUT
Calculated delegatesPopular vote or equivalentClinton delegatesSanders delegatesAvailable delegates

Detailed results

February

Iowa

  • Precinct caucuses: February 1
  • County conventions: March 12
  • District conventions: April 30
  • State convention: June 18
e    d   2016 Democratic Party's presidential nominating process in Iowa
– Summary of results –
CandidateState delegate equivalentsEstimated delegates
CountPercentagePledgedUnpledgedTotal
America Symbol.svg Hillary Clinton 700.4749.84%23629
Bernie Sanders 696.9249.59%21021
Martin O'Malley 7.630.54%000
Uncommitted0.460.03%011
Total1,405.48100%44751
Source: The Green Papers , Iowa Democrats

New Hampshire

New Hampshire Democratic primary, February 9, 2016
CandidatePopular voteEstimated delegates
CountOf totalPledgedUnpledgedTotal
Bernie Sanders 152,19360.14%15116
Hillary Clinton 95,35537.68%9615
Martin O'Malley (withdrawn)6670.26%
Vermin Supreme 2680.11%
David John Thistle2260.09%
Graham Schwass1430.06%
Steve Burke1080.04%
Rocky De La Fuente 960.04%
John Wolfe Jr. 540.02%
Jon Adams530.02%
Lloyd Thomas Kelso460.02%
Keith Russell Judd 440.02%
Eric Elbot360.01%
Star Locke330.01%
William D. French290.01%
Mark Stewart Greenstein290.01%
Edward T. O'Donnell260.01%
James Valentine240.01%
Robert Lovitt220.01%
Michael Steinberg210.01%
William H. McGaughey Jr.190.01%
Henry Hewes 180.01%
Edward Sonnino170.01%
Steven Roy Lipscomb150.01%
Sam Sloan 150.01%
Brock C. Hutton140.01%
Raymond Michael Moroz80.00%
Richard Lyons Weil80.00%
Write-ins [lower-alpha 9] 3,4751.37%
Uncommitted011
Total253,062100%24832
Sources: The Green Papers , [93] New Hampshire Secretary of State [94]

Nevada

Nevada Democratic caucuses, February 20, 2016
CandidateCounty delegatesEstimated delegates
CountPercentagePledgedUnpledgedTotal
Hillary Clinton 6,44052.64%20424
Bernie Sanders 5,78547.29%15116
Uncommitted80.07%033
Total12,233100%35843
Source: The Green Papers

South Carolina

South Carolina Democratic primary, February 27, 2016
CandidatePopular voteEstimated delegates
CountPercentagePledgedUnpledgedTotal
Hillary Clinton 272,37973.44%39544
Bernie Sanders 96,49826.02%14014
Willie Wilson 1,3140.35%
Martin O'Malley (withdrawn)7130.19%
Uncommitted011
Total votes370,904100%53659
Sources: The Green Papers , South Carolina State Election Commission

Super Tuesday

Alabama

e    d   2016 Democratic Party's presidential nominating process in Alabama
– Summary of results –
CandidatePopular vote
(March 1 primary)
Estimated delegates
CountPercentagePledgedUnpledgedTotal
Hillary Clinton (campaign)309,92877.84%44650
Bernie Sanders (campaign)76,39919.19%909
Martin O'Malley (campaign) (withdrawn)1,4850.37%
Rocky De La Fuente (campaign)8110.20%
Uncommitted9,5342.39%011
Total398,157100%53760
Sources: The Green Papers , Alabama Democratic Party certified Election Results as received by Secretary of State of Alabama

Arkansas

e    d   2016 Democratic Party's presidential nominating process in Arkansas
– Summary of results –
CandidatePopular voteEstimated delegates
CountPercentagePledgedUnpledgedTotal
Hillary Clinton 146,05766.08%22527
Bernie Sanders 66,23629.97%10010
Martin O'Malley (withdrawn)2,7851.26%
John Wolfe Jr. 2,5561.16%
James Valentine1,7020.77%
Rocky De La Fuente 1,6840.76%
Total221,020100%32537
Sources: The Green Papers and Official County results (provisional) Arkansas Secretary of State

American Samoa

e    d   2016 Democratic Party's presidential nominating process in American Samoa
– Summary of results –
CandidatePopular voteEstimated delegates
CountPercentagePledgedUnpledgedTotal
Hillary Clinton 16268.4%448
Bernie Sanders 6125.7%213
Rocky De La Fuente 145.9%
Total237100%6511
Source: The Green Papers

Colorado

e    d   2016 Democratic Party's presidential nominating process in Colorado
– Summary of results –
CandidatePopular voteEstimated delegates
CountPercentagePledgedUnpledgedTotal
Bernie Sanders 72,84658.98%41041
Hillary Clinton 49,78940.31%25934
Uncommitted8220.67%033
Others510.04%
Total123,508100%661278
Sources: The Green Papers and Colorado Democrats 2016 Caucus results

Georgia

e    d   2016 Democratic Party's presidential nominating process in Georgia
– Summary of results –
CandidatePopular voteEstimated delegates
CountPercentagePledgedUnpledgedTotal
Hillary Clinton 545,67471.30%731184
Bernie Sanders 215,79728.20%29029
Martin O'Malley (withdrawn)2,1290.28%
Michael Steinberg 1,7660.23%
Uncommitted044
Total765,366100%10215117
Source: The Green Papers

Massachusetts

Results of the Massachusetts Democratic primary on March 1, 2016
CandidatePopular vote [95] Estimated delegates [96]
CountPercentagePledgedUnpledgedTotal
Hillary Clinton 606,82249.73%462167
Bernie Sanders 589,80348.33%45146
Martin O'Malley (withdrawn)4,7830.39%000
Rocky De La Fuente 1,5450.13%000
No preference8,0900.66%22
All others4,9270.40%000
Blank votes4,3260.35%
Total1,220,296100%9124115

Minnesota

Minnesota Democratic caucuses, March 1, 2016
CandidatePopular voteEstimated delegates
CountPercentagePledgedUnpledgedTotal
Bernie Sanders 126,22961.69%46147
Hillary Clinton 78,38138.31%311344
Uncommitted022
Total204,610100%771693
Source: The Green Papers

Oklahoma

Oklahoma Democratic primary, March 1, 2016
CandidatePopular voteEstimated delegates
CountPercentagePledgedUnpledgedTotal
Bernie Sanders 174,22851.88%21122
Hillary Clinton 139,44341.52%17118
Martin O'Malley (withdrawn)7,6722.28%
Keith Judd 4,3861.31%
Michael Steinberg 4,1711.24%
Star Locke (withdrawn)3,4581.03%
Rocky De La Fuente 2,4850.74%
Uncommitted022
Total335,843100%38442
Source: The Green Papers , Oklahoma State Election Board

Tennessee

Tennessee Democratic primary, March 1, 2016
CandidatePopular voteEstimated delegates
CountPercentagePledgedUnpledgedTotal
Hillary Clinton 245,93066.07%44751
Bernie Sanders 120,80032.45%23023
Martin O'Malley (withdrawn)2,0250.54%
Uncommitted3,4670.93%011
Total372,222100%67875
Source: The Green Papers

Texas

Texas Democratic primary, March 1, 2016
CandidatePopular voteEstimated delegates
CountPercentagePledgedUnpledgedTotal
Hillary Clinton 936,00465.19%14721168
Bernie Sanders 476,54733.19%75075
Rocky De La Fuente 8,4290.59%
Martin O'Malley (withdrawn)5,3640.37%
Willie Wilson 3,2540.23%
Keith Judd 2,5690.18%
Calvis L. Hawes2,0170.14%
Star Locke1,7110.12%
Uncommitted088
Total1,435,895100%22229251
Source: The Green Papers , Texas Secretary of State

Virginia

Virginia Democratic primary, March 1, 2016
CandidatePopular voteEstimated delegates
CountPercentagePledgedUnpledgedTotal
Hillary Clinton 504,74164.29%
62
13
75
Bernie Sanders 276,37035.20%
33
0
33
Martin O'Malley (withdrawn)3,9300.50%
Uncommitted
0
1
1
Total785,041100%9514109
Source: The Green Papers , Virginia Department of Elections

Vermont

Vermont Democratic primary, March 1, 2016
CandidatePopular voteEstimated delegates
CountPercentagePledgedUnpledgedTotal
Bernie Sanders 115,90085.69%16622
Hillary Clinton 18,33813.56%044
Martin O'Malley (withdrawn)2820.21%
Roque "Rocky" De La Fuente 800.06%
Total blank votes2600.19%
Total write-ins2380.18%
Total spoiled votes1580.12%
Uncommitted000
Total135,256100%161026
Source: The Green Papers , Vermont Secretary of State

Early March

Kansas

Kansas Democratic caucuses, March 5, 2016
CandidateDistrict delegatesEstimated delegates
CountPercentagePledgedUnpledgedTotal
Bernie Sanders 26,63767.90%23023
Hillary Clinton 12,59332.10%10414
Uncommitted000
Total39,230100%33437
Source: The Green Papers

Louisiana

Louisiana Democratic primary, March 5, 2016
CandidatePopular voteEstimated delegates
CountPercentagePledgedUnpledgedTotal
Hillary Clinton 221,73371.12%37744
Bernie Sanders 72,27623.18%14014
Steve Burke4,7851.53%
John Wolfe Jr. 4,5121.45%
Martin O'Malley (withdrawn)2,5500.82%
Willie Wilson 1,4230.46%
Keith Russell Judd 1,3570.44%
Rocky De La Fuente 1,3410.43%
Michael Steinberg 9930.32%
Henry Hewes 8060.26%
Uncommitted011
Total311,776100%51859
Source: The Green Papers , Louisiana Secretary of States

Nebraska

Democratic presidential caucuses

Nebraska Democratic caucuses, March 5, 2016
CandidatePopular voteEstimated delegates
CountPercentagePledgedUnpledgedTotal
Bernie Sanders 19,12057.14%15116
Hillary Clinton 14,34042.86%10313
Uncommitted011
Total33,460100%25530
Source: The Green Papers


Democratic presidential primary (non-binding)
The Nebraska Democratic primary was held on May 10, 2016. The primary does not bind delegates. Delegates were bound by the caucuses on March 5, 2016.

Nebraska Democratic primary, May 10, 2016
CandidatePopular voteEstimated delegates
CountPercentagePledgedUnpledgedTotal
Hillary Clinton 42,69253.08%
Bernie Sanders 37,74446.92%
Total80,436100%
Source: Nebraska Secretary of State Election - Official Primary Results

Maine

Maine Democratic caucuses, March 6, 2016
CandidateState convention delegatesEstimated delegates
CountPercentagePledgedUnpledgedTotal
Bernie Sanders 2,22664.17%17118
Hillary Clinton 1,23135.49%8412
Uncommitted120.35%000
Total3,469100%25530
Source: The Green Papers

Democrats Abroad

e    d   2016 Democratic Party's presidential nominating process for Democrats Abroad
– Summary of results –
CandidateVotesEstimated delegates
CountPercentagePledgedUnpledged × ½Total
Bernie Sanders 23,77968.79%91/29 1/2
Hillary Clinton 10,68930.92%42 1/26 1/2
Martin O'Malley (withdrawn)210.06%
Rocky De La Fuente 60.02%
Uncommitted011
Total100%13417
Source: The Green Papers

Michigan

Michigan Democratic primary, March 8, 2016
CandidatePopular voteEstimated delegates
CountPercentagePledgedUnpledgedTotal
Bernie Sanders 598,94349.68%67067
Hillary Clinton 581,77548.26%631073
Uncommitted21,6011.79%077
Martin O'Malley (withdrawn)2,3630.20%
Rocky De La Fuente 8700.07%
Total1,205,552100%13017147
Source: The Green Papers

Mississippi

Mississippi Democratic primary, March 8, 2016
CandidatePopular voteEstimated delegates
CountPercentagePledgedUnpledgedTotal
Hillary Clinton 187,33482.47%31334
Bernie Sanders 37,74816.62%527
Willie Wilson 9190.40%
Martin O'Malley (withdrawn)6720.30%
Rocky De La Fuente 4810.21%
Write-in100.00%
Total227,164100%36541
Source: The Green Papers , Mississippi Secretary of State

Northern Mariana Islands

Northern Marianas Democratic caucus, March 12, 2016
CandidatePopular voteEstimated delegates
CountPercentagePledgedUnpledgedTotal
Hillary Clinton 10253.97%415
Bernie Sanders 6534.39%202
Uncommitted2211.64%044
Total189100%6511
Source: The Green Papers

Late March

Florida

e    d   2016 Democratic Party's presidential nominating process in Florida
– Summary of results –
CandidatePopular voteEstimated delegates
CountPercentagePledgedUnpledgedTotal
Hillary Clinton 1,101,41464.44%14124165
Bernie Sanders 568,83933.28%73275
Martin O'Malley (withdrawn)38,9302.28%
Uncommitted066
Total1,709,183100%21432246
Source: The Green Papers , Florida Division of Elections - Official Primary Results

Illinois

Illinois Democratic primary, March 15, 2016
CandidatePopular voteEstimated delegates
CountPercentagePledgedUnpledgedTotal
Hillary Clinton 1,039,55550.56%7924103
Bernie Sanders 999,49448.61%77178
Willie Wilson 6,5650.32%
Martin O'Malley (withdrawn)6,1970.30%011
Lawrence "Larry Joe" Cohen2,4070.12%
Rocky De La Fuente 1,8020.09%
Others270.00%
Uncommitted011
Total2,056,047100%15627183
Source: The Green Papers , Illinois Board of Elections and
Illinois Democratic Party - Official Pledged Delegates Allocation

Missouri

Missouri Democratic primary, March 15, 2016
CandidatePopular voteEstimated delegates
CountPercentagePledgedUnpledgedTotal
Hillary Clinton 312,28549.61%361147
Bernie Sanders 310,71149.36%35237
Henry Hewes 6500.10%
Martin O'Malley (withdrawn)4420.07%
Jon Adams4330.07%
Rocky De La Fuente 3450.05%
Willie Wilson 3070.05%
Keith Russell Judd 2880.05%
John Wolfe Jr. 2470.04%
Uncommitted3,7170.59%000
Total629,425100%711384
Source: The Green Papers , Missouri Secretary of State - Official Primary Results

North Carolina

North Carolina Democratic primary, March 15, 2016
CandidatePopular voteEstimated delegates
CountPercentagePledgedUnpledgedTotal
Hillary Clinton 622,91554.50%60868
Bernie Sanders 467,01840.86%47249
Martin O'Malley (withdrawn)12,1221.06%
Rocky De La Fuente 3,3760.30%
No preference37,4853.28%
Uncommitted33
Total1,142,916100%10713120
Sources: The Green Papers , North Carolina State board of Elections ,
North Carolina Democratic Party - Official Delegation for Pledged Delegates

Ohio

Ohio Democratic primary, March 15, 2016
CandidatePopular voteEstimated delegates
CountPercentagePledgedUnpledgedTotal
Hillary Clinton 696,68156.12%811495
Bernie Sanders 535,39543.13%62163
Rocky De La Fuente 9,4020.76%
Uncommitted22
Total1,241,478100%14317160
Source: The Green Papers

Arizona

e    d   2016 Democratic Party's presidential nominating process in Arizona
– Summary of results –
CandidatePopular voteEstimated delegates
CountPercentagePledgedUnpledgedTotal
Hillary Clinton 262,45956.3%42648
Bernie Sanders 192,96241.4%33134
Martin O'Malley (withdrawn)3,8770.8%
Roque "Rocky" De La Fuente 2,7970.6%
Michael Steinberg 2,2950.5%
Henry Hewes 1,8450.4%
Uncommitted33
Total466,235100%751085
Source: The Green Papers, Arizona Secretary of State

Idaho

e    d   2016 Democratic Party's presidential nominating process in Idaho
– Summary of results –
CandidatePopular voteEstimated delegates
CountPercentagePledgedUnpledgedTotal
Bernie Sanders 18,64078.04%18220
Hillary Clinton 5,06521.21%516
Rocky De La Fuente 40.02%
Uncommitted1750.73%11
Total23,884100%23427
Source: The Green Papers
Idaho Democratic Party - Official Delegation for Pledged Delegates

Utah

Utah Democratic caucuses, March 22, 2016
CandidatePopular voteEstimated delegates
CountPercentagePledgedUnpledgedTotal
Bernie Sanders 62,99279.21%27229
Hillary Clinton 16,16620.33%628
Others340.04%
Uncommitted3340.42%000
Total79,526100%33437
Source: Utah Democratic Party

Alaska

e    d   2016 Democratic Party's presidential nominating process in Alaska
– Summary of results –
CandidatePopular voteDistrict delegatesEstimated delegates
CountPercentageCountPercentagePledgedUnpledgedTotal
Bernie Sanders 8,44779.61%44181.52%13114
Hillary Clinton 2,14620.23%10018.48%314
Rocky De La Fuente 1<0.01%
Uncommitted160.15%022
Total10,610100%541100%16420
Source: The Green Papers

Hawaii

e    d   2016 Democratic Party's presidential nominating process in Hawaii
– Summary of results –
CandidatePopular voteEstimated delegates
CountPercentagePledgedUnpledgedTotal
Bernie Sanders 23,53069.8%17219
Hillary Clinton 10,12530.0%8513
Rocky De La Fuente 120.0%
Martin O'Malley (withdrawn)60.0%
Uncommitted430.1%022
Total33,716100%25934
Source: The Green Papers

Washington

Washington Democratic caucuses, March 26, 2016
CandidateDistrict delegatesEstimated delegates
CountPercentagePledgedUnpledgedTotal
Bernie Sanders 19,15972.72%74074
Hillary Clinton 7,14027.10%271037
Others
Uncommitted460.18%077
Total26,345100%10117118
Source: The Green Papers

April

Wisconsin

Wisconsin Democratic primary, April 5, 2016
CandidatePopular voteEstimated delegates
CountPercentagePledgedUnpledgedTotal
Bernie Sanders 570,19256.59%48149
Hillary Clinton 433,73943.05%38947
Martin O'Malley (withdrawn)1,7320.17%
Roque "Rocky" De La Fuente (write-in)180.00%
Scattering4310.04%
Uncommitted1,4880.15%000
Total1,007,600100%861096
Source: The Green Papers , Wisconsin Secretary of State

Wyoming

Wyoming Democratic caucuses, April 9, 2016
CandidateCounty delegatesEstimated
national delegates
CountPercentagePledgedUnpledgedTotal
Bernie Sanders 15655.7%707
Hillary Clinton 12444.3%7411
Uncommitted
Total100%14418
Source: The Green Papers

New York

New York Democratic primary, April 19, 2016
CandidatePopular voteEstimated delegates
CountPercentagePledgedUnpledgedTotal
Hillary Clinton 1,133,98057.54%13941180
Bernie Sanders 820,05641.62%1080108
Void11,3060.57%
Blank votes5,3580.27%
Uncommitted033
Total1,970,900100%24744291
Source: Green Papers, New York State Board of Elections

Connecticut

e    d   2016 Democratic Party's presidential nominating process in Connecticut
– Summary of results –
CandidatePopular voteEstimated delegates
CountPercentagePledgedUnpledgedTotal
Hillary Clinton 170,04551.80%281543
Bernie Sanders 152,37946.42%27027
Roque "Rocky" De La Fuente 9600.29%000
Uncommitted4,8711.48%011
Total328,255100%551671
Source: The Green Papers , Connecticut Secretary of State - Official Primary Results

Delaware

e    d   2016 Democratic Party's presidential nominating process in Delaware
– Summary of results –
CandidatePopular voteEstimated delegates
CountPercentagePledgedUnpledgedTotal
Hillary Clinton 55,95459.75%121123
Bernie Sanders 36,66239.15%909
Roque De La Fuente 1,0241.09%
Uncommitted000
Total93,640100%211132
Source: The Green Papers , Delaware Department of Elections - Official Primary Results

Maryland

Maryland Democratic primary, April 26, 2016
CandidatePopular voteEstimated delegates
CountPercentagePledgedUnpledgedTotal
Hillary Clinton 573,24262.53%601777
Bernie Sanders 309,99033.81%35136
Rocky De La Fuente 3,5820.39%
Uncommitted29,9493.27%066
Total916,763100%9524119
Source: The Green Papers , Maryland State Board of Elections - Official Primary Results ,
MDP Announces DNC Delegates, Alternates and State DNC Members ,
MDP Announces District-Level Delegate Winners

Pennsylvania

Pennsylvania Democratic primary, April 26, 2016
CandidatePopular voteEstimated delegates
CountPercentagePledgedUnpledgedTotal
Hillary Clinton 935,10755.61%10620126
Bernie Sanders 731,88143.53%83083
Rocky De La Fuente 14,4390.86%000
Total1,681,427100%18920209
Source: The Green Papers , Pennsylvania State Elections Official Results

Rhode Island

Rhode Island Democratic primary, April 26, 2016
CandidatePopular voteEstimated delegates
CountPercentagePledgedUnpledgedTotal
Bernie Sanders 66,99354.71%13013
Hillary Clinton 52,74943.08%11920
Mark Stewart2360.19%000
Rocky De La Fuente 1450.12%000
Write-in6730.55%000
Uncommitted1,6621.36%000
Total122,458100%24933
Source: The Green Papers , Rhode Island Board of Elections and
Rhode Island Democratic Party - Official Pledged Delegates Allocation

May

Indiana

Indiana Democratic primary, May 3, 2016
CandidatePopular voteEstimated delegates
CountPercentagePledgedUnpledgedTotal
Bernie Sanders 335,07452.46%44044
Hillary Clinton 303,70547.54%39746
Uncommitted022
Total638,779100%83992
Source: The Green Papers - Official Primary Results

Guam

e    d   2016 Democratic Party's presidential nominating process in Guam
– Summary of results –
CandidatePopular voteEstimated delegates
CountPercentagePledgedUnpledgedTotal
Hillary Clinton 77759.5%459
Bernie Sanders 52840.5%303
Uncommitted000
Total1305100%7512
Source: The Green Papers

West Virginia

West Virginia Democratic primary, May 10, 2016
CandidatePopular voteDelegates
CountPercentagePledgedUnpledgedTotal
Bernie Sanders 124,70051.41%1818
Hillary Clinton 86,91435.84%11819
Paul T. Farrell Jr. 21,6948.94%
Keith Judd 4,4601.84%
Martin O'Malley (withdrawn)3,7961.57%
Rocky De La Fuente 9750.40%
Uncommitted000
Total242,539100%29837
Source: The Green Papers , West Virginia Secretary of State

Kentucky

Kentucky Democratic primary, May 17, 2016
CandidatePopular voteEstimated delegates
CountPercentagePledgedUnpledgedTotal
Hillary Clinton 212,53446.76%28230
Bernie Sanders 210,62346.33%27027
Martin O'Malley (withdrawn)5,7131.26%
Roque "Rocky" De La Fuente 1,5940.35%
Uncommitted24,1045.30%033
Total454,568100%55560
Source: The Green Papers , Kentucky Secretary of State

Oregon

Oregon Democratic primary, May 17, 2016
CandidatePopular voteEstimated delegates
CountPercentagePledgedUnpledgedTotal
Bernie Sanders 360,82956.24%36339
Hillary Clinton 269,84642.06%25732
Misc.10,9201.70%000
(available)033
Total641,595100%611374
Source: The Green Papers , Oregon Secretary of State - Official Election Results

June

Virgin Islands

U.S. Virgin Islands Democratic caucuses, June 4, 2016
CandidatePopular voteEstimated delegates
CountPercentagePledgedUnpledgedTotal
Hillary Clinton 1,32687.12%7512
Bernie Sanders 19612.88%000
Uncommitted000
Total1,514100%7512
Source: The Associated Press , The Green Papers

Puerto Rico

Puerto Rico Democratic caucuses, June 5, 2016
CandidatePopular voteEstimated delegates
CountPercentagePledgedUnpledgedTotal
Hillary Clinton 52,65859.74%36742
Bernie Sanders 33,36837.85%24024
Rocky De La Fuente 3000.35%
Total88,149100%60767
Source: The Green Papers

California

e    d   2016 Democratic Party's presidential nominating process in California
– Summary of results –
CandidatePopular voteEstimated delegates
CountPercentagePledgedUnpledgedTotal
Hillary Clinton 2,745,30253.07%25466320
Bernie Sanders 2,381,72246.04%2210221
Willie Wilson 12,0140.23%
Michael Steinberg10,8800.21%
Rocky De La Fuente 8,4530.16%
Henry Hewes 7,7430.15%
Keith Judd 7,2010.14%
Write-in230.00%
Uncommitted1010
Total5,173,338100%47576551
Source: California Secretary of State - Presidential Primary Election Statement of Votes The Green Papers

Montana

Montana Democratic primary, June 7, 2016
CandidatePopular voteEstimated delegates
CountPercentagePledgedUnpledgedTotal
Bernie Sanders 65,15651.56%11112
Hillary Clinton 55,80544.16%10515
No preference5,4154.28%000
Uncommitted000
Total126,376100%21627
Source: The Green Papers , Montana Secretary of State - Official Primary Results

New Jersey

New Jersey Democratic primary, June 7, 2016
CandidatePopular voteEstimated delegates
CountPercentagePledgedUnpledgedTotal
Hillary Clinton 566,24763.32%791291
Bernie Sanders 328,05836.68%47249
Uncommitted000
Total894,305100%12616142
Source: The Green Papers , New Jersey Democratic Primary Official Results - New Jersey Department of State

New Mexico

New Mexico Democratic primary, June 7, 2016
CandidatePopular voteEstimated delegates
CountPercentagePledgedUnpledgedTotal
Hillary Clinton 111,33451.53%18927
Bernie Sanders 104,74148.47%16016
Uncommitted000
Total216,075100%34943
Source: The Green Papers , New Mexico State Board of Elections,
New Mexico Democratic Delegates Allocation

North Dakota

North Dakota Democratic caucuses, June 7, 2016
CandidateDistrict delegatesState delegates
CountPercentagePledgedUnpledgedTotal
Bernie Sanders 25364.21%13114
Hillary Clinton 10125.63%516
Uncommitted4010.15%000
Total394100%18523
Source: The Green Papers

South Dakota

South Dakota Democratic primary, June 7, 2016
CandidatePopular voteEstimated delegates
CountPercentagePledgedUnpledgedTotal
Hillary Clinton 27,04751.03%10212
Bernie Sanders 25,95948.97%10010
Uncommitted033
Total53,006100%20525
Source: The Green Papers , South Dakota Secretary of State - Official Primary Results

District of Columbia

e    d   2016 Democratic Party's presidential nominating process in the District of Columbia
– Summary of results –
CandidatePopular voteEstimated delegates
CountPercentagePledgedUnpledgedTotal
Hillary Clinton 76,70477.95%162339
Bernie Sanders 20,36120.69%426
Roque "Rocky" De La Fuente 2130.22%
Under votes6110.62%
Write-in4850.49%
Over votes240.02%
Uncommitted000
Total98,398100%202545
Source: The Green Papers , District of Columbia Board of Elections – Official Primary Results

See also

Notes

  1. Differences between types:
    • Open: Anyone can participate regardless of their registered party affiliation.
    • Semi-open: Anyone can participate except registered Republicans.
    • Semi-closed: Only registered Democrats or undeclared can participate.
    • Closed: Only registered Democrats can participate.
  2. Differences between types:
    • CD: 'Popular vote' tallies the county delegates.
    • LDD: 'Popular vote' tallies the legislative district delegates.
    • SCD: 'Popular vote' tallies the state convention delegates.
    • SDE: 'Popular vote' tallies the state delegate equivalents.
  3. Pledged delegates are elected with the understanding that they will support a specific candidate.
    Unpledged delegates (superdelegates) are not required to voice support for a specific candidate.
  4. 1 2 3 4 5 One Illinois superdelegate is still committed to O'Malley. Therefore, the total number of available delegates is one less than expected.
  5. There are 8 unpledged delegates from Democrats Abroad that each cast half a vote at the national convention.
  6. Open to all voters excluding those who caucused with the Republicans on February 20.
  7. Open to all voters, though those who attend must state they will identify as a Democrat for the 2016 election.
  8. 1 2 Does not include popular vote totals from Iowa, Maine, Nevada, North Dakota, Washington, Wyoming, or non-binding primaries
  9. The write-ins include 3,248 votes for these 11 Republican presidential candidates: Trump (1795), Kasich (438), Jeb Bush (263), Christie (216), Marco Rubio (203), Ted Cruz (162), Fiorina (99), Carson (52), Paul (12), Gilmore (6), Huckabee (2). [92]

Related Research Articles

<span class="mw-page-title-main">Results of the 2008 Republican Party presidential primaries</span> U.S. election results

This article contains the results of the 2008 Republican presidential primaries and caucuses.

<span class="mw-page-title-main">2008 Wyoming Democratic presidential caucuses</span>

The 2008 Wyoming Democratic presidential caucuses were a series of events designed to determine the delegates that the Wyoming Democratic Party sent to the 2008 Democratic National Convention. The party was allocated seven pledged delegates to presidential candidates on March 8 during the Wyoming Democratic County Caucuses. The remaining five pledged delegates were allocated on May 24 during the Wyoming Democratic State Convention. There were six Wyoming superdelegates, so the whole delegation was composed of 18 delegates.

<span class="mw-page-title-main">2008 South Dakota Democratic presidential primary</span>

The 2008 South Dakota Democratic presidential primary took place on June 3, 2008. Along with Montana, it was one of the final two elections in the 2008 primary season. Senator Hillary Clinton won the primary, but on the same day, her opponent Barack Obama secured enough delegate votes for the 2008 Democratic National Convention to ensure his eventual nomination for President by the Democratic Party.

<span class="mw-page-title-main">2012 Democratic Party presidential primaries</span> Selection of the Democratic Party nominee

From January 3 to June 5, 2012, voters of the Democratic Party chose its nominee for president in the 2012 United States presidential election. President Barack Obama won the Democratic Party nomination by securing more than the required 2,383 delegates on April 3, 2012, after a series of primary elections and caucuses. He was formally nominated by the 2012 Democratic National Convention on September 5, 2012, in Charlotte, North Carolina.

<span class="mw-page-title-main">Results of the 2012 Republican Party presidential primaries</span>

This article contains the results of the 2012 Republican presidential primaries and caucuses, which resulted in the nomination of Mitt Romney as the Republican nominee for President of the United States. The 2012 Republican primaries were the selection processes by which the Republican Party selected delegates to attend the 2012 Republican National Convention from August 27–30. The series of primaries, caucuses, and state conventions culminated in the national convention, where the delegates cast their votes to formally select a candidate. A simple majority (1,144) of the total delegate votes (2,286) was required to become the party's nominee.

<span class="mw-page-title-main">2012 United States presidential election in Michigan</span> Election in Michigan

The 2012 United States presidential election in Michigan took place on November 6, 2012, as part of the 2012 United States presidential election in which all 50 states plus the District of Columbia participated. Voters chose 16 electors to represent them in the Electoral College via a popular vote pitting incumbent Democratic President Barack Obama and his running mate, Vice President Joe Biden, against Republican challenger and former Massachusetts Governor Mitt Romney and his running mate, Congressman Paul Ryan.

<span class="mw-page-title-main">2012 United States presidential election in California</span>

The 2012 United States presidential election in California took place on November 6, 2012, as part of the 2012 United States presidential election in which all 50 states plus the District of Columbia participated. California voters chose 55 electors, the most out of any state, to represent them in the Electoral College via a popular vote pitting incumbent Democratic President Barack Obama and his running mate, Vice President Joe Biden, against Republican challenger and former Massachusetts Governor Mitt Romney and his running mate, Congressman Paul Ryan.

<span class="mw-page-title-main">2012 United States presidential election in Louisiana</span> Election in Louisiana

The 2012 United States presidential election in Louisiana took place on November 6, 2012, as part of the 2012 United States presidential election in which all 50 states plus the District of Columbia participated. Louisiana voters chose eight electors to represent them in the Electoral College via a popular vote pitting incumbent Democratic President Barack Obama and his running mate, Vice President Joe Biden, against Republican challenger and former Massachusetts Governor Mitt Romney and his running mate, Congressman Paul Ryan.

<span class="mw-page-title-main">2012 United States presidential election in Massachusetts</span> Election in Massachusetts

The 2012 United States presidential election in Massachusetts took place on November 6, 2012, as part of the 2012 United States presidential election in which all 50 states plus the District of Columbia participated. Massachusetts voters chose 11 electors to represent them in the Electoral College via a popular vote pitting incumbent Democratic President Barack Obama and his running mate, Vice President Joe Biden, against Republican challenger and former Massachusetts Governor Mitt Romney and his running mate, Congressman Paul Ryan.

<span class="mw-page-title-main">2012 United States presidential election in Mississippi</span> Election in Mississippi

The 2012 United States presidential election in Mississippi took place on November 6, 2012, as part of the 2012 general election in which all 50 states plus the District of Columbia participated. Mississippi voters chose six electors to represent them in the Electoral College via a popular vote pitting incumbent Democratic President Barack Obama and his running mate, Vice President Joe Biden, against Republican challenger and former Massachusetts Governor Mitt Romney and his running mate, Congressman Paul Ryan.

<span class="mw-page-title-main">2012 United States presidential election in Alabama</span> Election in Alabama

The 2012 United States presidential election in Alabama took place on November 6, 2012, as part of the 2012 general election, in which all 50 states plus the District of Columbia participated. Alabama voters chose nine electors to represent them in the Electoral College via a popular vote pitting incumbent Democratic President Barack Obama and his running mate, Vice President Joe Biden, against Republican challenger and former Massachusetts Governor Mitt Romney and his running mate, Congressman Paul Ryan.

<span class="mw-page-title-main">2012 United States presidential election in Alaska</span> Election in Alaska

The 2012 United States presidential election in Alaska took place on November 6, 2012, as part of the 2012 United States presidential election in which all 50 states plus the District of Columbia participated. Alaska voters chose three electors to represent them in the Electoral College via a popular vote pitting incumbent Democratic President Barack Obama and his running mate, Vice President Joe Biden, against Republican challenger and former Massachusetts Governor Mitt Romney and his running mate, Congressman Paul Ryan.

<span class="mw-page-title-main">2016 Democratic Party presidential primaries</span> Selection of the Democratic Party nominee

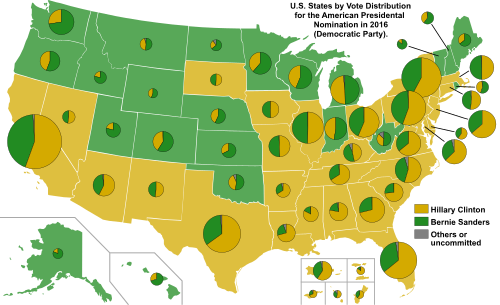
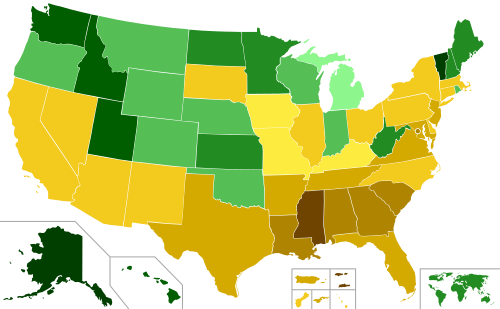
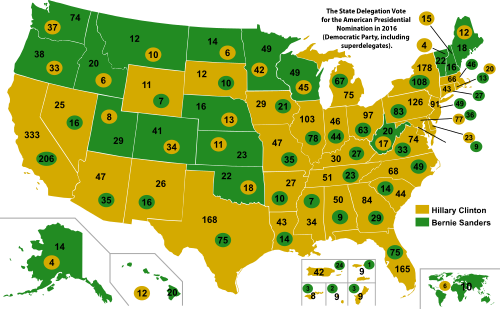
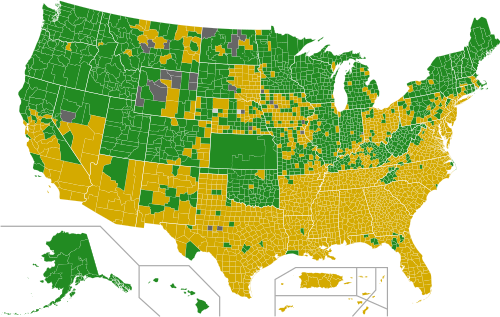
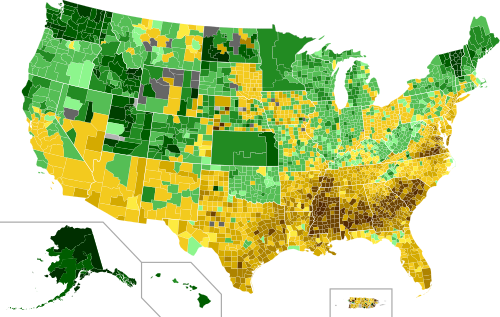
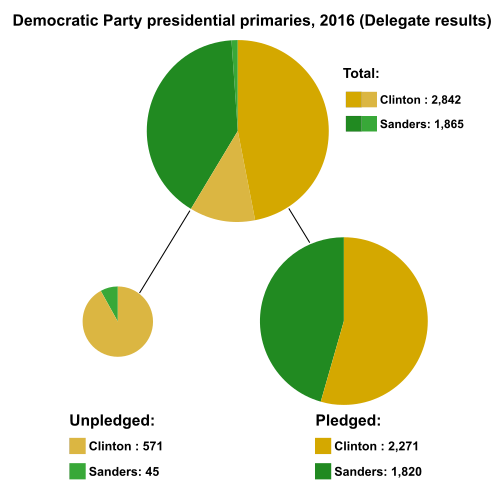
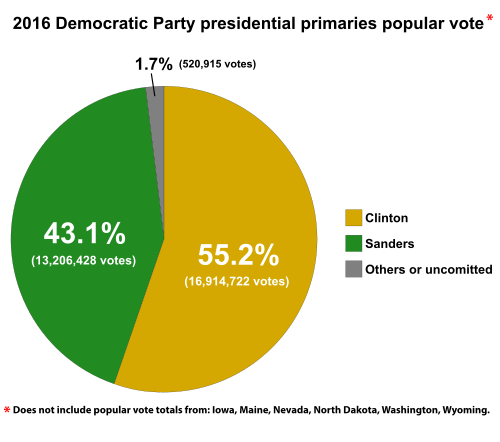
Presidential primaries and caucuses were organized by the Democratic Party to select the 4,051 delegates to the 2016 Democratic National Convention held July 25–28 and determine the nominee for president in the 2016 United States presidential election. The elections took place within all fifty U.S. states, the District of Columbia, five U.S. territories, and Democrats Abroad and occurred between February 1 and June 14, 2016.

<span class="mw-page-title-main">Results of the 2016 Republican Party presidential primaries</span>

This article contains the results of the 2016 Republican presidential primaries and caucuses, the processes by which the Republican Party selected delegates to attend the 2016 Republican National Convention from July 18–21. The series of primaries, caucuses, and state conventions culminated in the national convention, where the delegates cast their votes to formally select a candidate. A simple majority (1,237) of the total delegate votes (2,472) was required to become the party's nominee and was achieved by the nominee, businessman Donald Trump of New York.

<span class="mw-page-title-main">2016 United States presidential election in New Hampshire</span> Election in New Hampshire

The 2016 United States presidential election in New Hampshire was held on Tuesday, November 8, 2016, as part of the 2016 United States presidential election in which all 50 states plus the District of Columbia participated. New Hampshire voters chose electors to represent them in the Electoral College via a popular vote, pitting the Republican Party's nominee, businessman Donald Trump, and running mate Indiana Governor Mike Pence against Democratic Party nominee, former Secretary of State Hillary Clinton, and her running mate Virginia Senator Tim Kaine. New Hampshire has four electoral votes in the Electoral College.

<span class="mw-page-title-main">2016 United States presidential election in Virginia</span> Election in Virginia

The 2016 United States presidential election in Virginia was held on November 8, 2016, as part of the 2016 general election in which all 50 states plus the District of Columbia participated. Virginia voters chose electors to represent them in the Electoral College via a popular vote pitting the Republican Party's nominee, businessman Donald Trump, and running mate Indiana Governor Mike Pence against Democratic Party nominee, former Secretary of State Hillary Clinton and her running mate, Virginia Senator Tim Kaine.

<span class="mw-page-title-main">Rocky De La Fuente 2016 presidential campaign</span> Third-party campaign for President of the United States

Rocky De La Fuente ran a third-party campaign for the presidency of the United States in the 2016 election. De La Fuente had sought the Democratic Party's nomination during their presidential primaries. De La Fuente did not win any delegates to the 2016 Democratic National Convention, but he came in fourth by total votes received. De La Fuente founded the American Delta Party and ran as its presidential nominee with running mate Michael Steinberg. He was also the presidential nominee of the Reform Party, which had ballot access in Florida, Louisiana, and Mississippi. He received 33,136 votes in the general election, placing him eighth in the popular vote.

<span class="mw-page-title-main">2020 Massachusetts Democratic presidential primary</span>

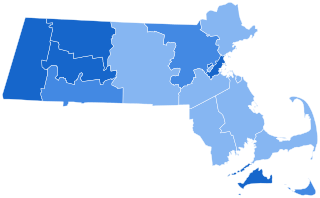
The 2020 Massachusetts Democratic presidential primary took place on March 3, as one of 15 contests scheduled on Super Tuesday in the Democratic Party primaries for the 2020 presidential election, following the South Carolina primary the weekend before. The Massachusetts primary was a semi-closed primary, with the state awarding 114 delegates towards the 2020 Democratic National Convention, of which 91 were pledged delegates allocated on the basis of the results of the primary.

<span class="mw-page-title-main">Results of the 2020 Republican Party presidential primaries</span> Selection of the Republican Party nominee for President of the United States in 2020

Below is a detailed tally of the results of the 2020 Republican Party presidential primary elections in the United States. In most U.S. states outside New Hampshire, votes for write-in candidates remain untallied.

This article contains the results of the 2020 Democratic Party presidential primaries and caucuses, the processes by which the Democratic Party selected delegates to attend the 2020 Democratic National Convention from August 17–20, 2020. The series of primaries, caucuses, and state conventions culminated in the national convention, where the delegates cast their votes to formally select a candidate. A simple majority (1,990) of the total delegate votes (3,979) was required to become the nominee.

References

  1. Kamisar, Ben (June 8, 2016). "DNC avoids calling Clinton presumptive nominee". The Hill . Retrieved June 8, 2016.
  2. Dann, Carrie (July 26, 2016). "Hillary Clinton Becomes First Female Nominee of Major U.S. Political Party". NBC News. NBC. Retrieved July 27, 2016.
  3. Andrews, Wilson; Bennett, Kitty; Parlapiano, Alicia (April 14, 2015). "2016 Delegate Count and Primary Results (Published 2015)". The New York Times. Archived from the original on July 25, 2023.
  4. "Iowa Caucus Results". The New York Times . Retrieved March 28, 2016.
  5. "New Hampshire Democratic Primary Results". William M. Gardner, New Hampshire Secretary of State. Retrieved April 1, 2016.
  6. "Nevada Caucus Results". The New York Times. Retrieved May 15, 2016.
  7. "South Carolina Democratic Primary Official Results". South Carolina State Election Commission. Retrieved April 1, 2016.
  8. "Alabama Democratic Party certified Election Results" (PDF). Secretary of State of Alabama. Retrieved April 1, 2016.
  9. Berg-Andersson, Richard E. "American Samoa Democratic Delegation 2016". The Green Papers. Retrieved March 30, 2016.
  10. "Arkansas Official County results (provisional)". Arkansas Secretary of State. Retrieved April 1, 2016.
  11. Berg-Andersson, Richard E. (April 15, 2016). "Colorado Democratic Delegation 2016". The Green Papers. Retrieved April 19, 2016.
  12. "Georgia Primary Results". The New York Times. Retrieved March 28, 2016.
  13. "Massachusetts Primary Results". The New York Times. Retrieved March 28, 2016.
  14. "Massachusetts Democratic Delegation 2016". thegreenpapers.com. Retrieved June 13, 2016.
  15. "Minnesota Caucus Results". The New York Times. Retrieved March 28, 2016.
  16. "Oklahoma State Election Board - 2016 March PPP Election". ok.gov. Retrieved June 17, 2016.
  17. "Oklahoma Primary Results". The New York Times. Retrieved March 28, 2016.
  18. "Tennessee Primary Results". The New York Times. Retrieved March 28, 2016.
  19. "Texas Primary Results". The New York Times. Retrieved March 28, 2016.
  20. Vermont Secretary of State
  21. "Vermont Primary Results". The New York Times. Retrieved March 28, 2016.
  22. "Virginia Primary Results". The New York Times. Retrieved March 28, 2016.
  23. "Kansas Caucus Results". The New York Times. Retrieved March 28, 2016.
  24. "Louisiana Primary Results". The New York Times. Retrieved March 28, 2016.
  25. "Nebraska Caucus Results". The New York Times. Retrieved March 28, 2016.
  26. "Maine Caucus Results". The New York Times. Retrieved March 28, 2016.
  27. Berg-Andersson, Richard E. "Democrats Abroad Democratic Delegation 2016". The Green Papers. Retrieved March 30, 2016.
  28. Berg-Andersson, Richard E. "Michigan Democratic Delegation 2016". The Green Papers. Retrieved March 30, 2016. (Projection computed by The Green Papers until full official results are published.)
  29. Johnson, Ruth. "2016 Michigan Election results". Michigan Department of State. Retrieved April 1, 2016.
  30. "Mississippi Primary Results". Mississippi Secretary of State. Retrieved June 16, 2016.
  31. Berg-Andersson, Richard E. "Northern Marianas Democratic Delegation 2016". The Green Papers. Retrieved March 30, 2016.
  32. Berg-Andersson, Richard E. "Florida Democratic Delegation 2016". The Green Papers. Retrieved March 30, 2016. (Projection computed by The Green Papers until full official results are published.)
  33. "2016 Presidential Preference Primary - Official Election Results". Florida Department of State Division of elections. Retrieved March 31, 2016.
  34. Berg-Andersson, Richard E. "Illinois Democratic Delegation 2016". The Green Papers. Retrieved March 30, 2016. (Projection computed by The Green Papers until full official results are published.)
  35. Berg-Andersson, Richard E. "Missouri Democratic Delegation 2016". The Green Papers. Retrieved March 30, 2016. (Projection computed by The Green Papers until full official results are published.)
  36. Berg-Andersson, Richard E. "North Carolina Democratic Delegation 2016". The Green Papers. Retrieved March 30, 2016. (Projection computed by The Green Papers until full official results are published.)
  37. "Ohio Primary Results". The New York Times. Retrieved March 28, 2016.
  38. "Ohio Democratic Delegation 2016". thegreenpapers.com. Retrieved April 23, 2016.
  39. "State of Arizona Official Canvass - 2016 Presidential Preference Election - March 22, 2016" (PDF). Arizona Secretary of State. April 4, 2016. Retrieved April 6, 2016.
  40. Berg-Andersson, Richard E. "Arizona Democratic Delegation 2016". The Green Papers. Retrieved March 30, 2016.
  41. Berg-Andersson, Richard E. "Idaho Democratic Delegation 2016". The Green Papers. Retrieved March 30, 2016. (Projection computed by The Green Papers until full official results are published.)
  42. Berg-Andersson, Richard E. "Utah Democratic Delegation 2016". The Green Papers. Retrieved March 30, 2016. (Projection computed by The Green Papers until full official results are published.)
  43. "Alaska Caucus Results". The New York Times. Retrieved March 28, 2016.
  44. "Alaska Democratic Delegation 2016". thegreenpapers.com. Retrieved April 23, 2016.
  45. "Hawaii Caucus Results". The New York Times. Retrieved March 28, 2016.
  46. Berg-Andersson, Richard E. "Washington Democratic Delegation 2016". The Green Papers. Retrieved March 30, 2016. (Projection computed by The Green Papers until full official results are published.)
  47. Wisconsin Official Results
  48. Berg-Andersson, Richard E. "Wisconsin Democratic Delegation 2016". The Green Papers. Retrieved April 6, 2016. (Projection computed by The Green Papers until full official results are published.)
  49. Berg-Andersson, Richard E. "Wyoming Democratic Delegation 2016". The Green Papers. Retrieved April 25, 2016. (Projection computed by The Green Papers until full official results are published.)
  50. New York State Board of Elections
  51. "New York Primary Results". The New York Times. Retrieved April 17, 2016.
  52. "New York Democratic Delegation 2016". thegreenpapers.com. Retrieved April 23, 2016.
  53. Connecticut Secretary of State - Official Primary Results
  54. "Connecticut Democratic Delegation 2016". thegreenpapers.com. Retrieved April 27, 2016.
  55. "State of Delaware - Office of the State Election Commissioner". delaware.gov. Retrieved June 18, 2016.
  56. "Delaware Primary Results". The New York Times. Retrieved April 26, 2016.
  57. "Maryland Official Primary Results". Maryland State Board of Elections. Retrieved June 15, 2016.
  58. "Maryland Democratic Delegation 2016". thegreenpapers.com. Retrieved April 27, 2016.
  59. "Pennsylvania Democratic Delegation 2016". thegreenpapers.com. Retrieved April 27, 2016.
  60. "Rhode Island Primary Results". The New York Times. Retrieved April 26, 2016.
  61. "RI.gov: Election Results". ri.gov. Retrieved May 6, 2016.
  62. "Indiana Democratic Delegation 2016 - Official Primary Results". thegreenpapers.com. Retrieved May 4, 2016.
  63. "Guam Democratic Delegation". thegreenpapers.com. Retrieved May 7, 2016.
  64. "Election Results". Nebraska Secretary of State. Retrieved May 10, 2016.
  65. "West Virginia Democratic Delegation 2016". thegreenpapers.com. Retrieved May 12, 2016.
  66. Kentucky Secretary of State - Official Primary Results
  67. "Kentucky Democratic Delegation 2016". thegreenpapers.com. Retrieved May 17, 2016.
  68. Oregon Secretary of State - Official Election Results
  69. "Oregon Democratic Delegation 2016". thegreenpapers.com. Retrieved May 20, 2016.
  70. "Presidential Primary Results". wa.gov. May 24, 2016. Retrieved May 28, 2016.
  71. "2016 Presidential Primary". wa.gov. Retrieved May 12, 2016.
  72. "Clinton moves closer to nomination, sweeps in Virgin Islands" . Retrieved June 5, 2016.
  73. "Delegate Tracker". Associated Press. June 6, 2016. Retrieved June 6, 2016.
  74. "Virgin Islands Democratic Delegation 2016". thegreenpapers.com. Retrieved July 17, 2016.
  75. "Puerto Rico Democratic Delegation 2016". thegreenpapers.com. Retrieved April 19, 2016.
  76. "California Democratic Primary - Official Election Results" (PDF). ca.gov. Retrieved July 25, 2016.
  77. "California Democratic Delegation 2016". thegreenpapers.com. Retrieved June 29, 2016.
  78. Montana Secretary of State - Official Primary Results
  79. "Montana Democratic Delegation 2016". thegreenpapers.com. Retrieved June 13, 2016.
  80. New Jersey Democratic Primary Official Results - New Jersey Department of State
  81. "New Jersey Democratic Primary Results" (PDF). New Jersey State Elections. June 7, 2016. Retrieved June 15, 2016.
  82. "New Jersey Democrat". The Green Papers. June 7, 2016. Retrieved June 7, 2016.
  83. New Mexico State Board of Elections - Official Primary Results
  84. "New Mexico Democratic Delegation 2016". thegreenpapers.com. Retrieved June 13, 2016.
  85. "North Dakota Democrat". The Green Papers. June 7, 2016. Retrieved June 7, 2016.
  86. "North Dakota Democratic-NPL Caucus Guide 2016" . Retrieved May 29, 2016.[ dead link ]
  87. South Dakota Secretary of State - Official Primary Results
  88. "South Dakota Democratic Delegation 2016". thegreenpapers.com. Retrieved June 13, 2016.
  89. "Upcoming Elections: South Dakota Secretary of State, Shantel Krebs". sdsos.gov. Retrieved April 19, 2016.
  90. District of Columbia Board of Elections - Official Primary Results
  91. "District of Columbia Democratic Delegation 2016". thegreenpapers.com. Retrieved June 14, 2016.
  92. "2016 Presidential Primary - Democratic President: Summary Democratic Write-ins". New Hampshire Secretary of State . Archived from the original on February 14, 2020. Retrieved February 14, 2020.
  93. "2016 Presidential Primaries, Caucuses, and Conventions: New Hampshire Democrat Presidential Nominating Process". The Green Papers. December 5, 2019. Archived from the original on February 18, 2018. Retrieved February 10, 2016.
  94. "2016 Presidential Primary - Democratic President: Summary Democratic 16PP". New Hampshire Secretary of State . February 2016. Archived from the original on February 14, 2020. Retrieved February 14, 2020.
  95. "2016 President Democratic Primary" . Retrieved March 15, 2016.
  96. The Green Papers