Despite the country at-large swinging to the right, Arizona's Republican margin of victory decreased from 9.0% in 2012[2] to only 3.5% in 2016, thus making it one of 11 states (along with the District of Columbia) to swing toward the Democratic Party in this election.
As of 2024, Trump's 2016 margin of victory in Arizona remains the smallest for any Republican who won the presidency since Arizona's statehood in 1912. This was the last time Arizona voted to the right of Florida.
Notably, Maricopa County, the state's most populous county, went more Democratic than the state as a whole for the first time in state history; it has done so in every election since. The county had not voted for a Democrat since Harry S. Truman in 1948. Maricopa County and Arizona as a whole both voted Democratic in 2020 and then flipped back to the Republican presidential column in 2024.
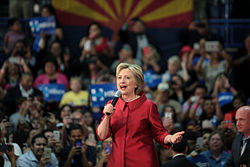
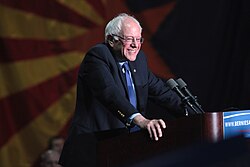
Former Secretary of State Hillary Clinton at a campaign rally at Carl Hayden High School in Phoenix on March 21, 2016.Senator Bernie Sanders at a campaign rally at the Phoenix Convention Center in Phoenix on March 15, 2016.Former President Bill Clinton at a campaign rally for his wife at Central High School in Phoenix on March 20, 2016.
Six candidates appeared on the Democratic presidential primary ballot:[3]
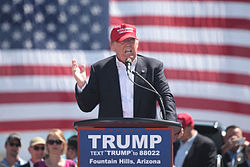
Businessman Donald Trump at a campaign rally at Fountain Park in Fountain Hills on March 19, 2016.Senator Ted Cruz at a campaign rally at Arizona Christian University in Phoenix on March 18, 2016.
Fourteen candidates appeared on the Republican presidential primary ballot:[8]
Green Party candidate Jill Stein at a campaign rally at the Mesa Public Library in Mesa on March 12, 2016.
The Arizona Green Party held its primary on March 22. Jill Stein won with 82% of the vote, and the overall number of voters that took place in the primary saw an increase from 561 in 2012 to 770 in 2016.[9] Only two candidates qualified for the primary:[10]
Arizona Green Party presidential primary, March 22, 2016[11]
The first poll conducted in March 2016 showed a tie between Clinton and Trump. From March 2016 to October, the polling in this normally Republican state was quite close, with neither candidate seriously leading. In late October, Trump gained momentum and won every pre-election poll in the weeks leading up to the election. The final poll showed Trump leading Clinton 46% to 41% and the average of the final 3 polls showed Trump leading 47% to 43%, which was accurate compared to the results.[12]
Predictions
The following are final 2016 predictions from various organizations for Arizona as of Election Day.
Trump won five of nine congressional districts, with the remaining four going to Clinton. Each candidate won a district that elected a representative of the other party.[23]
Voter Turnout was 74.2% with 2,661,497 ballots cast out of 3,588,466 voters.[24]
Analysis
Donald Trump won Arizona with a margin of 3.5%, a reduced margin from Mitt Romney's 9.0% margin in 2012.[25] Arizona was among the eleven states in which Hillary Clinton outperformed Barack Obama's margin in 2012,[26] primarily due to an increase in Hispanic voter turnout in southern Arizona, including heavily populated Maricopa County. This was the weakest performance for a Republican in the state since 1992. Trump also lost the 2nd congressional district that Romney had won four years earlier.
Maricopa County, in particular, went from a 10.7% margin of victory for Romney in 2012 to a 2.8% margin of victory for Trump, making this the first time since 1996 that the county was held to single digits. Clinton also came the closest of any Democrat to winning Yuma County since La Paz County broke off from it in the 1980s, as the county was last carried by a Democrat in 1964. Other rural counties that Bill Clinton had won in the 1990s continued to trend in a Republican direction, namely the formerly union-heavy Gila, Graham, and Greenlee counties. In terms of percentage of the vote, Trump's strongest support was in the northwest of the state, including Mohave County, which was the only county to give him over 70% of the vote. Clinton did best in the southern-central region along the US-Mexico border. Santa Cruz and Pima counties (home to Tucson) were among her strongest and among the places in the state where she outperformed Barack Obama in 2012.
Electors
Arizona had 11 electors in 2016. All of them voted for Donald Trump for president and Mike Pence for vice president.
This page is based on this Wikipedia article Text is available under the CC BY-SA 4.0 license; additional terms may apply. Images, videos and audio are available under their respective licenses.