| ||||||||||||||||||||||||||||||||||
All 110 seats in the Michigan House of Representatives 56 seats needed for a majority | ||||||||||||||||||||||||||||||||||
---|---|---|---|---|---|---|---|---|---|---|---|---|---|---|---|---|---|---|---|---|---|---|---|---|---|---|---|---|---|---|---|---|---|---|
Registered | 7,514,055 [1] | |||||||||||||||||||||||||||||||||
Turnout | 63.00% [lower-alpha 1] [1] | |||||||||||||||||||||||||||||||||
| ||||||||||||||||||||||||||||||||||
Democratic gain Republican gain Democratic hold Republican hold Republican: 40–50% 50–60% 60–70% 70–80% Democratic: 50–60% 60–70% 70–80% 80–90% >90% | ||||||||||||||||||||||||||||||||||
|
Elections in Michigan |
---|
An election was held on November 8, 2016 to elect all 110 members to Michigan's House of Representatives. The election coincided with elections for other offices, including U.S. President, U.S. House of Representatives and Senate. The primary election was held on August 2, 2016.
There was no change in the composition of the House as Republicans retained control, winning 63 seats compared to 47 seats for the Democrats. [2] [3]
Members elected at the 2016 election served in the 99th Michigan Legislature which convened on January 11, 2017.
Over one-third of the House could not seek re-election because of term-limits, with the legislators who were elected in the 2010 mid-term elections, that saw the House Republican conference pick up 21 seats, the largest net gain for one party in an election since Michigan's newly constituted term-limits went into effect in 1992. [4] [5]
Under the Michigan Constitution, members of the state Senate are able to serve only two four-years terms, and members of the House of Representatives are limited to three two-years terms. The following members were prevented by term-limits from seeking re-election to the House in 2016.
Statewide results of the 2016 Michigan House of Representatives: [6]
Party | Candi- dates | Votes | Seats | ||||
---|---|---|---|---|---|---|---|
No. | % | No. | +/– | % | |||
Republican Party | 110 | 2,263,633 | 49.20% | 63 | 57.27% | ||
Democratic Party | 110 | 2,260,633 | 49.13% | 47 | 42.73% | ||
Libertarian Party | 26 | 53,846 | 1.17% | 0 | 0.00% | ||
Green Party | 8 | 11,777 | 0.26% | 0 | 0.00% | ||
US Taxpayers Party | 6 | 7,720 | 0.17% | 0 | 0.00% | ||
Independent | 1 | 3,643 | 0.08% | 0 | 0.00% | ||
Write-in | 5 | 37 | 0.00% | 0 | 0.00% | ||
Total | 266 | 4,601,289 | 100.00% | 110 | 100.00% |
Results of the 2016 Michigan House of Representatives election by district: [6]
District | Democratic | Republican | Others | Total | Result | ||||
---|---|---|---|---|---|---|---|---|---|
Votes | % | Votes | % | Votes | % | Votes | % | ||
District 1 | 24,947 | 68.34% | 11,558 | 31.66% | - | - | 36,505 | 100.00% | Democratic Hold |
District 2 | 25,409 | 71.83% | 9,962 | 28.16% | 3 | 0.01% | 35,374 | 100.00% | Democratic Hold |
District 3 | 28,766 | 96.79% | 955 | 3.21% | - | - | 29,721 | 100.00% | Democratic Hold |
District 4 | 24,790 | 91.87% | 1,397 | 5.18% | 796 | 2.95% | 26,983 | 100.00% | Democratic Hold |
District 5 | 17,832 | 92.51% | 1,444 | 7.49% | - | - | 19,276 | 100.00% | Democratic Hold |
District 6 | 26,301 | 92.52% | 2,125 | 7.48% | - | - | 28,426 | 100.00% | Democratic Hold |
District 7 | 32,896 | 97.61% | 806 | 2.39% | - | - | 33,702 | 100.00% | Democratic Hold |
District 8 | 33,270 | 95.76% | 1,470 | 4.23% | 2 | 0.01% | 34,742 | 100.00% | Democratic Hold |
District 9 | 27,560 | 94.29% | 1,668 | 5.71% | - | - | 29,228 | 100.00% | Democratic Hold |
District 10 | 32,787 | 81.62% | 6,027 | 15.00% | 1,357 | 3.38% | 40,171 | 100.00% | Democratic Hold |
District 11 | 23,731 | 65.05% | 12,749 | 34.95% | - | - | 36,480 | 100.00% | Democratic Hold |
District 12 | 24,716 | 67.11% | 12,112 | 32.89% | - | - | 36,828 | 100.00% | Democratic Hold |
District 13 | 23,744 | 60.76% | 15,336 | 39.24% | - | - | 39,080 | 100.00% | Democratic Hold |
District 14 | 20,252 | 59.44% | 12,178 | 35.75% | 1,639 | 4.81% | 34,069 | 100.00% | Democratic Hold |
District 15 | 21,739 | 61.77% | 13,452 | 38.23% | - | - | 35,191 | 100.00% | Democratic Hold |
District 16 | 24,147 | 63.97% | 13,599 | 36.03% | - | - | 37,746 | 100.00% | Democratic Hold |
District 17 | 17,151 | 44.27% | 20,232 | 52.23% | 1,355 | 3.50% | 38,738 | 100.00% | Republican GAIN |
District 18 | 29,247 | 63.31% | 16,953 | 36.69% | - | - | 46,200 | 100.00% | Democratic Hold |
District 19 | 19,504 | 38.58% | 31,045 | 61.42% | - | - | 50,549 | 100.00% | Republican Hold |
District 20 | 23,768 | 46.41% | 27,440 | 53.59% | - | - | 51,208 | 100.00% | Republican Hold |
District 21 | 28,260 | 59.43% | 19,292 | 40.57% | - | - | 47,552 | 100.00% | Democratic Hold |
District 22 | 21,487 | 60.34% | 12,341 | 34.66% | 1,780 | 5.00% | 35,608 | 100.00% | Democratic Hold |
District 23 | 24,100 | 50.34% | 23,777 | 49.66% | - | - | 47,877 | 100.00% | Democratic GAIN |
District 24 | 19,553 | 44.93% | 23,968 | 55.07% | - | - | 43,521 | 100.00% | Republican Hold |
District 25 | 21,899 | 54.11% | 18,573 | 45.89% | - | - | 40,472 | 100.00% | Democratic Hold |
District 26 | 26,785 | 59.37% | 18,333 | 40.63% | - | - | 45,118 | 100.00% | Democratic Hold |
District 27 | 36,392 | 76.78% | 11,007 | 23.22% | - | - | 47,399 | 100.00% | Democratic Hold |
District 28 | 22,680 | 66.33% | 11,514 | 33.67% | - | - | 34,194 | 100.00% | Democratic Hold |
District 29 | 23,097 | 71.25% | 8,253 | 25.46% | 1,068 | 3.29% | 32,418 | 100.00% | Democratic Hold |
District 30 | 17,026 | 46.15% | 19,863 | 53.85% | - | - | 36,889 | 100.00% | Republican Hold |
District 31 | 22,735 | 56.16% | 15,743 | 38.89% | 2,007 | 4.96% | 40,485 | 100.00% | Democratic Hold |
District 32 | 14,631 | 36.34% | 25,629 | 63.66% | - | - | 40,260 | 100.00% | Republican Hold |
District 33 | 12,987 | 30.01% | 30,295 | 69.99% | - | - | 43,282 | 100.00% | Republican Hold |
District 34 | 24,248 | 88.55% | 3,136 | 11.45% | - | - | 27,384 | 100.00% | Democratic Hold |
District 35 | 44,737 | 83.81% | 8,639 | 16.19% | - | - | 53,376 | 100.00% | Democratic Hold |
District 36 | 13,048 | 28.16% | 33,293 | 71.84% | - | - | 46,341 | 100.00% | Republican Hold |
District 37 | 29,181 | 60.63% | 17,209 | 35.75% | 1,743 | 3.62% | 48,133 | 100.00% | Democratic Hold |
District 38 | 20,711 | 42.34% | 28,205 | 57.66% | - | - | 48,916 | 100.00% | Republican Hold |
District 39 | 20,975 | 42.25% | 25,024 | 50.41% | 3,643 | 7.34% | 49,642 | 100.00% | Republican Hold |
District 40 | 26,669 | 46.52% | 30,664 | 53.48% | - | - | 57,333 | 100.00% | Republican Hold |
District 41 | 20,606 | 43.55% | 26,708 | 56.45% | - | - | 47,314 | 100.00% | Republican Hold |
District 42 | 17,309 | 32.36% | 34,015 | 63.59% | 2,167 | 4.05% | 53,491 | 100.00% | Republican Hold |
District 43 | 16,309 | 34.53% | 30,923 | 65.47% | - | - | 47,232 | 100.00% | Republican Hold |
District 44 | 15,470 | 31.44% | 33,731 | 68.56% | - | - | 49,201 | 100.00% | Republican Hold |
District 45 | 17,792 | 37.93% | 29,121 | 62.07% | - | - | 46,913 | 100.00% | Republican Hold |
District 46 | 14,642 | 30.69% | 33,073 | 69.31% | - | - | 47,715 | 100.00% | Republican Hold |
District 47 | 12,918 | 27.00% | 32,616 | 68.17% | 2,314 | 4.84% | 47,848 | 100.00% | Republican Hold |
District 48 | 22,888 | 53.82% | 19,641 | 46.18% | - | - | 42,529 | 100.00% | Democratic Hold |
District 49 | 24,862 | 68.45% | 11,458 | 31.55% | - | - | 36,320 | 100.00% | Democratic Hold |
District 50 | 22,773 | 52.03% | 20,992 | 47.97% | - | - | 43,765 | 100.00% | Democratic Hold |
District 51 | 17,050 | 33.97% | 30,468 | 60.70% | 2,677 | 5.33% | 50,195 | 100.00% | Republican Hold |
District 52 | 27,620 | 52.44% | 23,535 | 44.68% | 1,519 | 2.88% | 52,674 | 100.00% | Democratic Hold |
District 53 | 35,502 | 80.40% | 7,176 | 16.25% | 1,476 | 3.34% | 44,154 | 100.00% | Democratic Hold |
District 54 | 30,148 | 74.99% | 10,053 | 25.01% | - | - | 40,201 | 100.00% | Democratic Hold |
District 55 | 30,097 | 69.33% | 13,312 | 30.67% | - | - | 43,409 | 100.00% | Democratic Hold |
District 56 | 16,316 | 38.84% | 24,509 | 58.35% | 1,179 | 2.81% | 42,004 | 100.00% | Republican Hold |
District 57 | 18,332 | 43.62% | 23,698 | 56.38% | - | - | 42,030 | 100.00% | Republican Hold |
District 58 | 8,968 | 24.63% | 27,444 | 75.37% | - | - | 36,412 | 100.00% | Republican Hold |
District 59 | 12,117 | 33.23% | 24,342 | 66.77% | - | - | 36,459 | 100.00% | Republican Hold |
District 60 | 26,570 | 69.31% | 9,595 | 25.03% | 2,170 | 5.66% | 38,335 | 100.00% | Democratic Hold |
District 61 | 22,755 | 44.69% | 25,149 | 49.39% | 3,018 | 5.93% | 50,922 | 100.00% | Republican Hold |
District 62 | 17,490 | 47.46% | 17,699 | 48.03% | 1,660 | 4.50% | 36,849 | 100.00% | Republican Hold |
District 63 | 14,749 | 33.41% | 26,878 | 60.88% | 2,523 | 5.71% | 44,150 | 100.00% | Republican Hold |
District 64 | 13,443 | 37.48% | 22,426 | 62.52% | - | - | 35,869 | 100.00% | Republican Hold |
District 65 | 14,321 | 34.53% | 25,098 | 60.52% | 2,055 | 4.95% | 41,474 | 100.00% | Republican Hold |
District 66 | 18,568 | 45.74% | 22,024 | 54.26% | - | - | 40,592 | 100.00% | Republican Hold |
District 67 | 24,929 | 54.64% | 20,698 | 45.36% | - | - | 45,627 | 100.00% | Democratic Hold |
District 68 | 28,373 | 72.99% | 8,365 | 21.52% | 2,132 | 5.48% | 38,870 | 100.00% | Democratic Hold |
District 69 | 29,366 | 68.37% | 13,585 | 31.63% | - | - | 42,951 | 100.00% | Democratic Hold |
District 70 | 10,625 | 31.99% | 21,001 | 63.24% | 1,584 | 4.77% | 33,210 | 100.00% | Republican Hold |
District 71 | 20,926 | 42.98% | 26,315 | 54.04% | 1,450 | 2.98% | 48,691 | 100.00% | Republican Hold |
District 72 | 18,693 | 41.51% | 26,343 | 58.49% | - | - | 45,036 | 100.00% | Republican Hold |
District 73 | 17,885 | 32.36% | 35,216 | 63.72% | 2,165 | 3.92% | 55,266 | 100.00% | Republican Hold |
District 74 | 13,915 | 30.68% | 29,255 | 64.51% | 2,183 | 4.81% | 45,353 | 100.00% | Republican Hold |
District 75 | 25,868 | 76.39% | 7,996 | 23.61% | - | - | 33,864 | 100.00% | Democratic Hold |
District 76 | 27,046 | 56.72% | 18,473 | 38.74% | 2,161 | 4.53% | 47,680 | 100.00% | Democratic Hold |
District 77 | 14,528 | 34.20% | 27,946 | 65.80% | - | - | 42,474 | 100.00% | Republican Hold |
District 78 | 12,529 | 32.49% | 26,037 | 67.51% | - | - | 38,566 | 100.00% | Republican Hold |
District 79 | 15,461 | 38.42% | 23,657 | 58.78% | 1,129 | 2.81% | 40,247 | 100.00% | Republican Hold |
District 80 | 12,376 | 28.07% | 29,721 | 67.41% | 1,990 | 4.51% | 44,087 | 100.00% | Republican Hold |
District 81 | 12,633 | 31.04% | 28,068 | 68.96% | - | - | 40,701 | 100.00% | Republican Hold |
District 82 | 13,492 | 31.05% | 29,962 | 68.95% | - | - | 43,454 | 100.00% | Republican Hold |
District 83 | 12,345 | 33.54% | 23,108 | 62.79% | 1,350 | 3.67% | 36,803 | 100.00% | Republican Hold |
District 84 | 14,026 | 34.90% | 26,142 | 65.04% | 26 | 0.06% | 40,194 | 100.00% | Republican Hold |
District 85 | 15,124 | 34.44% | 24,683 | 56.21% | 4,102 | 9.34% | 43,909 | 100.00% | Republican Hold |
District 86 | 16,516 | 34.51% | 28,617 | 59.79% | 2,726 | 5.70% | 47,859 | 100.00% | Republican Hold |
District 87 | 12,955 | 28.07% | 30,957 | 67.08% | 2,238 | 4.85% | 46,150 | 100.00% | Republican Hold |
District 88 | 11,410 | 24.93% | 34,356 | 75.07% | - | - | 45,766 | 100.00% | Republican Hold |
District 89 | 17,051 | 34.36% | 30,340 | 61.14% | 2,231 | 4.50% | 49,622 | 100.00% | Republican Hold |
District 90 | 11,533 | 27.14% | 30,968 | 72.86% | - | - | 42,501 | 100.00% | Republican Hold |
District 91 | 18,558 | 43.68% | 20,959 | 49.34% | 2,965 | 6.98% | 42,482 | 100.00% | Republican Hold |
District 92 | 22,584 | 68.20% | 10,528 | 31.80% | - | - | 33,112 | 100.00% | Democratic Hold |
District 93 | 15,508 | 32.81% | 29,328 | 62.05% | 2,428 | 5.14% | 47,264 | 100.00% | Republican Hold |
District 94 | 16,402 | 35.23% | 30,150 | 64.77% | - | - | 46,552 | 100.00% | Republican Hold |
District 95 | 23,809 | 73.88% | 8,419 | 26.12% | - | - | 32,228 | 100.00% | Democratic Hold |
District 96 | 22,992 | 57.98% | 16,665 | 42.02% | - | - | 39,657 | 100.00% | Democratic Hold |
District 97 | 13,074 | 35.15% | 24,124 | 64.85% | - | - | 37,198 | 100.00% | Republican Hold |
District 98 | 16,975 | 39.83% | 25,642 | 60.17% | - | - | 42,617 | 100.00% | Republican Hold |
District 99 | 15,291 | 45.44% | 18,358 | 54.56% | - | - | 33,649 | 100.00% | Republican Hold |
District 100 | 12,514 | 32.73% | 25,721 | 67.27% | - | - | 38,235 | 100.00% | Republican Hold |
District 101 | 23,719 | 45.99% | 27,852 | 54.01% | - | - | 51,571 | 100.00% | Republican Hold |
District 102 | 11,099 | 30.95% | 24,761 | 69.05% | - | - | 35,860 | 100.00% | Republican Hold |
District 103 | 18,589 | 41.70% | 25,988 | 58.30% | - | - | 44,577 | 100.00% | Republican Hold |
District 104 | 21,864 | 43.21% | 26,020 | 51.42% | 2,714 | 5.36% | 50,598 | 100.00% | Republican Hold |
District 105 | 14,322 | 29.94% | 33,509 | 70.06% | - | - | 47,831 | 100.00% | Republican Hold |
District 106 | 16,937 | 34.87% | 29,798 | 61.34% | 1,841 | 3.79% | 48,576 | 100.00% | Republican Hold |
District 107 | 14,781 | 32.91% | 30,131 | 67.09% | - | - | 44,912 | 100.00% | Republican Hold |
District 108 | 19,725 | 47.26% | 22,013 | 52.74% | - | - | 41,738 | 100.00% | Republican Hold |
District 109 | 25,380 | 62.31% | 13,892 | 34.11% | 1,457 | 3.58% | 40,729 | 100.00% | Democratic Hold |
District 110 | 23,532 | 61.05% | 15,016 | 38.95% | - | - | 38,548 | 100.00% | Democratic Hold |
Total | 2,260,633 | 49.13% | 2,263,633 | 49.20% | 77,023 | 1.67% | 4,601,289 | 100.00% |
Following the primary elections on August 2, general election matchups and results in each district were as follows:
Party | Candidate | Votes | % | |
---|---|---|---|---|
Democratic | Brian Banks (incumbent) | 24,947 | 68.34% | |
Republican | William Broman | 11,558 | 31.66% | |
Total votes | 36,505 | 100.00% | ||
Democratic hold | ||||
Party | Candidate | Votes | % | |
---|---|---|---|---|
Democratic | Bettie Cook Scott | 25,409 | 71.83% | |
Republican | Anthony Murray | 9,962 | 28.16% | |
Write-In | DaNetta L. Simpson | 3 | 0.01% | |
Total votes | 35,374 | 100.00% | ||
Democratic hold | ||||
Party | Candidate | Votes | % | |
---|---|---|---|---|
Democratic | Wendell Byrd (incumbent) | 28,766 | 96.79% | |
Republican | John Brodersen | 955 | 3.21% | |
Total votes | 29,721 | 100.00% | ||
Democratic hold | ||||
Party | Candidate | Votes | % | |
---|---|---|---|---|
Democratic | Rose Mary Robinson (incumbent) | 24,790 | 91.87% | |
Republican | Matt Schonert | 1,397 | 5.18% | |
Green | Daniel Finn | 797 | 2.95% | |
Total votes | 26,983 | 100.00% | ||
Democratic hold | ||||
Party | Candidate | Votes | % | |
---|---|---|---|---|
Democratic | Fred Durhal III (incumbent) | 17,832 | 92.51% | |
Republican | Dorothy Patterson | 1,444 | 7.49% | |
Total votes | 19,276 | 100.00% | ||
Democratic hold | ||||
Party | Candidate | Votes | % | |
---|---|---|---|---|
Democratic | Stephanie Chang (incumbent) | 26,301 | 92.52% | |
Republican | Attie Pollard | 2,125 | 7.48% | |
Total votes | 28,426 | 100.00% | ||
Democratic hold | ||||
Party | Candidate | Votes | % | |
---|---|---|---|---|
Democratic | LaTanya Garrett (incumbent) | 32,896 | 97.61% | |
Republican | Gina Barr | 806 | 2.39% | |
Total votes | 33,702 | 100.00% | ||
Democratic hold | ||||
Party | Candidate | Votes | % | |
---|---|---|---|---|
Democratic | Sherry Gay-Dagnogo (incumbent) | 33,270 | 95.76% | |
Republican | Jennifer Rynicki | 1,470 | 4.23% | |
Write-In | DeShawn Wilkins | 2 | 0.01% | |
Total votes | 34,742 | 100.00% | ||
Democratic hold | ||||
Party | Candidate | Votes | % | |
---|---|---|---|---|
Democratic | Sylvia Santana | 27,560 | 94.29% | |
Republican | James Stephens | 1,668 | 5.71% | |
Total votes | 29,228 | 100.00% | ||
Democratic hold | ||||
Party | Candidate | Votes | % | |
---|---|---|---|---|
Democratic | Leslie Love (incumbent) | 32,787 | 81.62% | |
Republican | William Brang | 6,027 | 15.00% | |
Libertarian | Jeremy Morgan | 1,357 | 3.38% | |
Total votes | 40,171 | 100.00% | ||
Democratic hold | ||||
Party | Candidate | Votes | % | |
---|---|---|---|---|
Democratic | Jewell Jones | 23,731 | 65.05% | |
Republican | Robert Pope | 12,749 | 34.95% | |
Total votes | 36,480 | 100.00% | ||
Democratic hold | ||||
Party | Candidate | Votes | % | |
---|---|---|---|---|
Democratic | Lauren Plawecki | 24,020 | 65.79% | |
Republican | Robert Pope | 10,905 | 29.87% | |
U.S. Taxpayers Party of Michigan | Marc Joseph Sosnowski | 1,586 | 4.34% | |
Total votes | 36,511 | 100.00% | ||
Democratic hold | ||||
Party | Candidate | Votes | % | |
---|---|---|---|---|
Democratic | Erika Geiss (incumbent) | 24,716 | 67.11% | |
Republican | Erik Soderquist | 12,112 | 32.89% | |
Total votes | 36,828 | 100.00% | ||
Democratic hold | ||||
Party | Candidate | Votes | % | |
---|---|---|---|---|
Democratic | Frank Liberati (incumbent) | 23,744 | 60.76% | |
Republican | Annie Spencer | 15,336 | 39.24% | |
Total votes | 39,080 | 100.00% | ||
Democratic hold | ||||
Party | Candidate | Votes | % | |
---|---|---|---|---|
Democratic | Cara Clemente | 20,252 | 59.44% | |
Republican | Darrell Stasik | 12,178 | 35.75% | |
Libertarian | Loel R. Green | 1,639 | 4.81% | |
Total votes | 34,069 | 100.00% | ||
Democratic hold | ||||
Party | Candidate | Votes | % | |
---|---|---|---|---|
Democratic | Abdullah Hammoud | 21,739 | 61.77% | |
Republican | Terrance Guido Gerin | 13,452 | 38.23% | |
Total votes | 35,191 | 100.00% | ||
Democratic hold | ||||
Party | Candidate | Votes | % | |
---|---|---|---|---|
Democratic | Robert Kosowski (incumbent) | 24,147 | 63.97% | |
Republican | Matthew Morrow | 13,599 | 36.03% | |
Total votes | 37,746 | 100.00% | ||
Democratic hold | ||||
Party | Candidate | Votes | % | |||
---|---|---|---|---|---|---|
Republican | Joe Bellino, Jr. | 20,232 | 52.23% | |||
Democratic | Bill LaVoy (incumbent) | 17,151 | 44.27% | |||
Constitution | Jeff Andring | 1,355 | 3.50% | |||
Total votes | 38,738 | 100.00% | ||||
Republican gain from Democratic | ||||||
Party | Candidate | Votes | % | |
---|---|---|---|---|
Democratic | Kevin Hertel | 29,247 | 63.31% | |
Republican | Renata Polonaise | 16,953 | 36.69% | |
Total votes | 46,200 | 100.00% | ||
Democratic hold | ||||
Party | Candidate | Votes | % | |
---|---|---|---|---|
Republican | Laura Cox (incumbent) | 31,045 | 61.42% | |
Democratic | Steve King | 19,504 | 38.58% | |
Total votes | 50,549 | 100.00% | ||
Republican hold | ||||
Party | Candidate | Votes | % | |
---|---|---|---|---|
Republican | Jeff Noble | 27,440 | 53.59% | |
Democratic | Colleen Pobur | 23,768 | 46.41% | |
Total votes | 51,208 | 100.00% | ||
Republican hold | ||||
Party | Candidate | Votes | % | |
---|---|---|---|---|
Democratic | Kristy Pagan (incumbent) | 28,260 | 59.43% | |
Republican | Derek Moss | 19,292 | 40.57% | |
Total votes | 47,552 | 100.00% | ||
Democratic hold | ||||
Party | Candidate | Votes | % | |
---|---|---|---|---|
Democratic | John Chirkun (incumbent) | 21,487 | 60.34% | |
Republican | Jeff Bonnell | 12,341 | 34.66% | |
Constitution | Les Townsend | 1,780 | 5.00% | |
Total votes | 35,608 | 100.00% | ||
Democratic hold | ||||
Party | Candidate | Votes | % | |||
---|---|---|---|---|---|---|
Democratic | Darrin Camilleri | 24,100 | 50.34% | |||
Republican | Robert Howey | 23,777 | 49.66% | |||
Total votes | 47,877 | 100.00% | ||||
Democratic gain from Republican | ||||||
Party | Candidate | Votes | % | |
---|---|---|---|---|
Republican | Steve Marino | 23,968 | 55.07% | |
Democratic | Dana Camphous-Peterson | 19,553 | 44.93% | |
Total votes | 43,521 | 100.00% | ||
Republican hold | ||||
Party | Candidate | Votes | % | |
---|---|---|---|---|
Democratic | Henry Yanez (incumbent) | 21,899 | 54.11% | |
Republican | Steve Naumovski | 18,573 | 45.89% | |
Total votes | 40,472 | 100.00% | ||
Democratic hold | ||||
Party | Candidate | Votes | % | |
---|---|---|---|---|
Democratic | Jim Ellison | 26,785 | 59.37% | |
Republican | Randy LeVasseur | 18,333 | 40.63% | |
Total votes | 45,118 | 100.00% | ||
Democratic hold | ||||
Party | Candidate | Votes | % | |
---|---|---|---|---|
Democratic | Robert Wittenberg (incumbent) | 36,392 | 76.78% | |
Republican | Kyle Forrest | 11,007 | 23.22% | |
Total votes | 47,399 | 100.00% | ||
Democratic hold | ||||
Party | Candidate | Votes | % | |
---|---|---|---|---|
Democratic | Patrick Green (incumbent) | 22,680 | 66.63% | |
Republican | Antoine Davison | 11,514 | 33.67% | |
Total votes | 34,194 | 100.00% | ||
Democratic hold | ||||
Party | Candidate | Votes | % | |
---|---|---|---|---|
Democratic | Tim Greimel (incumbent) | 23,097 | 71.25% | |
Republican | Garren Griffith | 8,253 | 25.46% | |
Green | Artelia Marie Leak | 1,068 | 3.29% | |
Total votes | 32,418 | 100.00% | ||
Democratic hold | ||||
Party | Candidate | Votes | % | |
---|---|---|---|---|
Republican | Diana Farrington | 19,863 | 53.85% | |
Democratic | Michael Notte | 17,026 | 46.15% | |
Total votes | 36,889 | 100.00% | ||
Republican hold | ||||
Party | Candidate | Votes | % | |
---|---|---|---|---|
Democratic | William Sowerby | 22,735 | 56.16% | |
Republican | Lisa Valerio | 15,743 | 38.89% | |
Libertarian | Mike Saliba | 2,007 | 4.96% | |
Total votes | 40,485 | 100.00% | ||
Democratic hold | ||||
Party | Candidate | Votes | % | |
---|---|---|---|---|
Republican | Pamela Hornberger | 25,629 | 63.66% | |
Democratic | Paul Manley | 14,631 | 36.34% | |
Total votes | 40,260 | 100.00% | ||
Republican hold | ||||
Party | Candidate | Votes | % | |
---|---|---|---|---|
Republican | Jeffrey Yaroch | 30,295 | 69.99% | |
Democratic | Yani Warda | 12,987 | 30.01% | |
Total votes | 43,282 | 100.00% | ||
Republican hold | ||||
Party | Candidate | Votes | % | |
---|---|---|---|---|
Democratic | Sheldon Neeley (incumbent) | 24,248 | 88.55% | |
Republican | Page Brousseau | 3,136 | 11.45% | |
Total votes | 27,384 | 100.00% | ||
Democratic hold | ||||
Party | Candidate | Votes | % | |
---|---|---|---|---|
Democratic | Jeremy Moss (incumbent) | 44,737 | 83.81% | |
Republican | Robert Brim | 8,639 | 16.19% | |
Total votes | 53,376 | 100.00% | ||
Democratic hold | ||||
Party | Candidate | Votes | % | |
---|---|---|---|---|
Republican | Peter Lucido (incumbent) | 33,293 | 71.84% | |
Democratic | Diane Young | 13,048 | 28.16% | |
Total votes | 46,341 | 100.00% | ||
Republican hold | ||||
Party | Candidate | Votes | % | |
---|---|---|---|---|
Democratic | Christine Greig (incumbent) | 29,181 | 60.63% | |
Republican | Mitch Swoboda | 17,209 | 35.75% | |
Libertarian | James K. Young | 1,743 | 3.62% | |
Total votes | 48,133 | 100.00% | ||
Democratic hold | ||||
Party | Candidate | Votes | % | |
---|---|---|---|---|
Republican | Kathy Crawford (incumbent) | 28,205 | 57.66% | |
Democratic | Amy McCusker | 20,711 | 42.34% | |
Total votes | 48,916 | 100.00% | ||
Republican hold | ||||
Party | Candidate | Votes | % | |
---|---|---|---|---|
Republican | Klint Kesto (incumbent) | 25,024 | 50.41% | |
Democratic | Michael Stack | 20,975 | 42.25% | |
Unaffiliated | Beth McGrath | 3,643 | 7.34% | |
Total votes | 49,642 | 100.00% | ||
Republican hold | ||||
Party | Candidate | Votes | % | |
---|---|---|---|---|
Republican | Michael McCready (incumbent) | 30,664 | 53.48% | |
Democratic | Nicole Bedi | 26,669 | 46.52% | |
Total votes | 57,333 | 100.00% | ||
Republican hold | ||||
Party | Candidate | Votes | % | |
---|---|---|---|---|
Republican | Martin Howrylak (incumbent) | 26,708 | 56.45% | |
Democratic | Cyndi Peltonen | 20,606 | 43.55% | |
Total votes | 47,314 | 100.00% | ||
Republican hold | ||||
Party | Candidate | Votes | % | |
---|---|---|---|---|
Republican | Lana Theis (incumbent) | 34,015 | 63.59% | |
Democratic | Timothy Johnson | 17,309 | 32.36% | |
Libertarian | Jonathan Elgas | 2,167 | 4.05% | |
Total votes | 53,491 | 100.00% | ||
Republican hold | ||||
Party | Candidate | Votes | % | |
---|---|---|---|---|
Republican | Jim Tedder (incumbent) | 30,923 | 65.47% | |
Democratic | Ted Villella | 16,309 | 34.53% | |
Total votes | 47,232 | 100.00% | ||
Republican hold | ||||
Party | Candidate | Votes | % | |
---|---|---|---|---|
Republican | Jim Runestad (incumbent) | 33,731 | 68.56% | |
Democratic | Mark Venie | 15,470 | 31.44% | |
Total votes | 49,201 | 100.00% | ||
Republican hold | ||||
Party | Candidate | Votes | % | |
---|---|---|---|---|
Republican | Michael Webber (incumbent) | 29,121 | 62.07% | |
Democratic | Ted Golden | 17,792 | 37.93% | |
Total votes | 46,913 | 100.00% | ||
Republican hold | ||||
Party | Candidate | Votes | % | |
---|---|---|---|---|
Republican | John Reilly | 33,073 | 69.31% | |
Democratic | David Jay Lillis | 14,642 | 30.69% | |
Total votes | 47,715 | 100.00% | ||
Republican hold | ||||
Party | Candidate | Votes | % | |
---|---|---|---|---|
Republican | Henry Vaupel (incumbent) | 32,616 | 68.17% | |
Democratic | Keith Van Houten | 12,918 | 27.00% | |
Libertarian | Rodger Young | 2,314 | 4.84% | |
Total votes | 47,848 | 100.00% | ||
Republican hold | ||||
Party | Candidate | Votes | % | |
---|---|---|---|---|
Democratic | Pam Faris (incumbent) | 22,888 | 53.82% | |
Republican | Joseph Reno | 19,641 | 46.18% | |
Total votes | 42,529 | 100.00% | ||
Democratic hold | ||||
Party | Candidate | Votes | % | |
---|---|---|---|---|
Democratic | Phil Phelps (incumbent) | 24,862 | 68.45% | |
Republican | Jeremy Baker | 11,458 | 31.55% | |
Total votes | 36,320 | 100.00% | ||
Democratic hold | ||||
Party | Candidate | Votes | % | |
---|---|---|---|---|
Democratic | Tim Sneller | 22,773 | 52.03% | |
Republican | Michael Matheny | 20,992 | 47.97% | |
Total votes | 43,765 | 100.00% | ||
Democratic hold | ||||
Party | Candidate | Votes | % | |
---|---|---|---|---|
Republican | Joe Graves (incumbent) | 30,468 | 60.70% | |
Democratic | Ryan Bladzik | 17,050 | 33.97% | |
Libertarian | Mark L. Sanborn | 2,677 | 5.33% | |
Total votes | 50,195 | 100.00% | ||
Republican hold | ||||
Party | Candidate | Votes | % | |
---|---|---|---|---|
Democratic | Donna Lasinski | 27,620 | 52.44% | |
Republican | Randy Clark | 23,535 | 44.68% | |
Green | Eric Borregard | 1,519 | 2.88% | |
Total votes | 52,674 | 100.00% | ||
Democratic hold | ||||
Party | Candidate | Votes | % | |
---|---|---|---|---|
Democratic | Yousef Rabhi | 35,502 | 80.40% | |
Republican | Samuel Bissell | 7,176 | 16.25% | |
Green | Joseph Stevens | 1,476 | 3.34% | |
Total votes | 44,154 | 100.00% | ||
Democratic hold | ||||
Party | Candidate | Votes | % | |
---|---|---|---|---|
Democratic | Ronnie Peterson | 30,148 | 74.99% | |
Republican | Kevin Jardine | 10,053 | 25.01% | |
Total votes | 40,201 | 100.00% | ||
Democratic hold | ||||
Party | Candidate | Votes | % | |
---|---|---|---|---|
Democratic | Adam Zemke (incumbent) | 30,097 | 69.33% | |
Republican | Bob Baird | 13,312 | 30.67% | |
Total votes | 43,409 | 100.00% | ||
Democratic hold | ||||
Party | Candidate | Votes | % | |
---|---|---|---|---|
Republican | Jason Sheppard (incumbent) | 24,509 | 58.35% | |
Democratic | Tom Redmond | 16,316 | 38.84% | |
Constitution | R. Al Bain | 1,179 | 2.81% | |
Total votes | 42,004 | 100.00% | ||
Republican hold | ||||
Party | Candidate | Votes | % | |
---|---|---|---|---|
Republican | Bronna Kahle | 23,698 | 56.38% | |
Democratic | Harvey Schmidt | 18,332 | 43.62% | |
Total votes | 42,030 | 100.00% | ||
Republican hold | ||||
Party | Candidate | Votes | % | |
---|---|---|---|---|
Republican | Eric Leutheuser (incumbent) | 27,444 | 75.37% | |
Democratic | Mary Hamaty | 8,968 | 24.63% | |
Total votes | 36,412 | 100.00% | ||
Republican hold | ||||
Party | Candidate | Votes | % | |
---|---|---|---|---|
Republican | Aaron Miller (incumbent) | 24,342 | 66.77% | |
Democratic | Carol Higgins | 12,117 | 33.23% | |
Total votes | 36,459 | 100.00% | ||
Republican hold | ||||
Party | Candidate | Votes | % | |
---|---|---|---|---|
Democratic | Jon Hoadley (incumbent) | 26,570 | 69.31% | |
Republican | Alexander Ross | 9,595 | 25.03% | |
Libertarian | Logan Fleckenstein | 2,170 | 5.66% | |
Total votes | 38,335 | 100.00% | ||
Democratic hold | ||||
Party | Candidate | Votes | % | |
---|---|---|---|---|
Republican | Brandt Iden (incumbent) | 25,149 | 49.39% | |
Democratic | John Fisher | 22,755 | 44.69% | |
Libertarian | Ryan Winfield | 3,018 | 5.93% | |
Total votes | 50,922 | 100.00% | ||
Republican hold | ||||
Party | Candidate | Votes | % | |
---|---|---|---|---|
Republican | John Bizon (incumbent) | 17,699 | 48.03% | |
Democratic | James Haadsma | 17,490 | 47.46% | |
Libertarian | Michelle Gregoire | 1,660 | 4.50% | |
Total votes | 36,849 | 100.00% | ||
Republican hold | ||||
Party | Candidate | Votes | % | |
---|---|---|---|---|
Republican | David Maturen (incumbent) | 26,878 | 60.88% | |
Democratic | Lynn Shiflea | 14,749 | 33.41% | |
Green | John Anthony La Pietra | 2,523 | 5.71% | |
Total votes | 44,150 | 5.71% | ||
Republican hold | ||||
Party | Candidate | Votes | % | |
---|---|---|---|---|
Republican | Julie Alexander | 22,426 | 62.52% | |
Democratic | Ronald Brooks | 13,443 | 37.48% | |
Total votes | 35,829 | 100.00% | ||
Republican hold | ||||
Party | Candidate | Votes | % | |
---|---|---|---|---|
Republican | Brett Roberts (incumbent) | 25,098 | 60.52% | |
Democratic | Bonnie Johnson | 14,321 | 34.53% | |
Libertarian | Ronald A. Muszynski | 2,055 | 4.95% | |
Total votes | 41,474 | 100.00% | ||
Republican hold | ||||
Party | Candidate | Votes | % | |
---|---|---|---|---|
Republican | Beth Griffin | 22,024 | 54.26% | |
Democratic | Annie Brown | 18,568 | 45.74% | |
Total votes | 40,592 | 100.00% | ||
Republican hold | ||||
Party | Candidate | Votes | % | |
---|---|---|---|---|
Democratic | Tom Cochran (incumbent) | 24,929 | 54.64% | |
Republican | Leon Clark | 20,698 | 45.36% | |
Total votes | 45,627 | 100.00% | ||
Democratic hold | ||||
Party | Candidate | Votes | % | |
---|---|---|---|---|
Democratic | Andy Schor (incumbent) | 28,373 | 72.99% | |
Republican | Randy Pilon | 8,365 | 21.52% | |
Libertarian | Robert Powell | 2,132 | 5.48% | |
Total votes | 38,870 | 100.00% | ||
Democratic hold | ||||
Party | Candidate | Votes | % | |
---|---|---|---|---|
Democratic | Sam Singh (incumbent) | 29,366 | 68.37% | |
Republican | George Nastas III | 13,585 | 31.63% | |
Total votes | 42,951 | 100.00% | ||
Democratic hold | ||||
Party | Candidate | Votes | % | |
---|---|---|---|---|
Republican | James Lower | 21,001 | 63.24% | |
Democratic | Ken Hart | 10,625 | 31.99% | |
Green | Michael Anderson | 1,584 | 4.77% | |
Total votes | 33,210 | 100.00% | ||
Republican hold | ||||
Party | Candidate | Votes | % | |
---|---|---|---|---|
Republican | Tom Barrett (incumbent) | 26,315 | 54.04% | |
Democratic | Theresa Abed | 20,926 | 42.98% | |
Libertarian | Marc Lord | 1,450 | 2.98% | |
Total votes | 48,691 | 100.00% | ||
Republican hold | ||||
Party | Candidate | Votes | % | |
---|---|---|---|---|
Republican | Steve Johnson | 26,343 | 58.49% | |
Democratic | Steve Shoemaker | 18,693 | 41.51% | |
Total votes | 45,036 | 100.00% | ||
Republican hold | ||||
Party | Candidate | Votes | % | |
---|---|---|---|---|
Republican | Chris Afendoulis (incumbent) | 35,216 | 63.72% | |
Democratic | Deb Havens | 17,885 | 32.36% | |
Libertarian | Ron Heeren | 2,165 | 3.29% | |
Total votes | 55,266 | 100.00% | ||
Republican hold | ||||
Party | Candidate | Votes | % | |
---|---|---|---|---|
Republican | Robert VerHeulen (incumbent) | 29,255 | 64.51% | |
Democratic | Robin Bigger | 13,915 | 30.68% | |
Libertarian | Bill Gelineau | 2,183 | 4.81% | |
Total votes | 45,353 | 100.00% | ||
Republican hold | ||||
Party | Candidate | Votes | % | |
---|---|---|---|---|
Democratic | David LaGrand (incumbent) | 25,868 | 76.39% | |
Republican | Chad Rossiter | 7,996 | 23.61% | |
Total votes | 33,864 | 100.00% | ||
Democratic hold | ||||
Party | Candidate | Votes | % | |
---|---|---|---|---|
Democratic | Winnie Brinks (incumbent) | 27,046 | 56.72% | |
Republican | Casey O'Neill | 18,473 | 38.74% | |
Libertarian | John George | 1,558 | 3.27% | |
U.S. Taxpayers Party of Michigan | Brandon Hoezee | 603 | 1.26% | |
Total votes | 47,680 | 100.00% | ||
Democratic hold | ||||
Party | Candidate | Votes | % | |
---|---|---|---|---|
Republican | Tommy Brann | 27,946 | 65.80% | |
Democratic | Dana Knight | 14,528 | 34.20% | |
Total votes | 42,474 | 100.00% | ||
Republican hold | ||||
Party | Candidate | Votes | % | |
---|---|---|---|---|
Republican | Dave Pagel (incumbent) | 26,037 | 67.51% | |
Democratic | Dean Hill | 12,529 | 32.49% | |
Total votes | 38,566 | 100.00% | ||
Republican hold | ||||
Party | Candidate | Votes | % | |
---|---|---|---|---|
Republican | Kim LaSata | 23,657 | 58.78% | |
Democratic | Marletta Seats | 15,461 | 38.42% | |
Constitution | Carl G. Oehling | 1,129 | 2.81% | |
Total votes | 40,247 | 100.00% | ||
Republican hold | ||||
Party | Candidate | Votes | % | |
---|---|---|---|---|
Republican | Mary Whiteford (incumbent) | 29,721 | 67.41% | |
Democratic | John Andrysiak | 12,376 | 28.07% | |
Constitution | Arnie Davidsons | 1,990 | 4.51% | |
Total votes | 44,087 | 100.00% | ||
Republican hold | ||||
Party | Candidate | Votes | % | |
---|---|---|---|---|
Republican | Dan Lauwers (incumbent) | 28,068 | 68.96% | |
Democratic | Stewart Sternberg | 12,633 | 31.04% | |
Total votes | 40,701 | 100.00% | ||
Republican hold | ||||
Party | Candidate | Votes | % | |
---|---|---|---|---|
Republican | Gary Howell (incumbent) | 29,962 | 68.95% | |
Democratic | Margaret Guerrero DeLuca | 13,492 | 31.05% | |
Total votes | 43,454 | 100.00% | ||
Republican hold | ||||
Party | Candidate | Votes | % | |
---|---|---|---|---|
Republican | Shane Hernandez | 23,108 | 62.79% | |
Democratic | Jim Frank | 12,345 | 33.54% | |
Green | Deena Marie Bruderick | 1,350 | 3.67% | |
Total votes | 36,803 | 100.00% | ||
Republican hold | ||||
Party | Candidate | Votes | % | |
---|---|---|---|---|
Republican | Edward J. Canfield (incumbent) | 26,142 | 65.04% | |
Democratic | James L. Wencel | 14,026 | 34.90% | |
Write-in | Chuck Stadler | 26 | 0.06% | |
Total votes | 40,194 | 100.00% | ||
Republican hold | ||||
Party | Candidate | Votes | % | |
---|---|---|---|---|
Republican | Ben Frederick | 24,683 | 56.21% | |
Democratic | Anthony Karhoff | 15,124 | 34.44% | |
Libertarian | Roger L. Snyder | 2,425 | 5.52% | |
Constitution | Matthew Shepard | 1,674 | 3.81% | |
Write-in | Robert Cottrell | 3 | 0.01% | |
Total votes | 43,909 | 100.00% | ||
Republican hold | ||||
Party | Candidate | Votes | % | |
---|---|---|---|---|
Republican | Thomas Albert | 28,617 | 59.79% | |
Democratic | Lynn Mason | 16,516 | 34.51% | |
Green | Cliff Yankovich | 1,461 | 3.05% | |
Libertarian | Bill Gelineau | 1,265 | 2.64% | |
Total votes | 47,859 | 100.00% | ||
Republican hold | ||||
Party | Candidate | Votes | % | |
---|---|---|---|---|
Republican | Julie Calley | 30,957 | 67.08% | |
Democratic | Eric Anderson | 12,955 | 28.07% | |
Libertarian | Joseph P. Gillotte | 2,238 | 4.85% | |
Total votes | 46,150 | 100.00% | ||
Republican hold | ||||
Party | Candidate | Votes | % | |
---|---|---|---|---|
Republican | Roger Victory (incumbent) | 34,356 | 75.07% | |
Democratic | Kim Nagy | 11,410 | 24.93% | |
Total votes | 45,766 | 100.00% | ||
Republican hold | ||||
Party | Candidate | Votes | % | |
---|---|---|---|---|
Republican | Jim Lilly | 30,340 | 61.14% | |
Democratic | Tim Meyer | 17,051 | 34.36% | |
Libertarian | Mary Buzuma | 2,231 | 4.50% | |
Total votes | 49,622 | 100.00% | ||
Republican hold | ||||
Party | Candidate | Votes | % | |
---|---|---|---|---|
Republican | Daniela Garcia (incumbent) | 30,968 | 72.86% | |
Democratic | Mary M. Yedinak | 11,533 | 27.14% | |
Total votes | 42,501 | 100.00% | ||
Republican hold | ||||
Party | Candidate | Votes | % | |
---|---|---|---|---|
Republican | Holly Hughes (incumbent) | 20,959 | 49.34% | |
Democratic | Collene Lamonte | 18,558 | 43.68% | |
Libertarian | Max Riekse | 2,965 | 6.98% | |
Total votes | 42,482 | 100.00% | ||
Republican hold | ||||
Party | Candidate | Votes | % | |
---|---|---|---|---|
Democratic | Terry Sabo | 22,584 | 68.20% | |
Republican | Marshall Davis | 10,528 | 31.80% | |
Total votes | 33,112 | 100.00% | ||
Democratic hold | ||||
Party | Candidate | Votes | % | |
---|---|---|---|---|
Republican | Tom Leonard (incumbent) | 29,328 | 62.05% | |
Democratic | Josh Derke | 15,508 | 32.81% | |
Libertarian | Tyler D. Palmer | 2,428 | 5.14% | |
Total votes | 47,264 | 100.00% | ||
Republican hold | ||||
Party | Candidate | Votes | % | |
---|---|---|---|---|
Republican | Tim Kelly (incumbent) | 30,150 | 64.77% | |
Democratic | Kevin C. Seamon | 16,402 | 35.23% | |
Total votes | 46,552 | 100.00% | ||
Republican hold | ||||
Party | Candidate | Votes | % | |
---|---|---|---|---|
Democratic | Vanessa Guerra (incumbent) | 23,809 | 73.88% | |
Republican | Dorothy Tanner | 8,419 | 26.12% | |
Total votes | 32,228 | 100.00% | ||
Democratic hold | ||||
Party | Candidate | Votes | % | |
---|---|---|---|---|
Democratic | Brian K. Elder | 22,992 | 57.98% | |
Republican | David Scholl | 16,665 | 42.02% | |
Total votes | 39,657 | 100.00% | ||
Democratic hold | ||||
Party | Candidate | Votes | % | |
---|---|---|---|---|
Republican | Jason Wentworth | 24,124 | 64.85% | |
Democratic | Bob Townsend | 13,074 | 35.15% | |
Total votes | 37,198 | 100.00% | ||
Republican hold | ||||
Party | Candidate | Votes | % | |
---|---|---|---|---|
Republican | Gary Glenn (incumbent) | 25,642 | 60.17% | |
Democratic | Geoff Malicoat | 16,975 | 39.83% | |
Total votes | 42,617 | 100.00% | ||
Republican hold | ||||
Party | Candidate | Votes | % | |
---|---|---|---|---|
Republican | Roger Hauck | 18,358 | 54.56% | |
Democratic | Bryan Mielke | 15,291 | 45.44% | |
Total votes | 33,649 | 100.00% | ||
Republican hold | ||||
Party | Candidate | Votes | % | |
---|---|---|---|---|
Republican | Scott A. VanSingel | 25,721 | 67.27% | |
Democratic | Sandy Clarke | 12,514 | 32.73% | |
Total votes | 38,235 | 100.00% | ||
Republican hold | ||||
Party | Candidate | Votes | % | |
---|---|---|---|---|
Republican | Curt VanderWall | 27,852 | 54.01% | |
Democratic | Dan Scripps | 23,719 | 45.99% | |
Total votes | 51,571 | 100.00% | ||
Republican hold | ||||
Party | Candidate | Votes | % | |
---|---|---|---|---|
Republican | Michele Hoitenga | 24,761 | 69.05% | |
Democratic | Doug Gabert | 11,099 | 30.95% | |
Total votes | 35,860 | 100.00% | ||
Republican hold | ||||
Party | Candidate | Votes | % | |
---|---|---|---|---|
Republican | Daire L. Rendon | 25,988 | 58.30% | |
Democratic | Jordan Stancil | 18,589 | 41.70% | |
Total votes | 44,577 | 100.00% | ||
Republican hold | ||||
Party | Candidate | Votes | % | |
---|---|---|---|---|
Republican | Larry C. Inman | 26,020 | 51.42% | |
Democratic | Betsy Coffia | 21,864 | 43.21% | |
Libertarian | Kelly J. Clark | 2,714 | 5.36% | |
Total votes | 50,598 | 100.00% | ||
Republican hold | ||||
Party | Candidate | Votes | % | |
---|---|---|---|---|
Republican | Triston S. Cole (incumbent) | 33,509 | 70.06% | |
Democratic | Wyatt Knight | 14,322 | 29.94% | |
Total votes | 47,831 | 100.00% | ||
Republican hold | ||||
Party | Candidate | Votes | % | |
---|---|---|---|---|
Republican | Sue Allor | 29,798 | 61.34% | |
Democratic | Robert Kennedy | 16,937 | 34.87% | |
Libertarian | Dana Carver | 1,838 | 3.78% | |
Write-in | John Caplis | 3 | 0.01% | |
Total votes | 48,576 | 100.00% | ||
Republican hold | ||||
Party | Candidate | Votes | % | |
---|---|---|---|---|
Republican | Lee Chatfield (incumbent) | 30,131 | 67.09% | |
Democratic | Phil Bellfy | 14,781 | 32.91% | |
Total votes | 44,912 | 100.00% | ||
Republican hold | ||||
Party | Candidate | Votes | % | |
---|---|---|---|---|
Republican | Beau Matthew LaFave | 22,013 | 52.74% | |
Democratic | Scott A. Celello | 19,725 | 47.26% | |
Total votes | 41,738 | 100.00% | ||
Republican hold | ||||
Party | Candidate | Votes | % | |
---|---|---|---|---|
Democratic | John Kivela (incumbent) | 25,380 | 62.31% | |
Republican | Kevin W. Pfister | 13,892 | 34.11% | |
Green | Wade Roberts | 1,457 | 3.58% | |
Total votes | 40,729 | 100.00% | ||
Democratic hold | ||||
Party | Candidate | Votes | % | |
---|---|---|---|---|
Democratic | Scott Dianda (incumbent) | 23,532 | 61.05% | |
Republican | Gregory Markkanen | 15,016 | 38.95% | |
Total votes | 38,548 | 100.00% | ||
Democratic hold | ||||
The 1st District seat became vacant after Democratic state Rep. Brian Banks had to resign from the legislature as part of plea agreement with the office of Michigan Attorney General Bill Schuette. In exchange for his resignation from the House, the state would just drop multiple felony counts against Banks in which he was alleged to falsify documents to obtain a private loan before he was elected to the state House. Banks agreed to plead guilty to one misdemeanor and spend one day in the Wayne County Jail. [7]
Party | Candidate | Votes | % | |
---|---|---|---|---|
Democratic | Tenisha Yancey | 2,215 | 33.0 | |
Democratic | Pamela Sossi | 2,017 | 30.1 | |
Democratic | Sandra Bucciero | 956 | 14.3 | |
Democratic | Justin Johnson | 615 | 9.2 | |
Democratic | Washington Youson | 415 | 6.2 | |
Democratic | Keith Hollowell | 956 | 2.2 | |
Democratic | Kirkland Garey | 107 | 1.6 | |
Democratic | Burgess Foster | 78 | 1.2 | |
Democratic | John Donahue | 76 | 1.2 | |
Democratic | Gowana Mancill Jr. | 45 | 0.7 | |
Democratic | Ronald Diebel | 36 | 0.5 | |
Party | Candidate | Votes | % | |
---|---|---|---|---|
Republican | Mark Corcoran | 819 | 74.4 | |
Republican | William Phillips | 282 | 25.6 | |
Party | Candidate | Votes | % | |
---|---|---|---|---|
Democratic | Tenisha Yancey | 7,266 | 71.3 | |
Republican | Mark Corcoran | 2,551 | 25.0 | |
Libertarian | Greg Creswell | 334 | 3.3 | |
The 109th District seat became vacant after state Rep. John Kivela committed suicide just hours after he was arrested for drunk driving for the second time during his time in the legislature. [10]
Party | Candidate | Votes | % | |
---|---|---|---|---|
Democratic | Sara Cambensy | 3,477 | 36.1 | |
Democratic | Jeremy Hosking | 3,344 | 34.7 | |
Democratic | Joe Derocha | 2,435 | 25.3 | |
Democratic | Tom Curry | 386 | 4.0 | |
Party | Candidate | Votes | % | |
---|---|---|---|---|
Republican | Rich Rossway | 1,671 | 100 | |
Party | Candidate | Votes | % | |
---|---|---|---|---|
Democratic | Sara Cambensy | 11,721 | 56.7 | |
Republican | Rich Rossway | 8,690 | 42.0 | |
Green | Wade Roberts | 276 | 1.3 | |
On November 7, 2017, term-limited Democratic state Rep. Andy Schor was elected mayor of Lansing, to succeed Virg Bernero. Schor will take office on January 1, 2018. [13] After Schor formally resigns from the House, Gov. Rick Snyder will call a special election to fill the remaining balance of Schor's term, which expires January 1, 2019.
The 2014 Michigan House of Representatives elections were held on November 4, 2014, with partisan primaries to select the parties' nominees in the various districts on August 5, 2014. Members elected at the 2014 election served in the 98th Michigan Legislature which convened on January 7, 2015.
Brian Roderick Banks is an American politician who served as a member of the Michigan House of Representatives from 2013 to 2017. Banks was a candidate for the 2nd District of the Michigan Senate in 2018. He has been convicted of eight felonies related to writing bad checks and credit card fraud.
Andy Schor is an American politician currently serving as the 52nd mayor of Lansing, Michigan. A member of the Democratic Party, Schor was previously a member of the Ingham County Board of Commissioners. He also represented the 68th district in the Michigan House of Representatives, which includes most of the City of Lansing and all of Lansing Township. Schor is the first Jewish mayor of Lansing.
The 2017 United States elections were held, in large part, on Tuesday, November 7, 2017. This off-year election featured gubernatorial elections in Virginia and New Jersey, as well as state legislative elections in both houses of the New Jersey Legislature and in the Virginia House of Delegates. Numerous citizen initiatives, mayoral races, and a variety of other local elections also occurred. Special elections were also held for one seat of the U.S. Senate, representing Alabama, and six seats of the U.S. House of Representatives. The Democrats picked up the governorship in New Jersey and the Alabama Senate seat that was up for a special election. The governorship in Virginia and the six House seats that were up for special elections did not change party hands.
The 2016 United States House of Representatives elections in Michigan were held on November 8, 2016, to elect the 14 U.S. representatives from the state of Michigan, one from each of the state's 14 congressional districts. The elections coincided with the 2016 U.S. presidential election, as well as other elections to the House of Representatives, elections to the United States Senate in 33 other states and various state and local elections. The deadline for candidates to file for the August 2 primary election was April 19.
Cindy Gamrat is a former Republican member of the Michigan House of Representatives, representing the 80th district. She was first elected in 2014, after playing a leading role in organizing the Tea Party movement in Michigan. She engaged in an extramarital affair with fellow Representative Todd Courser, and was expelled from the House in September 2015 for using taxpayer resources in an attempt to cover up the affair.
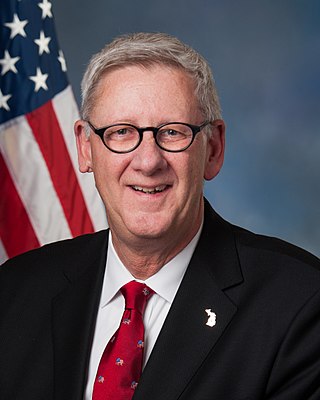
The 2018 United States House of Representatives elections in Michigan were held on November 6, 2018, to elect the 14 U.S. representatives from the state of Michigan, one from each of the state's 14 congressional districts. The elections coincided with the elections of other offices, including a gubernatorial election, other elections to the House of Representatives, elections to the United States Senate, and various state and local elections. The filing deadline for candidates filing for the August 7 primary was April 24, 2018. Unless otherwise indicated, the Cook Political Report rated the congressional races as safe for the party of the incumbent.
James Lower is an American politician who has served as a Republican member of the Michigan House of Representatives representing the 70th district since 2017. Lower previously served on the Ionia County Board of Commissioners, was the Village Manager of Edmore, Michigan, and was the campaign manager for Brian Calley's state senate campaign in 2010.
An election was held on November 6, 2018 to elect all 110 members to Michigan's House of Representatives. The election coincided with elections for other offices, including U.S. Senate, U.S. House of Representatives, Governor and Senate. The primary election was held on August 7, 2018.
Angela Kaye Witwer is an American politician and a Democratic member of the Michigan House of Representatives, serving the 76th House District.
Michigan's 43rd House of Representatives district is a legislative district within the Michigan House of Representatives located in parts of Allegan, Barry, and Eaton counties. The district was created in 1965, when the Michigan House of Representatives district naming scheme changed from a county-based system to a numerical one.
Michigan's 57th House of Representatives district is a legislative district within the Michigan House of Representatives located in part of Macomb and Oakland counties. The district was created in 1965, when the Michigan House of Representatives district naming scheme changed from a county-based system to a numerical one.
Michigan's 68th House of Representatives district is a legislative district within the Michigan House of Representatives located in parts of Genesee and Oakland counties. The district was created in 1965, when the Michigan House of Representatives district naming scheme changed from a county-based system to a numerical one.
Michigan's 74th House of Representatives district is a legislative district within the Michigan House of Representatives located in part of Ingham County. The district was created in 1965, when the Michigan House of Representatives district naming scheme changed from a county-based system to a numerical one.
The 2020 United States state legislative elections were held on November 3, 2020, for 86 state legislative chambers in 44 states. Across the fifty states, approximately 65 percent of all upper house seats and 85 percent of all lower house seats were up for election. Nine legislative chambers in the five permanently-inhabited U.S. territories and the federal district of Washington, D.C. also held elections. The elections took place concurrently with several other federal, state, and local elections, including the presidential election, U.S. Senate elections, U.S. House elections, and gubernatorial elections.
Michigan's 104th House of Representatives district is a legislative district within the Michigan House of Representatives located in parts of Antrim, Benzie, Grand Traverse, Kalkaska, Manistee, and Wexford counties. The district was created in 1965, when the Michigan House of Representatives district naming scheme changed from a county-based system to a numerical one.
Michigan's 15th House of Representatives district is a legislative district within the Michigan House of Representatives located in part of Wayne County. The district was created in 1965, when the Michigan House of Representatives district naming scheme changed from a county-based system to a numerical one.
Michigan's 20th House of Representatives district is a legislative district within the Michigan House of Representatives anchored in the central Oakland County community of West Bloomfield Township, alongside the cities of Orchard Lake, Keego Harbor, Sylvan Lake, and parts of Commerce and Bloomfield townships.
Michigan's 25th House of Representatives district is a legislative district within the Michigan House of Representatives located in part of Wayne County. The district was created in 1965, when the Michigan House of Representatives district naming scheme changed from a county-based system to a numerical one.
Michigan's 34th House of Representatives district is a legislative district within the Michigan House of Representatives located in part of Lenawee County. The district was created in 1965, when the Michigan House of Representatives district naming scheme changed from a county-based system to a numerical one.