
Thomas Charles Sawyer was an American politician of the Democratic Party. During a career that spanned five decades, he represented his hometown of Akron, Ohio, across multiple levels of government. He was a member of the Ohio House of Representatives from 1977 to 1983, the Mayor of Akron from 1984 to 1986, a member of the United States House of Representatives from 1987 to 2003, and a member of the Ohio Senate from 2007 to 2016.

The 2008 United States elections were held on Tuesday, November 4, 2008, during the war on terror and the onset of the Great Recession. It was considered a Democratic wave election, with Democratic Senator Barack Obama of Illinois defeating Senator John McCain of Arizona by a wide margin, and the Democrats bolstering their majorities in both chambers of Congress, thereby marking the first time since 1992 in which the Democrats won Congress and the presidency in one election.
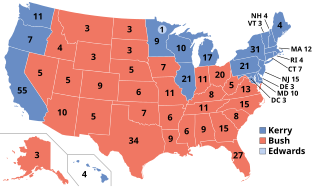
The 2004 United States elections were held on Tuesday, November 2, 2004, during the early years of the war on terror and after the 2003 invasion of Iraq. Republican President George W. Bush won re-election and Republicans retained control of Congress.

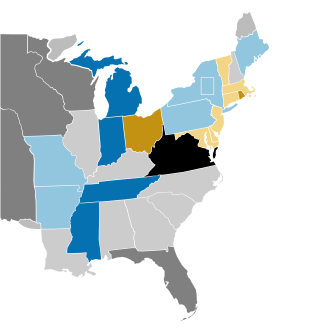
The 1848–49 United States Senate elections were held on various dates in various states. As these U.S. Senate elections were prior to the ratification of the Seventeenth Amendment in 1913, senators were chosen by state legislatures. Senators were elected over a wide range of time throughout 1848 and 1849, and a seat may have been filled months late or remained vacant due to legislative deadlock. In these elections, terms were up for the senators in Class 3.
The 1844–45 United States Senate elections were held on various dates in various states, coinciding with James K. Polk's election. As these U.S. Senate elections were prior to the ratification of the Seventeenth Amendment in 1913, senators were chosen by state legislatures. Senators were elected over a wide range of time throughout 1844 and 1845, and a seat may have been filled months late or remained vacant due to legislative deadlock.

The 1830–31 United States Senate elections were held on various dates in various states. As these U.S. Senate elections were prior to the ratification of the Seventeenth Amendment in 1913, senators were chosen by state legislatures. Senators were elected over a wide range of time throughout 1830 and 1831, and a seat may have been filled months late or remained vacant due to legislative deadlock. In these elections, terms were up for the senators in Class 3.

The 2018 United States Senate elections were held on November 6, 2018. Among the 100 seats, the 33 of Class 1 were contested in regular elections while 2 others were contested in special elections due to Senate vacancies in Minnesota and Mississippi. The regular election winners were elected to 6-year terms running from January 3, 2019, to January 3, 2025. Senate Democrats had 26 seats up for election, while Senate Republicans had 9 seats up for election.
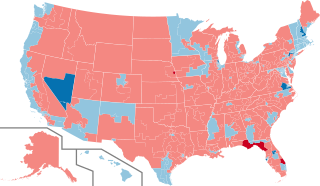
The 2016 United States House of Representatives elections were held on November 8, 2016, to elect representatives for all 435 congressional districts across each of the 50 U.S. states to the 115th United States Congress. Non-voting members for the District of Columbia and territories of the United States were also elected. These elections coincided with the election of President Donald Trump, although his party lost seats in both chambers of Congress. The winners of this election served in the 115th Congress, with seats apportioned among the states based on the 2010 United States census. In October 2015, the House elected a new Speaker, Republican Paul Ryan, who was re-elected in the new term. Democrat Nancy Pelosi continued to lead her party as Minority Leader. Elections were also held on the same day for the U.S. Senate, many governors, and other state and local elections.

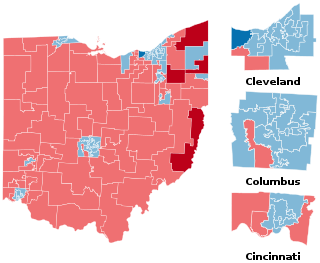
The 2016 United States House of Representatives elections in Ohio were held on November 8, 2016, to elect the 16 U.S. representatives from the state of Ohio, one from each of the state's 16 congressional districts. The elections coincided with the 2016 U.S. presidential election, as well as other elections to the House of Representatives, elections to the United States Senate and various state and local elections. The primaries were held on March 15.

The Ohio general elections, 2016 were held on November 8, 2016 throughout Ohio. The close of registration for electors in the primary election was December 16, 2015, and the primary election took place on March 15, 2016.
The Ohio general elections, 2018, were held on November 6, 2018, throughout Ohio.

The Iowa general elections, 2016 were held in the U.S. state of Iowa on November 8, 2016. One of Iowa's U.S. Senate seats and all four seats in the United States House of Representatives were up for election, as well as half of the Iowa Senate seats and all of the Iowa House of Representatives seats. Primary elections were held on June 7, 2016.

The 2022 United States Senate elections were held on November 8, 2022, concurrently with other midterm elections at the federal, state, and local levels. Regularly scheduled elections were held for 34 of the 100 seats in the U.S. Senate, the winners of which will serve 6-year terms beginning with the 118th United States Congress. 2 special elections were held to complete unexpired terms. While pundits considered the Republican Party a slight favorite to gain control of the Senate, the Democrats outperformed expectations and expanded the majority they had held since 2021, gaining a seat for a functioning 51–49 majority.

An election was held on November 6, 2018, to elect all 99 members to Ohio's House of Representatives. The election coincided with the elections for other offices, including U.S. Senate, U.S. House of Representatives, state governor and state senate. The primary election was held on May 8, 2018.
The 2020 Ohio general elections were held on November 3, 2020 throughout the US state of Ohio. The office of the Ohio Secretary of State oversees the election process, including voting and vote counting.

The 2018 Ohio Senate election was held on November 6, 2018, with the primary election held on May 8, 2018. Ohio voters elected state senators in the 17 odd-numbered Ohio Senate districts. State senators elected in 2018 are eligible to serve a four-year term beginning January 2019 and ending December 2022. These elections coincided with elections for Ohio Governor, the Ohio House, the U.S. House of Representatives, the U.S. Senate, and other statewide offices.
The 2020 Ohio House of Representatives Election was held on November 3, 2020, with the primary election held on April 28, 2020. Ohio voters elected state representatives in the 99 Ohio House of Representatives districts. State representatives elected in 2020 will be eligible to serve a two-year term beginning January 2021 and ending December 2022. These elections will coincide with elections for U.S. President and the Ohio Senate.
The 2022 Ohio general elections took place on November 8, 2022, throughout the US state of Ohio.

The 2016 United States state legislative elections were held on November 8, 2016, for 86 state legislative chambers in 44 states. Across the fifty states, approximately 65 percent of all upper house seats and 85 percent of all lower house seats were up for election. Nine legislative chambers in the five permanently-inhabited U.S. territories and the federal district of Washington, D.C. also held elections. The elections took place concurrently with several other federal, state, and local elections, including the presidential election, U.S. Senate elections, U.S. House elections, and gubernatorial elections.


