List of United States Senate elections in Ohio

Last updated

United States Senate elections in Ohio occur when voters in the U.S. state of Ohio select an individual to represent the state in the United States Senate in either of the state's two seats allotted by the Constitution. Regularly scheduled general elections occur on Election Day, coinciding with various other federal, statewide, and local races.

Contents

Each state is allotted two U.S. Senators elected to staggered six-year terms, which were originally selected by the state legislature. The Senate is divided into three classes to stagger the terms of its members such that one-third of the Senate would be up for re-election every two years. Upon Ohio's admission to the Union in 1803, the state was assigned a Class 1 seat and a Class 3 seat, first elected in 1803. Since the passage of the Seventeenth Amendment in 1913, U.S. Senators are elected directly by the voters of each state. Special elections may be held to fill mid-term vacancies to elect an individual to serve the remainder of the unexpired term.

The list below contains results from all U.S. Senate elections held in Ohio after the passage of the Seventeenth Amendment, sorted by year. The next scheduled election for the Class 1 seat is in 2024, while the Class 3 seat will hold its next election in 2028.

List of recent elections

Class 1

YearWinnerRunner(s)-upOthersRef
CandidatePartyVotes %CandidatePartyVotes %Votes %
1916 Atlee Pomerene Democratic 571,48849.26% Myron T. Herrick Republican 535,39146.15%53,2124.59% [1]
1922 Simeon D. Fess Republican 794,159 Atlee Pomerene Democratic 744,55821,514 [2]
1928 Simeon D. Fess Republican 1,412,805 Charles V. Truax Democratic 908,9524,448 [3]
1934 A. Victor Donahey Democratic 1,276,206 Simeon D. Fess Republican 839,06813,569 [4]
1940 Harold Hitz Burton Republican 1,602,498 John McSweeney Democratic 1,457,304 [5]
1946 (sp) Kingsley A. Taft Republican 1,193,852Henry P. Webber Democratic 929,584 [6]
1946 John W. Bricker Republican 1,275,774 James W. Huffman Democratic 947,61013,885
1952 John W. Bricker Republican 1,878,961 Michael DiSalle Democratic 1,563,330 [7]
1958 Stephen M. Young Democratic 1,652,211 John W. Bricker Republican 1,497,199 [8]
1964 Stephen M. Young Democratic 1,923,608 Robert Taft Jr. Republican 1,906,781 [9]
1970 Robert Taft Jr. Republican 1,565,682 Howard Metzenbaum Democratic 1,495,26290,330 [10]
1976 Howard Metzenbaum Democratic 1,941,113 Robert Taft Jr. Republican 1,823,774155,726 [11]
1982 Howard Metzenbaum Democratic 1,923,76756.66% Paul Pfeifer Republican 1,396,79041.14%74,9062.20% [12]
1988 Howard Metzenbaum Democratic 2,480,03856.97% George Voinovich Republican 1,872,71643.02%1510.00% [13]
1994 Mike DeWine Republican 1,836,55653.44% Joel Hyatt Democratic 1,348,21339.23%840.00% [14]
Joe Slovenec Independent 252,0317.33%
2000 Mike DeWine Republican 2,665,51259.92% Ted Celeste Democratic 1,595,06635.85%188,2234.23% [15]
2006 Sherrod Brown Democratic 2,257,36956.16% Mike DeWine Republican 1,761,03743.82%8300.02% [16]
2012 Sherrod Brown Democratic 2,762,76650.70% Josh Mandel Republican 2,435,74444.70%250,6174.60% [17]
2018 Sherrod Brown Democratic 2,358,50853.40% Jim Renacci Republican 2,057,55946.58%1,0170.02% [18]
County results of Class 1 elections since 2000

Class 3

YearWinnerRunner(s)-upOthersRef
CandidatePartyVotes %CandidatePartyVotes %Votes %
1914 Warren G. Harding Republican 526,11549.16% Timothy Sylvester Hogan Democratic 423,74239.60%52,8034.93% [19]
Arthur Lovett Garford Progressive 67,5096.31%
1920 Frank B. Willis Republican 1,134,953 William Alexander Julian Democratic 782,6502,647 [20]
1926 Frank B. Willis Republican 711,359 Atlee Pomerene Democratic 623,2212,846 [21]
1928 (sp) Theodore E. Burton Republican 1,429,554Graham P. Hunt Democratic 856,8073,451 [3]
1930 (sp) Robert J. Bulkley Democratic 1,046,561 Roscoe C. McCulloch Republican 863,944 [22]
1932 Robert J. Bulkley Democratic 1,293,175 Gilbert Bettman Republican 1,126,83241,987 [23]
1938 Robert A. Taft Republican 1,255,414 Robert J. Bulkley Democratic 1,085,792 [24]
1944 Robert A. Taft Republican 1,500,609 William G. Pickrel Democratic 1,482,610 [25]
1950 Robert A. Taft Republican 1,645,643 Joseph T. Ferguson Democratic 1,214,459 [26]
1954 (sp) George H. Bender Republican 1,257,874 Thomas A. Burke Democratic 1,254,904 [27]
1956 Frank Lausche Democratic 1,864,589 George H. Bender Republican 1,660,910 [28]
1962 Frank Lausche Democratic 1,843,813John Marshall Briley Republican 1,151,173 [29]
1968 William B. Saxbe Republican 1,928,964 John J. Gilligan Democratic 1,814,1524 [30]
1974 John Glenn Democratic 1,930,670 Ralph Perk Republican 918,133138,803 [31]
1980 John Glenn Democratic 2,770,786 Jim Betts Republican 1,137,695118,822 [32]
1986 John Glenn Democratic 1,949,20862.45% Tom Kindness Republican 1,171,89337.55%880.00% [33]
1992 John Glenn Democratic 2,444,39750.88% Mike DeWine Republican 2,028,43442.22% [34]
Martha Grevatt Workers World 331,1256.89%
1998 George Voinovich Republican 1,922,08756.46% Mary O. Boyle Democratic 1,482,05443.53%2100.01% [35]
2004 George Voinovich Republican 3,464,65163.85% Eric Fingerhut Democratic 1,961,24936.14%2960.01% [36]
2010 Rob Portman Republican 2,168,74256.85% Lee Fisher Democratic 1,503,29739.40%143,0593.75% [37]
2016 Rob Portman Republican 3,118,56758.03% Ted Strickland Democratic 1,996,90837.16%258,6894.81% [38]
2022 J. D. Vance Republican 2,192,11453.04% Tim Ryan Democratic 1,939,48946.92%1,7390.04% [39]
County results of Class 3 elections since 2004

See also

Related Research Articles

<span class="mw-page-title-main">United States congressional delegations from Hawaii</span>

Since Hawaii became a state in 1959, it has sent congressional delegations to the United States Senate and United States House of Representatives. Each state elects two senators to serve for six years. Members of the House of Representatives are elected to two-year terms, one from each of Hawaii's congressional districts. Before becoming a state, the Territory of Hawaii elected a non-voting delegate at-large to Congress from 1900 to 1958.

<span class="mw-page-title-main">7th United States Congress</span> 1801–1803 U.S. Congress

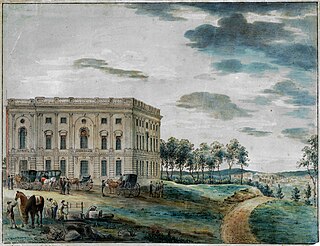
The 7th United States Congress was a meeting of the legislative branch of the United States federal government, consisting of the United States Senate and the United States House of Representatives. It met in Washington, D.C. from March 4, 1801, to March 4, 1803, during the first two years of Thomas Jefferson's presidency. The apportionment of seats in the House of Representatives was based on the 1790 United States census. Both chambers had a Democratic-Republican majority, except during the Special session of the Senate, when there was a Federalist majority in the Senate.

<span class="mw-page-title-main">Rob Portman</span> American lawyer and politician (born 1955)

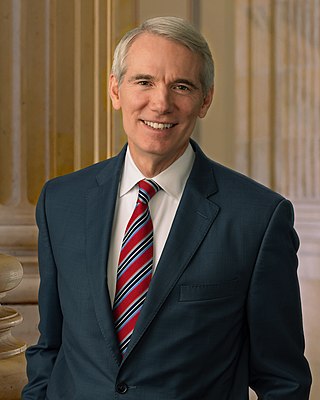
Robert Jones Portman is an American attorney and politician who served as a United States senator from Ohio from 2011 to 2023. A member of the Republican Party, Portman was the 35th director of the Office of Management and Budget (OMB) from 2006 to 2007, the 14th United States trade representative from 2005 to 2006, and a U.S. representative from 1993 to 2005, representing Ohio's 2nd district.

<span class="mw-page-title-main">United States congressional delegations from Virginia</span>

These are tables of congressional delegations from Virginia to the United States Senate and United States House of Representatives. Virginia's current U.S. Senators are Democrats Mark Warner and Tim Kaine. Virginia is allotted 11 seats in the U.S. House Of Representatives; currently, 6 seats are held by Democrats and 5 seats are held by Republicans.

<span class="mw-page-title-main">1952 United States Senate elections</span>

The 1952 United States Senate elections was an election for the United States Senate which coincided with the election of Dwight D. Eisenhower to the presidency by a large margin. The 32 Senate seats of Class 1 were contested in regular elections, and three special elections were held to fill vacancies. The Republicans took control of the Senate by managing to make a net gain of two seats, which was reduced to one when Wayne Morse (R-OR) became an independent. The Republicans still held a majority after Morse's switch. This election was the second time in history that the party in power lost their majority and the Senate majority leader lost his own re-election bid. In addition, this was the third time, as well as second consecutive, in which a sitting Senate leader lost his seat.

<span class="mw-page-title-main">1940 United States Senate elections</span>

The 1940 United States Senate elections coincided with the election of Franklin D. Roosevelt to his third term as president. The 32 seats of Class 1 were contested in regular elections, and special elections were held to fill vacancies.

<span class="mw-page-title-main">J. Glenn Beall</span> American politician

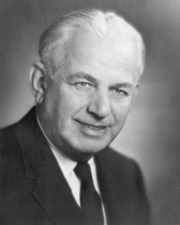
James Glenn Beall was an American businessman and politician. A member of the Republican Party, he served as a U.S. Representative (1943–1953) and a U.S. Senator (1953–1965) from Maryland.

<span class="mw-page-title-main">1992 United States Senate election in North Dakota</span>

The 1992 United States Senate election in North Dakota was held on November 3, 1992, along with other elections to the United States Senate in other states as well as elections to the United States House of Representatives and various state and local elections. Incumbent Democratic-NPL U.S. Senator Kent Conrad retired, having given a pledge that he would not run for re-election if the federal budget deficit was higher than when he was first elected; however, when the other Senate seat became vacant, he ran in the special election and won. Democratic-NPL U.S. Congressman Byron Dorgan won the open seat.

<span class="mw-page-title-main">2008 United States elections</span>

The 2008 United States elections were held on November 4. Democratic Senator Barack Obama of Illinois won the presidential election, by defeating his challenger, Senator John McCain, and the Democrats bolstered their majority in both Houses of Congress.

<span class="mw-page-title-main">4th United States Congress</span> 1795–1797 meeting of U.S. legislature

The 4th United States Congress was a meeting of the legislative branch of the United States federal government, consisting of the United States Senate and the United States House of Representatives. It met at Congress Hall in Philadelphia, Pennsylvania, from March 4, 1795, to March 4, 1797, during the last two years of George Washington's presidency. The apportionment of seats in the House of Representatives was based on the 1790 United States census. The Senate had a Federalist majority, and the House had a Democratic-Republican majority.

<span class="mw-page-title-main">Electoral history of Joe Biden</span> Overview of Joe Bidens electoral history

The electoral history of Joe Biden, the 46th and current president of the United States, began in 1970. Biden served as the 47th vice president (2009–2017), and as a United States senator from Delaware (1973–2009). Biden is the oldest elected and serving president, the second Catholic president, after John F. Kennedy, and the first president from Delaware.

<span class="mw-page-title-main">1972 United States elections</span>

The 1972 United States elections was held on November 7, and elected the members of the 93rd United States Congress. The election took place during the later stages of the Vietnam War. The Republican Party won a landslide victory in the presidential election, and picked up seats in the House, but the Democratic Party easily retained control of Congress. This was the first election after the ratification of the 26th Amendment granted the right to vote to those aged 18–20.

<span class="mw-page-title-main">1952 United States elections</span>

The 1952 United States elections were held on November 4, 1952. The Republicans took control of the presidency and both chambers of Congress for the first time since the Great Depression. The election took place during the Korean War.

<span class="mw-page-title-main">1940 United States elections</span>

The 1940 United States elections was held on November 5. The Democratic Party continued to dominate national politics, as it defended its Congressional majorities and retained the presidency. It was the last election prior to the attack on Pearl Harbor and America's entry into World War II.

<span class="mw-page-title-main">1992 United States House of Representatives elections in New Hampshire</span>

The 1992 congressional elections in New Hampshire were held on November 3, 1992. They determined who would represent the state of New Hampshire in the United States House of Representatives. Representatives are elected for two-year terms; those elected served in the 103rd Congress from January 1993 until January 1995. New Hampshire has two seats in the House, apportioned according to the 1990 United States Census.

<span class="mw-page-title-main">1940 United States Senate special election in Illinois</span>

The 1940 United States Senate special election in Illinois took place on November 5, 1940. The election was triggered by the vacancy left by the death in office of Democrat J. Hamilton Lewis. After Lewis' death, James M. Slattery was appointed to fill the seat in the interim period until the individual elected in the special election would be sworn-in. Slattery was the Democratic Party's nominee in the special election. He was defeated by Republican nominee Charles W. Brooks.

<span class="mw-page-title-main">2022 United States Senate election in Ohio</span>

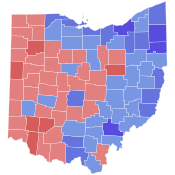
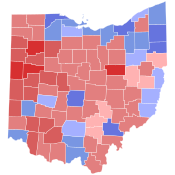
The 2022 United States Senate election in Ohio was held on November 8, 2022, to elect a member of the United States Senate to represent the State of Ohio. Republican writer and venture capitalist J. D. Vance defeated Democratic U.S. Representative Tim Ryan to succeed retiring incumbent Republican Rob Portman.

References

  1. "OH Senate Race - Nov 07, 1916". Our Campaigns.
  2. "Statistics of the Congressional Election of November 7, 1922" (PDF). Clerk of the United States House of Representatives .
  3. 1 2 "Statistics of the Congressional and Presidential Election of November 6, 1928" (PDF). Clerk of the United States House of Representatives .
  4. "Statistics of the Congressional Election of November 6, 1934" (PDF). Clerk of the United States House of Representatives .
  5. "Statistics of the Presidential and Congressional Election of November 5, 1940" (PDF). Clerk of the United States House of Representatives .
  6. "Statistics of the Congressional Election of November 5, 1946" (PDF). Clerk of the United States House of Representatives .
  7. "Statistics of the Presidential and Congressional Election of November 4, 1952" (PDF). Clerk of the United States House of Representatives .
  8. "Statistics of the Congressional Election of November 4, 1958" (PDF). Clerk of the United States House of Representatives .
  9. "Statistics of the Presidential and Congressional Election of November 3, 1964" (PDF). Clerk of the United States House of Representatives .
  10. "Statistics of the Congressional Election of November 3, 1970" (PDF). Clerk of the United States House of Representatives .
  11. "Statistics of the Presidential and Congressional Election of November 2, 1976" (PDF). Clerk of the United States House of Representatives .
  12. "Federal Elections 1982" (PDF). Federal Election Commission .
  13. "Federal Elections 1988" (PDF). Federal Election Commission .
  14. "Federal Elections 1994" (PDF). Federal Election Commission .
  15. "Federal Elections 2000" (PDF). Federal Election Commission .
  16. "Federal Elections 2006" (PDF). Federal Election Commission .
  17. "Federal Elections 2012" (PDF). Federal Election Commission .
  18. "Federal Elections 2018" (PDF). Federal Election Commission .
  19. "OH Senate Race - Nov 08, 1914". Our Campaigns.
  20. "Statistics of the Congressional and Presidential Election of November 2, 1920" (PDF). Clerk of the United States House of Representatives .
  21. "Statistics of the Congressional Election of November 2, 1926" (PDF). Clerk of the United States House of Representatives .
  22. "Statistics of the Congressional Election of November 4, 1930" (PDF). Clerk of the United States House of Representatives .
  23. "Statistics of the Congressional and Presidential Election of November 8, 1932" (PDF). Clerk of the United States House of Representatives .
  24. "Statistics of the Congressional Election of November 8, 1938" (PDF). Clerk of the United States House of Representatives .
  25. "Statistics of the Presidential and Congressional Election of November 7, 1944" (PDF). Clerk of the United States House of Representatives .
  26. "Statistics of the Congressional Election of November 7, 1950" (PDF). Clerk of the United States House of Representatives .
  27. "Statistics of the Congressional Election of November 2, 1954" (PDF). Clerk of the United States House of Representatives .
  28. "Statistics of the Presidential and Congressional Election of November 6, 1956" (PDF). Clerk of the United States House of Representatives .
  29. "Statistics of the Congressional Election of November 6, 1962" (PDF). Clerk of the United States House of Representatives .
  30. "Statistics of the Presidential and Congressional Election of November 5, 1968" (PDF). Clerk of the United States House of Representatives .
  31. "Statistics of the Congressional Election of November 4, 1974" (PDF). Clerk of the United States House of Representatives .
  32. "Statistics of the Presidential and Congressional Election of November 4, 1980" (PDF). Clerk of the United States House of Representatives .
  33. "Federal Elections 1986" (PDF). Federal Election Commission .
  34. "Federal Elections 1992" (PDF). Federal Election Commission .
  35. "Federal Elections 1998" (PDF). Federal Election Commission .
  36. "Federal Elections 2004" (PDF). Federal Election Commission .
  37. "Federal Elections 2010" (PDF). Federal Election Commission .
  38. "Federal Elections 2016" (PDF). Federal Election Commission .
  39. "2022 OFFICIAL ELECTION RESULTS". Ohio Secretary of State .