1926 United States Senate elections

Last updated

1926 United States Senate elections
Flag of the United States (1912-1959).svg
  1924 November 2, 1926 [lower-alpha 1] 1928  
  1925 (WI)

32 of the 96 seats in the United States Senate
49 seats needed for a majority
 Majority partyMinority party
  Charles Curtis-portrait.jpg Joseph T. Robinson cropped.jpg
Leader Charles Curtis Joseph Robinson
Party Republican Democratic
Leader sinceNovember 9, 1924December 3, 1923
Leader's seat Kansas Arkansas
Seats before5639
Seats after4946
Seat changeDecrease2.svg 7Increase2.svg 7
Seats up287
Seats won2114

 Third party
 
Party Farmer–Labor
Seats before1
Seats after1
Seat changeSteady2.svg
Seats up0
Seats won0

1926 United States Senate elections results map.svg
Results of the elections:
     Democratic gain     Democratic hold
     Republican hold
     No election

Majority Leader before election

Charles Curtis
Republican

Elected Majority Leader

Charles Curtis
Republican

The 1926 United States Senate elections were elections for the United States Senate that occurred in the middle of Republican President Calvin Coolidge's second term. The 32 seats of Class 3 were contested in regular elections, and special elections were held to fill vacancies. The Republican majority was reduced by seven seats.

Contents

Gains, losses, and holds

Retirements

One Republican and one Democrat retired instead of seeking re-election.

StateSenatorReplaced by
Alabama Oscar Underwood Hugo Black
Iowa David W. Stewart Smith W. Brookhart

Defeats

Ten Republicans sought re-election but lost in the primary or general election. One Republican sought election to finish the unexpired term but lost in the general election and one Republican sought election to finish the unexpired term and election to a full term but lost in both the special election and the regular election.

StateSenatorReplaced by
Arizona Ralph H. Cameron Carl Hayden
Colorado Rice W. Means Charles W. Waterman
Illinois William B. McKinley Frank L. Smith
Kentucky Richard P. Ernst Alben W. Barkley
Maryland Ovington Weller Millard Tydings
Massachusetts William M. Butler David I. Walsh
Missouri George H. Williams Harry B. Hawes
New York James Wadsworth Robert F. Wagner
Oklahoma John W. Harreld Elmer Thomas
Oregon Robert N. Stanfield Frederick Steiwer
Pennsylvania George W. Pepper William S. Vare
Wisconsin Irvine Lenroot John J. Blaine

Death

One Republican died on August 23, 1926, and his seat remained vacant until the election.

StateSenatorReplaced by
Maine Bert M. Fernald Arthur R. Gould

Post-election changes

StateSenatorReplaced by
New Mexico Andrieus A. Jones Bronson M. Cutting
Idaho Frank R. Gooding John Thomas
Ohio Frank B. Willis Cyrus Locher
Michigan Woodbridge N. Ferris Arthur H. Vandenberg

Change in composition

Before the elections

At the beginning of 1926.

 D1D2D3D4D5D6D7D8
D18D17D16D15D14D13D12D11D10D9
D19D20D21D22D23D24D25D26D27D28
D38
N.C.
Ran
D37
La.
Ran
D36
Ga.
Ran
D35
Fla.
Ran
D34
Ark.
Ran
D33
Ala.
Retired
D32D31D30D29
D39
S.C.
Ran
FL1R56
Wisc.
Ran
R55
Wash.
Ran
R54
Vt.
Ran
R53
Utah
Ran
R52
S.D.
Ran
R51
Pa.
Ran
R50
Ore.
Ran
R49
Okla.
Ran
Majority →
R39
Ky.
Ran
R40
Maine (sp)
Ran
R41
Md.
Died
R42
Mass. (sp)
Ran
R43
Mo. (reg) &
Mo. (sp)
Ran
R44
Nev.
Ran
R45
N.H.
Ran
R46
N.Y.
Ran
R47
N.D. (sp)
Ran
N.D.
Ran
R48
Ohio
Ran
R38
Kan.
Ran
R37
Iowa (reg)
Retired
Iowa (sp)
Ran
R36
Ind. (sp)
Ran
R35
Ind.
Ran
R34
Ill.
Ran
R33
Idaho
Ran
R32
Conn.
Ran
R31
Colo.
Ran
R30
Calif.
Ran
R29
Ariz.
Ran
R19R20R21R22R23R24R25R26R27R28
R18R17R16R15R14R13R12R11R10R9
R1R2R3R4R5R6R7R8

Elections results

 D1D2D3D4D5D6D7D8
D18D17D16D15D14D13D12D11D10D9
D19D20D21D22D23D24D25D26D27D28
D38
Ky.
Gain
D37
Ga.
Re-elected
D36
Fla.
Re-elected
D35
Ark.
Re-elected
D34
Ariz.
Gain
D33
Ala.
Hold
D32D31D30D29
D39
La.
Re-elected
D40
Md.
Gain
D41
Mass. (sp)
Gain [lower-alpha 2]
D42
Mo. (reg) &
Mo. (sp)
Gain [lower-alpha 2]
D43
N.Y.
Gain
D44
N.C.
Re-elected
D45
Okla.
Gain
D46
S.C.
Re-elected
FL1R49
Wisc.
Hold
Majority →
R39
Nev.
Re-elected
R40
N.H.
Re-elected
R41
N.D. (sp)
Elected [lower-alpha 3]
N.D.
Re-elected
R42
Ohio
Re-elected
R43
Ore.
Hold
R44
Pa.
Hold [lower-alpha 4]
R45
S.D.
Re-elected
R46
Utah
Re-elected
R47
Vt.
Re-elected
R48
Wash.
Re-elected
R38
Maine (sp)
Hold
R37
Kan.
Re-elected
R36
Iowa (reg)
Hold
Iowa (sp)
Elected [lower-alpha 3]
R35
Ind. (sp)
Elected [lower-alpha 3]
R34
Ind.
Re-elected
R33
Ill.
Hold [lower-alpha 4]
R32
Idaho
Re-elected
R31
Conn.
Re-elected
R30
Colo.
Hold
R29
Calif.
Re-elected
R19R20R21R22R23R24R25R26R27R28
R18R17R16R15R14R13R12R11R10R9
R1R2R3R4R5R6R7R8

At the beginning of the next Congress

 D1D2D3D4D5D6D7D8
D18D17D16D15D14D13D12D11D10D9
D19D20D21D22D23D24D25D26D27D28
D38D37D36D35D34D33D32D31D30D29
D39D40D41D42D43D44D45D46D47
Challenged [lower-alpha 5]
FL1
Plurality ↑
R39R40R41R42R43R44R45R46V1
Ill.
Hold [lower-alpha 4]
V2
Pa.
Hold [lower-alpha 4]
R38R37R36R35R34R33R32R31R30R29
R19R20R21R22R23R24R25R26R27R28
R18R17R16R15R14R13R12R11R10R9
R1R2R3R4R5R6R7R8
Key
D# Democratic
FL# Farmer–Labor
R# Republican

Race summaries

Special elections during the 69th Congress

In these special elections, the winners were seated during 1926 or before March 4, 1927; ordered by election date.

StateIncumbentResultsCandidates
SenatorPartyElectoral history
North Dakota
(Class 3)
Gerald Nye Republican 1926 (Appointed)Interim appointee elected June 30, 1926.
Winner was also elected to the next term, see below.
  • Green check.svgY Gerald Nye (Republican-NPL) 50.2%
  • L. B. Hanna (Republican) 37.5%
  • C. P. Stone (Independent Republican) 12.3%
Maine
(Class 2)
Bert M. Fernald Republican 1916 (special)
1918
1924
Incumbent died August 23, 1926.
New senator elected September 13, 1926.
Republican hold.
Iowa
(Class 3)
David W. Stewart Republican 1926 (Appointed)Interim appointee elected November 2, 1926.
Winner did not seek election to the next term, see below.
Indiana
(Class 1)
Arthur Raymond Robinson Republican 1925 (Appointed)Interim appointee elected November 2, 1926.
Massachusetts
(Class 1)
William M. Butler Republican 1924 (Appointed)Interim appointee lost election.
New senator elected November 2, 1926.
Democratic gain.
Missouri
(Class 3)
George H. Williams Republican 1925 (Appointed)Interim appointee lost election.
New senator elected November 2, 1926.
Democratic gain.
Winner also elected to the next term, see below.

Elections leading to the 70th Congress

In these general elections, the winners were elected for the term beginning March 4, 1927; ordered by state.

All of the elections involved the Class 3 seats.

StateIncumbentResultsCandidates
SenatorPartyElectoral history
Alabama Oscar Underwood Democratic 1914
1920
Incumbent retired.
New senator elected.
Democratic hold.
Arizona Ralph H. Cameron Republican 1920 Incumbent lost re-election.
New senator elected.
Democratic gain.
Arkansas Thaddeus H. Caraway Democratic 1920 Incumbent re-elected.
California Samuel M. Shortridge Republican 1920 Incumbent re-elected.
Colorado Rice W. Means Republican 1924 (special) Incumbent lost renomination.
New senator elected.
Republican hold.
Connecticut Hiram Bingham III Republican 1924 (special) Incumbent re-elected.
Florida Duncan U. Fletcher Democratic 1908
1914
1920
Incumbent re-elected.
Georgia Walter F. George Democratic 1922 (special) Incumbent re-elected.
Idaho Frank R. Gooding Republican 1920 Incumbent re-elected.
Illinois William B. McKinley Republican 1920 Incumbent lost renomination, then died.
New senator elected.
Winner appointed to finish term, but was not seated for either appointment or for next term. [lower-alpha 6]
Republican hold, although the Senate did not consider the winner to be a senator.
Indiana James E. Watson Republican 1916 (special)
1920
Incumbent re-elected.
Iowa David W. Stewart Republican1926 (Appointed)Interim appointee retired.
New senator elected.
Republican hold.
Winner did not run to finish the term, see above.
Kansas Charles Curtis Republican 1914
1920
Incumbent re-elected.
Kentucky Richard P. Ernst Republican 1920 Incumbent lost re-election.
New senator elected.
Democratic gain.
Louisiana Edwin S. Broussard Democratic 1920 Incumbent re-elected.
Maryland Ovington Weller Republican 1920 Incumbent lost re-election.
New senator elected.
Democratic gain.
Missouri George H. Williams Republican1925 (Appointed)Incumbent appointee lost election. Winner also elected to finish the current term; see above.
New senator elected.
Democratic gain.
Nevada Tasker Oddie Republican 1920 Incumbent re-elected.
New Hampshire George H. Moses Republican 1918 (special)
1920
Incumbent re-elected.
New York James Wadsworth Republican 1914
1920
Incumbent lost re-election.
New senator elected.
Democratic gain.
North Carolina Lee S. Overman Democratic 1903
1909
1914
1920
Incumbent re-elected.
North Dakota Gerald Nye Republican1925 (Appointed)
1926 (special)
Incumbent re-elected.
Ohio Frank B. Willis Republican 1920 Incumbent re-elected.
Oklahoma John W. Harreld Republican 1920 Incumbent lost re-election.
New senator elected.
Democratic gain.
Oregon Robert N. Stanfield Republican 1920 Incumbent lost renomination, then ran as an Independent but lost re-election.
New senator elected.
Republican hold.
Pennsylvania George W. Pepper Republican1922 (Appointed)
1922 (special)
Incumbent lost renomination.
New senator elected.
Senate refused to qualify winner due to charges of corruption and fraud concerning the election.
Republican hold, but the Senate would later unseat the winner and declare the seat vacant.
South Carolina Ellison D. Smith Democratic 1908
1914
1920
Incumbent re-elected.
South Dakota Peter Norbeck Republican 1920 Incumbent re-elected.
Utah Reed Smoot Republican 1903
1909
1914
1920
Incumbent re-elected.
Vermont Porter H. Dale Republican 1923 (special) Incumbent re-elected.
  • Green check.svgY Porter H. Dale (Republican), 73.4%
  • James E. Kennedy (Democratic) 26.5%
Washington Wesley L. Jones Republican 1909
1914
1920
Incumbent re-elected.
Wisconsin Irvine Lenroot Republican 1920 Incumbent lost renomination.
New senator elected.
Republican hold.

Closest races

Twelve races had a margin of victory under 10%:

StateParty of winnerMargin
Indiana (regular) Republican1.1%
Indiana (special) Republican2.2%
Oregon Republican3.5% [lower-alpha 7]
Missouri Democratic (flip)3.6%
Kentucky Democratic (flip)3.6%
Illinois Republican3.8%
Colorado Republican3.9%
New York Democratic (flip)4.1%
Missouri Democratic (flip)4.2%
Washington Republican4.8%
Massachusetts Democratic (flip)5.5%
Ohio Republican6.6%

Alabama

Alabama election
Flag of Alabama.svg
  1920
1932  
  HugoLaFayetteBlack.jpg 3x4.svg
Nominee Hugo Black Edmund H. Dryer
Party Democratic Republican
Popular vote91,80121,712
Percentage80.87%19.13%

U.S. senator before election

Oscar Underwood
Democratic

Elected U.S. senator

Hugo Black
Democratic

Alabama election [1]
PartyCandidateVotes%
Democratic Hugo Black (Incumbent) 91,801 80.87%
Republican Edmund H. Dryer21,71219.13%
Majority70,08961.74%
Turnout 113,513
Democratic hold

Arizona

1926 United States Senate election in Arizona
Flag of Arizona.svg
  1920 November 3, 1926 1932  
  Carl T. Hayden.jpg Senator Ralph Cameron.jpg
Nominee Carl Hayden Ralph H. Cameron
Party Democratic Republican
Popular vote44,59131,845
Percentage58.34%41.66%

1926 United States Senate election in Arizona results map by county.svg
County results
Hayden:     50–60%     60–70%     70–80%
Cameron:     50–60%

U.S. senator before election

Ralph H. Cameron
Republican

Elected U.S. Senator

Carl Hayden
Democratic

Arizona election [1]
PartyCandidateVotes%
Democratic Carl Hayden 44,951 58.53%
Republican Ralph H. Cameron (Incumbent)31,84541.47%
Majority13,10617.06%
Turnout 76,796
Democratic gain from Republican

Arkansas

Arkansas election
Flag of Arkansas (1924-2011).svg
  1920
1932  
  CARAWAY, T.H. SENATOR LCCN2016862600.jpg 3x4.svg
Nominee Thaddeus H. Caraway Robert A. Jones
Party Democratic Republican
Popular vote28,1665,048
Percentage84.80%15.20%

U.S. senator before election

Thaddeus H. Caraway
Democratic

Elected U.S. senator

Thaddeus H. Caraway
Democratic

Arkansas election [1]
PartyCandidateVotes%
Democratic Thaddeus H. Caraway (Incumbent) 28,166 84.80%
Republican Robert A. Jones5,04815.20%
Majority23,11869.60%
Turnout 33,214
Democratic hold

California

1926 United States Senate election in California
Flag of California (1924-1953).png
  1920 November 2, 1926 1932  
  Samuel Morgan Shortridge.jpg John B. Elliott.jpg
Nominee Samuel Morgan Shortridge John B. Elliott
Party Republican Democratic
Popular vote670,128391,599
Percentage63.12%36.88%

1926 United States Senate election in California results map by county.svg
County results
Shortridge:     50-60%     60-70%     70-80%     80–90%     >90%

U.S. senator before election

Samuel Morgan Shortridge
Republican

Elected U.S. Senator

Samuel Morgan Shortridge
Republican

California election [1]
PartyCandidateVotes%
Republican Samuel M. Shortridge (Incumbent) 670,128 63.11%
Democratic John B. Elliott391,59936.88%
NoneScattering1270.01%
Majority278,52926.23%
Turnout 1,061,854
Republican hold

Colorado

1926 United States Senate election in Colorado
Flag of Colorado.svg
  1924 (special) November 2, 1926 1932  
  Chas. W. Waterman of Denver, Col., (1-27-25) LCCN2016849970 (cropped).jpg William Sweet.gif
Nominee Charles W. Waterman William Ellery Sweet
Party Republican Democratic
Popular vote149,585138,113
Percentage50.25%46.39%

1926 Colorado Senate election results map by county.svg
Results by county
Waterman:      40–50%     50–60%     60–70%
Sweet:     40–50%     50–60%     60–70%

U.S. senator before election

Rice W. Means
Republican

Elected U.S. Senator

Charles W. Waterman
Republican

Colorado election [1]
PartyCandidateVotes%
Republican Charles W. Waterman 149,585 50.25%
Democratic William E. Sweet 138,11346.39%
Farmer–Labor Morton Alexander5,8291.96%
Socialist Frank H. Rice2,2180.75%
Peoples Constitutional RightsJames A. Ownbey1,0910.37%
Workers (Communist) James A. Ayres8590.29%
Majority11,4723.86%
Turnout 297,695
Republican hold

Connecticut

1926 United States Senate election in Connecticut
Flag of Connecticut.svg
  1924 (special) November 2, 1926 1932  
  Senator Hiram Bingham of Conn., (1-9-25) LCCN2016839105 (3x4a).jpg Rollin U. Tyler (3x4a).jpg
Nominee Hiram Bingham III Rollin Tyler
Party Republican Democratic
Popular vote191,401107,753
Percentage63.31%35.64%

1926 United States Senate election in Connecticut results map by county.svg
County results
Bingham:     50–60%     60–70%

U.S. senator before election

Hiram Bingham III
Republican

Elected U.S. Senator

Hiram Bingham III
Republican

Connecticut election [1]
PartyCandidateVotes%
Republican Hiram Bingham III (Incumbent) 191,401 63.31%
Democratic Rollin U. Tyler107,75335.64%
Independent Rice3,1731.05%
Majority83,64827.67%
Turnout 302,327
Republican hold

Florida

Florida election
Flag of Florida (1900-1985).svg
  1920
1932  
  Duncanupshawfletcher.jpg 3x4.svg3x4.svg
Nominee Duncan U. Fletcher John M. LindsayW. R. O’Neal
Party Democratic Republican Republican
Popular vote51,0548,3816,133
Percentage77.86%12.78%9.35%

U.S. senator before election

Duncan U. Fletcher
Democratic

Elected U.S. senator

Duncan U. Fletcher
Democratic

Florida election [1]
PartyCandidateVotes%
Democratic Duncan U. Fletcher (Incumbent) 51,054 77.86%
Republican John M. Lindsay (delegate convention)8,38112.78%
Republican W. R. O’Neal6,1339.35%
Majority42,67365.08%
Turnout 65,568
Democratic hold

Georgia

Georgia election
Flag of the State of Georgia (1920-1956).svg
1932  
  Sen. Walter F. George (cropped).jpg
Nominee Walter F. George
Party Democratic
Popular vote47,366
Percentage100.00%

U.S. senator before election

Walter F. George
Democratic

Elected U.S. senator

Walter F. George
Democratic

Georgia election [1]
PartyCandidateVotes%
Democratic Walter F. George (Incumbent) 47,366 100.00%
Democratic hold

Idaho

Idaho election
Flag of Idaho (1907-1927).png
  1920
1932  
  Frankgooding.jpg H. F. Samuels (1869-1948).png Johnnugent.jpg
Nominee Frank R. Gooding H. F. Samuels John F. Nugent
Party Republican Progressive Democratic
Popular vote56,84737,04731,285
Percentage45.41%29.60%24.99%

U.S. senator before election

Frank R. Gooding
Republican

Elected U.S. senator

Frank R. Gooding
Republican

Idaho election [1]
PartyCandidateVotes%
Republican Frank R. Gooding (Incumbent) 56,847 45.41%
Progressive H. F. Samuels 37,04729.60%
Democratic John F. Nugent 31,28524.99%
Majority19,80015.81%
Turnout 125,179
Republican hold

Illinois

1926 United States Senate election in Illinois
Flag of Illinois (1915-1969).svg
  1920 November 2, 1926 1928 (special)  
  Frank L. Smith (1).jpg Geo. E. Brennan LCCN2014719231 (3x4c).jpg Hugh S. McGill.png
Nominee Frank L. Smith George E. Brennan Hugh S. McGill
Party Republican Democratic Independent
Popular vote842,273774,943156,245
Percentage46.86%43.12%8.69%

1926 United States Senate election in Illinois results map by county.svg
Results by county
Smith:     30–40%     40–50%     50–60%     60–70%     70–80%
Brennan:     40–50%     50–60%     60–70%

U.S. senator before election

William B. McKinley
Republican

Elected U.S. senator

Frank L. Smith [lower-alpha 6]
Republican

Illinois election [1]
PartyCandidateVotes%
Republican Frank L. Smith 842,273 46.86%
Democratic George E. Brennan 774,94343.12%
Independent Hugh S. Magill156,2458.69%
Progressive Parley P. Christensen 6,5260.36%
Light Wines and BeerRaymond T. O’Keefe4,5960.26%
Independent Democratic James H. Kirby4,2030.23%
Socialist John T. Whitlock2,9980.17%
Socialist Labor G. A. Jenning1,9770.11%
Workers (Communist) J. Louis Engdahl 1,3090.07%
High LifeJames A. Logan1,1610.06%
Independent Samuel C. Irving7010.04%
Commonwealth Land Morris Lynchenheim4270.02%
Majority67,3303.74%
Turnout 1,797,359
Republican hold

Indiana

There were 2 elections in Indiana due to the October 14, 1925, death of Democrat Samuel M. Ralston.

Indiana (special)

1926 United States Senate special election in Indiana
Flag of Indiana.svg
  1922 November 2, 1926 1928  
  Arthur Raymond Robinson circa 1920.jpg WOOLEN, EVANS LCCN2016861173 (cropped).jpg
Nominee Arthur Robinson Evans Woollen
Party Republican Democratic
Popular vote519,401496,540
Percentage50.62%48.40%

1926 United States Senate Special Election in Indiana by County.svg
County results
Robinson:      40–50%     50–60%     60–70%     70–80%
Woollen:      40–50%     50–60%     60–70%

U.S. senator before election

Arthur Raymond Robinson
Republican

Elected U.S. Senator

Arthur Raymond Robinson
Republican

Republican Arthur Raymond Robinson was appointed to continue Ralston's term, pending the special election, which he then won.

Indiana special election [1]
PartyCandidateVotes%
Republican Arthur Raymond Robinson (Incumbent) 519,401 50.62%
Democratic Evans Woollen 496,54048.40%
Prohibition Albert Stanley5,2050.51%
Socialist William O. Fogleson4,8640.47%
Majority22,8612.22%
Turnout 1,026,010
Republican hold

Indiana (regular)

1926 United States Senate election in Indiana
Flag of Indiana.svg
  1920 November 2, 1926 1932  
  James Eli Watson.jpg 3x4.svg
Nominee James E. Watson Albert Stump
Party Republican Democratic
Popular vote522,837511,454
Percentage50.04%48.95%

1926 United States Senate Election in Indiana by County.svg
County results
Watson:      40–50%     50–60%     60–70%     70–80%
Stump:      40–50%     50–60%     60–70%

U.S. senator before election

James E. Watson
Republican

Elected U.S. Senator

James E. Watson
Republican

Indiana general election [1]
PartyCandidateVotes%
Republican James E. Watson (Incumbent) 522,837 50.04%
Democratic Albert Stump511,45448.95%
Prohibition William H. Harris5,4200.52%
Socialist Forrest Wallace5,1060.49%
Majority11,3831.09%
Turnout 1,044,817
Republican hold

Iowa

Iowa (special)

Iowa special election
Flag of Iowa.svg
  1920
1926  
  David Wallace Stewart.jpg
Nominee David W. Stewart
Party Republican
Popular vote336,410
Percentage100.00%

1926 United States Senate Special Election in Iowa by County.svg
County Results
Stewart:     90–100%

U.S. senator before election

David W. Stewart
Republican

Elected U.S. senator

David W. Stewart
Republican

Iowa special election [1]
PartyCandidateVotes%
Republican David W. Stewart (Incumbent) 336,410 100.00%
Republican hold

Iowa (regular)

Iowa election
Flag of Iowa.svg
1932  
  Smith Wildman Brookhart.jpg ClaudeRPorter.jpg
Nominee Smith W. Brookhart Claude R. Porter
Party Republican Democratic
Popular vote323,409247,869
Percentage56.61%43.39%

1926 United States Senate Election in Iowa by County.svg
County results
Brookhart:      50–60%     60–70%     70–80%     80–90%
Porter:      50–60%     60–70%

U.S. senator before election

David W. Stewart
Republican

Elected U.S. senator

Smith W. Brookhart
Republican

Iowa election [1]
PartyCandidateVotes%
Republican Smith W. Brookhart 323,409 56.61%
Democratic Claude R. Porter 247,86943.39%
Majority75,54013.22%
Turnout 571,278
Republican hold

Kansas

Kansas election
Flag of Kansas (1925-1927).svg
  1920
  Charles Curtis-portrait.jpg 3x4.svg
Nominee Charles Curtis Charles Stephens
Party Republican Democratic
Popular vote308,222168,446
Percentage63.57%34.74%

U.S. senator before election

Charles Curtis
Republican

Elected U.S. senator

Charles Curtis
Republican

Kansas election [1]
PartyCandidateVotes%
Republican Charles Curtis (Incumbent) 308,222 63.57%
Democratic Charles Stephens168,44634.74%
Socialist M. L. Phillips8,2081.69%
Majority139,77628.83%
Turnout 484,876
Republican hold

Kentucky

Kentucky election
Flag of Kentucky (1918-1963).svg
  1920
1932  
  AlbenBarkley.jpg Richard Pretlow Ernst.jpg
Nominee Alben W. Barkley Richard P. Ernst
Party Democratic Republican
Popular vote286,997266,657
Percentage51.84%48.16%

1926 United States Senate election in Kentucky results map by county.svg
County results
Barkley:      50–60%     60–70%     70–80%     80–90%
Ernst:      50–60%     60–70%     70–80%     80–90%     >90%

U.S. senator before election

Richard P. Ernst
Republican

Elected U.S. senator

Alben W. Barkley
Democratic

Kentucky election [1]
PartyCandidateVotes%
Democratic Alben W. Barkley 286,997 51.84%
Republican Richard P. Ernst (Incumbent)266,65748.16%
Majority20,3403.68%
Turnout 553,654
Democratic gain from Republican

Louisiana

Louisiana election
Flag of Louisiana (1912-2006).svg
  1920
1932  
  EdwinSBroussard.jpg
Nominee Edwin S. Broussard
Party Democratic
Popular vote54,180
Percentage100.0%

U.S. senator before election

Edwin S. Broussard
Democratic

Elected U.S. senator

Edwin S. Broussard
Democratic

Louisiana election [1]
PartyCandidateVotes%
Democratic Edwin S. Broussard (Incumbent) 54,180 100.00%
Democratic hold

Maine (special)

Maine special election
Flag of Maine.svg
  1924 September 13, 1926 1930  
  Arthur Robinson Gould.jpg 3x4.svg
Nominee Arthur R. Gould Fulton J. Redman
Party Republican Democratic
Popular vote79,49831,225
Percentage71.8%28.2%

U.S. senator before election

Vacant

Elected U.S. senator

Arthur R. Gould
Republican

Maine special election [1]
PartyCandidateVotes%
Republican Arthur R. Gould 79,498 71.80%
Democratic Fulton J. Redman 31,22528.20%
Majority43.60%
Turnout 110,723
Republican hold

Maryland

1926 United States Senate election in Maryland
Flag of Maryland.svg
  1920 November 2, 1926 1932  
  Millardetydings.jpg Ovington Weller, photo portrait, facing left.jpg
Nominee Millard Tydings Ovington Weller
Party Democratic Republican
Popular vote195,410140,695
Percentage57.51%41.41%

1926 United States Senate election in Maryland results map by county.svg
County results
Weller:     50–60%     60–70%
Tydings:     50–60%     60–70%     70–80%

U.S. senator before election

Ovington Weller
Republican

Elected U.S. Senator

Millard Tydings
Democratic

Maryland election [1]
PartyCandidateVotes%
Democratic Millard Tydings 195,410 57.51%
Republican Ovington Weller (Incumbent)140,69541.41%
Socialist William A. Toole3,6591.08%
Majority54,71516.10%
Turnout 339,764
Democratic gain from Republican

Massachusetts (special)

1926 United States Senate special election in Massachusetts
Flag of Massachusetts (1908-1971).svg
  1922 November 2, 1926 1928  
  David Ignatius Walsh.jpg W.M. Butler LCCN2014716609.jpg
Nominee David I. Walsh William M. Butler
Party Democratic Republican
Popular vote525,303469,989
Percentage52.01%46.54%

1926 United States Senate Election in Massachusetts by County.svg
County results
Walsh:      50–60%     60–70%
Butler:      50–60%     60–70%     70–80%

U.S. senator before election

William M. Butler
Republican

Elected U.S. senator

David I. Walsh
Democratic

Massachusetts special election [1]
PartyCandidateVotes%
Democratic David I. Walsh 525,303 52.01%
Republican William M. Butler (Incumbent)469,98946.54%
Workers John J. Ballam 5,1670.51%
Modification Volstead Act Washington Cook 4,7660.47%
Socialist Alfred Baker Lewis 4,7300.47%
NoneScattering110.00%
Majority55,3145.47%
Turnout 1,009,966
Democratic gain from Republican

Missouri

There were 2 elections on the same day for the same seat, due to the May 16, 1925, death of Republican Selden P. Spencer.

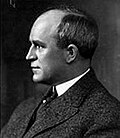
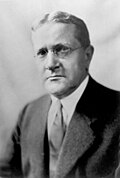
Republican George H. Williams was appointed May 25, 1925, to continue the term, epending a special election. Williams ran in both the special election to finish the term and the regular election to the next term, but lost both races to Democrat Harry B. Hawes.

Missouri (special)

1926 United States Senate special election in Missouri
Flag of Missouri.svg
  1920
  Harry Bartow Hawes.jpg Senator George Howard Williams.JPG
Nominee Harry B. Hawes George Howard Williams
Party Democratic Republican
Popular vote514,389473,068
Percentage52.09%47.91%

1926 United States Senate special election in Missouri results map by county.svg
County results
Hawes:      50–60%     60–70%     70–80%     80–90%
Williams:      50–60%     60–70%     70–80%

U.S. senator before election

George Howard Williams
Republican

Elected U.S. senator

Harry B. Hawes
Democratic

Missouri special election [1]
PartyCandidateVotes%
Democratic Harry B. Hawes 514,389 52.09%
Republican George H. Williams (Incumbent)473,06847.91%
Majority41,3214.18%
Turnout 987,457
Democratic gain from Republican

Missouri (regular)

1926 United States Senate election in Missouri
Flag of Missouri.svg
1932  
  Harry Bartow Hawes.jpg Senator George Howard Williams.JPG
Nominee Harry B. Hawes George Howard Williams
Party Democratic Republican
Popular vote506,015470,654
Percentage51.30%47.71%

1926 United States Senate election in Missouri results map by county.svg
County results
Hawes:      40–50%     50–60%     60–70%     70–80%     80–90%
Williams:      40–50%     50–60%     60–70%     70–80%

U.S. senator before election

George Howard Williams
Republican

Elected U.S. senator

Harry B. Hawes
Democratic

Missouri general election [1]
PartyCandidateVotes%
Democratic Harry B. Hawes 506,015 51.30%
Republican George H. Williams (Incumbent)470,65447.71%
Prohibition Herman P. Faris 7,5400.76%
Socialist Robert D. Morrison1,8070.18%
Socialist Labor William Wesley Cox 4640.05%
Majority35,3613.29%
Turnout 986,480
Democratic gain from Republican

Nevada

Nevada election
Flag of Nevada (1915-1929).png
  1920
1932  
  Senator Tasker Oddie.jpg BAKER, RAY LCCN2016859478.jpg
Nominee Tasker Oddie Raymond T. Baker
Party Republican Democratic
Popular vote17,43013,273
Percentage55.8%42.5%

1926 United States Senate election in Nevada results map by county.svg
Results by county
Oddie:     50–60%     60–70%     70–80%
Baker:     50–60%

U.S. senator before election

Tasker Oddie
Republican

Elected U.S. senator

Tasker Oddie
Republican

Nevada election [1]
PartyCandidateVotes%
Republican Tasker Oddie (Incumbent) 17,430 55.78%
Democratic Raymond T. Baker 13,27342.48%
Independent George A. Bice5431.74%
Majority415713.30%
Turnout 31,246
Republican hold

New Hampshire

New Hampshire election
Flag of New Hampshire (1909-1931).png
  1920
1932  
  GeorgeHMoses.jpg 3x4.svg
Nominee George H. Moses Robert C. Murchie
Party Republican Democratic
Popular vote79,27947,935
Percentage62.3%37.7%

U.S. senator before election

George H. Moses
Republican

Elected U.S. senator

George H. Moses
Republican

New Hampshire election [1]
PartyCandidateVotes%
Republican George H. Moses (Incumbent) 79,279 62.32%
Democratic Robert C. Murchie47,93537.68%
Majority24.64%
Turnout 127,214
Republican hold

New York

1926 United States Senate election in New York
Flag of New York (1909-2020).svg
  1920 November 2, 1926 1932  
  WAGNER, ROBERT. SENATOR LCCN2016862639 (croppedmore).jpg James W. Wadsworth, Jr.jpg Franklin W. Cristman Crop.png
Nominee Robert F. Wagner James W. Wadsworth Franklin W. Cristman
Party Democratic Republican Independent Republican
Alliance Prohibition
Popular vote1,321,4631,205,246231,906
Percentage46.48%42.40%8.16%

1926 United States Senate Election in New York by County.svg
County Results
Wagner:     50–60%     60–70%
Wadsworth:     30–40%     40–50%     50–60%     60–70%

Senator before election

James W. Wadsworth
Republican

Elected Senator

Robert F. Wagner
Democratic

New York election [1]
PartyCandidateVotes%
Democratic Robert F. Wagner 1,321,463 46.48%
Republican James W. Wadsworth Jr. (Incumbent)1,205,24642.40%
Independent Republican Franklin W. Cristman 231,9068.16%
Socialist Jessie W. Hughan 73,4122.58%
Workers William F. Dunne 6,4440.23%
Socialist Labor Joseph Brandon4,3420.15%
Majority116,2174.08%
Turnout 2,842,813
Democratic gain from Republican

North Carolina

North Carolina election
Flag of North Carolina (1885-1991).svg
  1920
  OVERMAN, LEE S. SENATOR LCCN2016862467 (cropped).jpg 3x4.svg
Nominee Lee S. Overman Johnson J. Hayes
Party Democratic Republican
Popular vote218,934142,891
Percentage60.5%39.5%

U.S. senator before election

Lee S. Overman
Democratic

Elected U.S. senator

Lee S. Overman
Democratic

North Carolina election [1]
PartyCandidateVotes%
Democratic Lee Slater Overman (Incumbent) 218,934 60.51%
Republican Johnson J. Hayes 142,89139.49%
Majority76,04321.02%
Turnout 361,825
Democratic hold

North Dakota

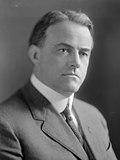
There were two elections due to the June 22, 1925, death of one-term Republican Edwin F. Ladd. Republican Gerald Nye was appointed November 14, 1925, to continue the term, pending a special election. Nye later won the June 1926 special election to finish the term and the November 1926 general election to the next term.

North Dakota (special)

1926 United States Senate special election in North Dakota
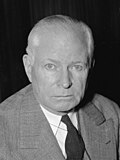
Flag of North Dakota.svg
  1920 June 30, 1926 1926 (regular)  
  Senator G.P. Nye of N.D., (12-1-25) LCCN2016841488 (3x4a).jpg LouisBHanna.jpg 3x4.svg
Nominee Gerald Nye L. B. Hanna C. P. Stone
Party Nonpartisan League Republican Independent Republican
Alliance Democratic
Popular vote79,70959,49919,586
Percentage50.19%37.46%12.33%

1926 US Senate special election in North Dakota results.svg
County results
Nye:     40-50%     50-60%     60-70%     70-80%
Hanna:     40-50%     50-60%

U.S. senator before election

Gerald Nye
Republican

Elected U.S. Senator

Gerald Nye
Republican

Nye was elected on the Nonpartisan League ticket, but served as a Republican.

North Dakota special election, June 30, 1926 [2]
PartyCandidateVotes%
Nonpartisan League Gerald Nye (Incumbent) 79,709 50.20%
Republican Louis B. Hanna 59,49937.47%
Independent Republican C. P. Stone19,58612.33%
Majority88,97057.36%
Turnout 24.55%
Non-Partisan League hold

North Dakota (regular)

1926 United States Senate election in North Dakota
Flag of North Dakota.svg
  1926 (special) November 2, 1926 1932  
  Senator G.P. Nye of N.D., (12-1-25) LCCN2016841488 (3x4a).jpg 3x4.svg
Nominee Gerald Nye Norris H. Nelson
Party Republican Independent Republican
Popular vote107,92118,951
Percentage69.58%12.22%

 
NomineeF. F. BurchardC. P. Stone
Party Democratic Independent Republican
Popular vote13,5199,738
Percentage8.72%6.28%

1926 United States senate election in North Dakota results.svg
County results
Nye:      50-60%     60-70%     70-80%     80-90%

U.S. senator before election

Gerald Nye
Republican

Elected U.S. Senator

Gerald Nye
Republican

North Dakota regular election, November 2, 1926 [1] [3]
PartyCandidateVotes%
Republican Gerald Nye (Incumbent) 107,921 69.58%
Independent Norris H. Nelson18,95112.22%
Democratic F. F. Burchard13,5198.72%
Independent C. P. Stone9,7386.28%
Independent William Lemke 4,9773.21%
Majority88,97057.36%
Turnout 155,106
Republican hold

Ohio

Ohio election
Flag of Ohio.svg
  1920
  Frank B Willis 2.jpg Atlee Pomerene LCCN2014685598.jpg
Nominee Frank B. Willis Atlee Pomerene
Party Republican Democratic
Popular vote711,359623,221
Percentage53.2%46.6%

U.S. senator before election

Frank B. Willis
Republican

Elected U.S. senator

Frank B. Willis
Republican

Ohio election [1]
PartyCandidateVotes%
Republican Frank B. Willis (Incumbent) 711,359 53.19%
Democratic Atlee Pomerene 623,22146.60%
Socialist Labor Goerke2,8460.21%
Majority88,1386.59%
Turnout 1,337,426
Republican hold

Oklahoma

Oklahoma election
Flag of Oklahoma (1925-1941).svg
  1920
1932  
  Oklahoma Senator. Washington, D.C., April 19, 1939 A new informal picture of Senator Elmer Thomas, Democrat of Oklahoma LCCN2016875466 (cropped).jpg HARRELD, J.W. SENATOR LCCN2016860665 (cropped).jpg
Nominee Elmer Thomas John W. Harreld
Party Democratic Republican
Popular vote195,587155,829
Percentage55.4%44.1%

U.S. senator before election

John W. Harreld
Republican

Elected U.S. senator

Elmer Thomas
Democratic

Oklahoma election [1]
PartyCandidateVotes%
Democratic Elmer Thomas 195,587 55.35%
Republican John W. Harreld (Incumbent)155,82944.10%
Socialist J. A. Hart1,0090.29%
Farmer–Labor J. Edwin Spurr7810.22%
Independent Thomas P. Hopley1430.04%
Majority39,75811.25%
Turnout 353,349
Democratic gain from Republican

Oregon

Oregon election
Flag of Oregon.svg
  1920
1932  
  Fredericksteiwer.jpg Bert E. Haney.jpg Robert Nelson Stanfield.jpg
Nominee Frederick Steiwer Bert E. Haney Robert N. Stanfield
Party Republican Democratic Independent
Popular vote89,00781,30150,246
Percentage39.8%36.3%22.5%

U.S. senator before election

Robert N. Stanfield
Republican

Elected U.S. senator

Frederick Steiwer
Republican

Oregon election [1]
PartyCandidateVotes%
Republican Frederick Steiwer 89,007 39.79%
Democratic Bert E. Haney 81,30136.34%
Independent Robert N. Stanfield (Incumbent)50,24622.46%
Independent W. P. Adams3,1451.41%
Majority7,7063.45%
Turnout 223,699
Republican gain from Independent

Pennsylvania

1926 United States Senate election in Pennsylvania
Flag of Pennsylvania.svg
  1922 (special) November 2, 1926 1930 (special)  
  VARE, WILLIAM S. HONORABLE LCCN2016858323 (cropped).jpg Wilson-William-Bauchop-130313.jpg
Nominee William Scott Vare William Bauchop Wilson
Party Republican Democratic
Popular vote822,187648,680
Percentage54.64%43.11%

1926 United States Senate election in Pennsylvania results map by county.svg
County results
Vare:     40–50%     50–60%     60–70%     70–80%
Wilson:     40–50%     50–60%     60–70%     70–80%

U.S. senator before election

George W. Pepper
Republican

Elected U.S. Senator

William Scott Vare [lower-alpha 8]
Republican

General election results [1]
PartyCandidateVotes%
Republican William Scott Vare 882,187 54.64%
Democratic William Bauchop Wilson 648,68043.11%
Prohibition Elisha Kent Kane19,5231.30%
Socialist George W. Snyder9,8690.66%
Workers A. J. Carey3,0940.21%
Commonwealth Land Robert C. Macauly1,0530.07%
NoneScattering2900.02%
Majority173,50711.53%
Turnout 1,504,696
Republican hold

South Carolina

South Carolina election
Flag of South Carolina.svg
  1920
1932  
  Senator Ellison DuRant Smith.jpg
Nominee Ellison D. Smith
Party Democratic
Popular vote14,560
Percentage100.0%

U.S. senator before election

Ellison D. Smith
Democratic

Elected U.S. senator

Ellison D. Smith
Democratic

South Carolina U.S. Senate Election, 1926
PartyCandidateVotes%
Democratic Ellison D. Smith (Incumbent) 14,560 100.00%
Democratic hold

South Dakota

1926 United States Senate election in South Dakota
Flag of South Dakota (1909-1963).svg
  1920 November 2, 1926 1932  
  NORBECK, P. SENATOR LCCN2016860878 (cropped).jpg No image.svg No image.svg
Nominee Peter Norbeck Charles J. GundersonHoward Platt
Party Republican Democratic Farmer–Labor
Popular vote105,75659,12812,797
Percentage59.52%33.28%7.20%

1926 United States Senate election in South Dakota results map by county.svg
County results
Norbeck:     40–50%     50–60%     60–70%     70–80%     80–90%
Gunderson:     40–50%
No Vote:     

U.S. senator before election

Peter Norbeck
Republican

Elected U.S. Senator

Peter Norbeck
Republican

South Dakota election [1]
PartyCandidateVotes%
Republican Peter Norbeck (Incumbent) 105,619 59.57%
Democratic C. J. Gunderson59,09433.33%
Farmer–Labor Howard Platt12,5847.10%
Majority46,52526.24%
Turnout 177,297
Republican hold

Utah

Utah election
Flag of Utah (1922-2011).svg
  1920
1932  
  Reed Smoot, bw photo portrait, Bain News Service.jpg 3x4.svg
Nominee Reed Smoot Ashby Snow
Party Republican Democratic
Popular vote88,10153,809
Percentage61.5%37.6%

U.S. senator before election

Reed Smoot
Republican

Elected U.S. senator

Reed Smoot
Republican

Utah election [1]
PartyCandidateVotes%
Republican Reed Smoot (Incumbent) 88,101 61.51%
Democratic Ashby Snow53,80937.57%
Socialist C. T. Stoney1,3100.91%
Majority34,29223.94%
Turnout 143,220
Republican hold

Vermont

Vermont election
Flag of Vermont.svg
1932  
  Porter H. Dale, Vermont LOC npcc.04307 (cropped).jpg 3x4.svg
Nominee Porter H. Dale James E. Kennedy
Party Republican Democratic
Popular vote52,28618,890
Percentage73.4%26.5%

U.S. senator before election

Porter H. Dale
Republican

Elected U.S. senator

Porter H. Dale
Republican

1926 United States Senate election in Vermont [1]
PartyCandidateVotes%
Republican Porter H. Dale (Incumbent) 52,286 73.41%
Democratic James E. Kennedy18,89026.52%
NoneScattering520.07%
Majority33,39646.89%
Total votes71,228 100.00%
Republican hold

Washington

1926 United States Senate election in Washington
Flag of Washington.svg
  1920 November 2, 1926 1932  
  Portrait of Wesley L Jones, ca 1920s (PORTRAITS 727).jpg Alexander Scott Bullitt circa 1915.jpg
Nominee Wesley L. Jones A. Scott Bullitt
Party Republican Democratic
Popular vote164,130148,783
Percentage51.31%46.52%

1926 United States Senate election in Washington results map by county.svg
Results by county
Jones:     40–50%     50–60%     60–70%     70–80%
Bullitt:     50–60%

U.S. senator before election

Wesley Livsey Jones
Republican

Elected U.S. Senator

Wesley Livsey Jones
Republican

Washington election [1]
PartyCandidateVotes%
Republican Wesley Livsey Jones (Incumbent) 164,130 51.31%
Democratic A. Scott Bullitt148,78346.51%
Socialist Labor David Burgess3,5131.10%
Farmer–Labor J. L. Freeman3,4371.07%
Majority15,3474.80%
Turnout 319,863
Republican hold

Wisconsin

Wisconsin election
Flag of Wisconsin (1913-1981).svg
  1920
1932  
  John J. Blaine.jpg Charles D. Rosa.png
Nominee John J. Blaine Charles D. Rosa
Party Republican Independent Progressive
Popular vote299,759111,122
Percentage54.9%20.4%

  Leo Krzycki.jpg
NomineeThomas M. Kearney Leo Krzycki
Party Democratic Socialist
Popular vote66,67231,317
Percentage12.2%5.7%

U.S. senator before election

Irvine Lenroot
Republican

Elected U.S. senator

John J. Blaine
Republican

Wisconsin election [1]
PartyCandidateVotes%
Republican John J. Blaine 299,759 54.92%
Independent Progressive Charles D. Rosa 111,12220.36%
Democratic Thomas M. Kearney66,67212.22%
Socialist Leo Krzycki 31,3175.74%
Independent J. N. Tittemore23,8224.36%
Prohibition Ella T. Sanford9,8851.81%
Independent Richard Koeppel3,0610.56%
NoneScattering1300.02%
Majority188,63734.56%
Turnout 545,768
Republican hold

See also

Notes

  1. There were also special elections in June, September, and November 1926.
  2. 1 2 Appointee defeated
  3. 1 2 3 Appointee elected
  4. 1 2 3 4 Senate refused to qualify
  5. Democrat Daniel F. Steck successfully challenged the 1924 election of Republican Smith W. Brookhart and the Senate awarded Steck the seat on April 12, 1926.
  6. 1 2 Frank L. Smith defeated William B. McKinley for the 1926 Republican nomination in Illinois and won the subsequent general election. McKinley died shortly before the end of his term, so Smith was appointed to replace him. When Smith presented his credentials to serve the remainder of McKinely's term, the Senate refused to seat him based on what it saw as an election rife with fraud and corruption. When Smith returned with his credentials for the term he was elected to, the Senate again refused to seat him for the same reasons. Smith and the Governor considered him to be the rightful senator, but he resigned February 9, 1928.
  7. Oregon was the "tipping point" state.
  8. Not seated

Related Research Articles

<span class="mw-page-title-main">1978 United States Senate elections</span>

The 1978 United States Senate elections were held on November 7, in the middle of Democratic President Jimmy Carter's term. The 33 seats of Class 2 were contested in regular elections. Special elections were also held to fill vacancies.

<span class="mw-page-title-main">1970 United States Senate elections</span>

The 1970 United States Senate elections was an election for the United States Senate. It took place on November 3, with the 33 seats of Class 1 contested in regular elections. Special elections were also held to fill vacancies. These races occurred in the middle of Richard Nixon's first term as president. The Democrats lost a net of three seats, while the Republicans and the Conservative Party of New York picked up one net seat each, and former Democrat Harry F. Byrd Jr. was re-elected as an independent.

<span class="mw-page-title-main">1966 United States Senate elections</span>

The 1966 United States Senate elections were elections on November 8, 1966, for the United States Senate which occurred midway through the second term of President Lyndon B. Johnson. The 33 seats of Class 2 were contested in regular elections. Special elections were also held to fill vacancies. With divisions in the Democratic base over the Vietnam War, and with the traditional mid-term advantage of the party not holding the presidency, the Republicans took three Democratic seats, thereby breaking Democrats' 2/3rds supermajority. Despite Republican gains, the balance remained overwhelmingly in favor of the Democrats, who retained a 64–36 majority. Democrats were further reduced to 63–37, following the death of Robert F. Kennedy in June 1968.

<span class="mw-page-title-main">1964 United States Senate elections</span>

The 1964 United States Senate elections were held on November 3. The 33 seats of Class 1 were contested in regular elections. Special elections were also held to fill vacancies. They coincided with the election of President Lyndon B. Johnson by an overwhelming majority, to a full term. His Democratic Party picked up a net two seats from the Republicans. As of 2023, this was the last time either party has had a two-thirds majority in the Senate, which allowed the Senate Democrats to override a veto, propose constitutional amendments, or convict and expel certain officials without any votes from Senate Republicans. However, internal divisions would have prevented the Democrats from having done so. The Senate election cycle coincided with Democratic gains in the House in the same year.

<span class="mw-page-title-main">1960 United States Senate elections</span>

The 1960 United States Senate elections coincided with the election of John F. Kennedy as president on November 8, 1960. The 33 seats of Class 2 were contested in regular elections. A special election was also held on June 28, 1960, for a mid-term vacancy in North Dakota where Democrats flipped a seat to expand their majority to 66–34. As Majority Leader Lyndon Johnson was elected Vice President, Mike Mansfield became the new majority leader.

<span class="mw-page-title-main">1954 United States Senate elections</span>

The 1954 United States Senate elections was a midterm election in the first term of Dwight D. Eisenhower's presidency. The 32 Senate seats of Class 2 were contested in regular elections, and six special elections were held to fill vacancies. Eisenhower's Republican party lost a net of two seats to the Democratic opposition. This small change was just enough to give Democrats control of the chamber with the support of an Independent who agreed to caucus with them, he later officially joined the party in April 1955.

<span class="mw-page-title-main">1952 United States Senate elections</span>

The 1952 United States Senate elections was an election for the United States Senate which coincided with the election of Dwight D. Eisenhower to the presidency by a large margin. The 32 Senate seats of Class 1 were contested in regular elections, and three special elections were held to fill vacancies. The Republicans took control of the Senate by managing to make a net gain of two seats. However, Wayne Morse (R-OR) became an independent forcing Republicans to rely on Vice President Richard Nixon's tie-breaking vote, although Republicans maintained a 48–47–1 plurality. Throughout the next Congress, Republicans were able to restore their 49–46–1 majority. This was the third time, as well as second consecutive, in which a sitting Senate leader lost his seat.

<span class="mw-page-title-main">1944 United States Senate elections</span>

The 1944 United States Senate elections coincided with the re-election of Franklin D. Roosevelt to his fourth term as president. The 32 seats of Class 3 were contested in regular elections, and three special elections were held to fill vacancies.

<span class="mw-page-title-main">1942 United States Senate elections</span>

The 1942 United States Senate elections were held November 3, 1942, midway through Franklin D. Roosevelt's third term as president. The 32 seats of Class 2 were contested in regular elections, and two special elections were held to fill vacancies.

<span class="mw-page-title-main">1940 United States Senate elections</span>

The 1940 United States Senate elections coincided with the election of Franklin D. Roosevelt to his third term as president. The 32 seats of Class 1 were contested in regular elections, and special elections were held to fill vacancies.

<span class="mw-page-title-main">1938 United States Senate elections</span>

The 1938 United States Senate elections occurred in the middle of Franklin D. Roosevelt's second term. The 32 seats of Class 3 were contested in regular elections, and special elections were held to fill vacancies. The Republicans gained eight seats from the Democrats, though this occurred after multiple Democratic gains since the 1932 election, leading to the Democrats retaining a commanding lead over the Republicans with more than two-thirds of the legislative chamber.

<span class="mw-page-title-main">1936 United States Senate elections</span>

The 1936 United States Senate elections coincided with the reelection of President Franklin D. Roosevelt. The 32 seats of Class 2 were contested in regular elections, and special elections were held to fill vacancies. The Great Depression continued and voters backed progressive candidates favoring Roosevelt's New Deal in races across the country. The Democrats gained 5 net seats during the election, and in combination with Democratic and Farmer–Labor interim appointments and the defection of George W. Norris from the Republican Party to become independent, the Republicans were reduced to 16 seats. Democrats gained a further two seats due to mid-term vacancies. The Democrats' 77 seats and their 62-seat majority remain their largest in history.

<span class="mw-page-title-main">1930 United States Senate elections</span> Clickable imagemap for the 1930 US Senate elections

The 1930 United States Senate elections occurred in the middle of Republican President Herbert Hoover's term. The 32 seats of Class 2 were contested in regular elections, and special elections were held to fill vacancies. With the Great Depression beginning to take hold, Republican incumbents became unpopular, and Democrats picked up a net of eight seats, erasing the Republican gains from the previous election cycle, however, Republicans retained control of the chamber. This was the first of four consecutive Senate elections during the Depression in which Democrats made enormous gains, achieving a cumulative pick-up of 34 seats.

<span class="mw-page-title-main">1928 United States Senate elections</span>

The 1928 United States Senate elections were elections that coincided with the presidential election of Republican Herbert Hoover. The 32 seats of Class 1 were contested in regular elections, and special elections were held to fill vacancies. The strong economy helped the Republicans to gain seven seats from the Democrats.

<span class="mw-page-title-main">1924 United States Senate elections</span>

The 1924 United States Senate elections were elections for the United States Senate which coincided with the election of Republican President Calvin Coolidge to a full term. The 32 seats of Class 2 were contested in regular elections, and special elections were held to fill vacancies. The strong economy and Coolidge's popularity helped Republican candidates increase their majority by three. Republicans would gain a further two seats through mid-term vacancies bringing their seat share to 56-39-1.

<span class="mw-page-title-main">1922 United States Senate elections</span>

The 1922 United States Senate elections were elections that occurred in the middle of Republican President Warren G. Harding's term. The 32 seats of Class 1 were contested in regular elections, and special elections were held to fill vacancies. With the Republicans divided between conservative and progressive factions, the Democrats gained six net seats from the Republicans while the Farmer–Labor party gained one. The Republicans retained their Senate majority.

<span class="mw-page-title-main">1920 United States Senate elections</span>

The 1920 United States Senate elections were elections for the United States Senate that coincided with the presidential election of Warren G. Harding. The 32 seats of Class 3 were contested in regular elections, and special elections were held to fill vacancies. Democrat Woodrow Wilson's unpopularity allowed Republicans to win races across the country, winning ten seats from the Democrats and providing them with an overwhelming 59-to-37 majority. The Republican landslide was so vast that Democrats lost over half of the seats that were contested this year and failed to win a single race outside the South.

<span class="mw-page-title-main">1914 United States Senate elections</span> A clickable map of the 1914 US Senate elections.

The 1914 United States Senate elections were held on November 3, 1914. These were the first regularly scheduled elections held following the ratification of the Seventeenth Amendment to the United States Constitution in 1913, which required that all seats up for election be popularly elected, rather than chosen by their state legislatures. Thus, it was the first time that elections were generally scheduled on Election Day to coincide with the U.S. House elections. The 32 seats of Class 3 were contested in regular elections in 1914. Special elections were also held to fill vacancies. These elections occurred in the middle of Democratic President Woodrow Wilson's first term.

<span class="mw-page-title-main">1918 United States Senate elections</span>

The 1918 United States Senate elections were held throughout 1918, the midpoint of Woodrow Wilson's second term as president. This was the first election since the enactment of the Seventeenth Amendment that all 32 Class 2 Senators were subject to direct or popular election, making them the final class under the old system of being selected by state legislatures. Special elections were also held to fill vacancies.

<span class="mw-page-title-main">1926 United States Senate special election in Indiana</span>

The 1926 United States Senate special election in Indiana was held on November 2, 1926, to complete the unexpired term of Senator Samuel M. Ralston, who died on October 14, 1925. Interim Republican Senator Arthur Raymond Robinson, who had been appointed to fill the seat, was re-elected to finish the term over Democrat Evans Woollen.

References

  1. 1 2 3 4 5 6 7 8 9 10 11 12 13 14 15 16 17 18 19 20 21 22 23 24 25 26 27 28 29 30 31 32 33 34 35 36 "Statistics of the Congressional Election of November 2, 1926" (PDF). Clerk.house.gov. Retrieved August 21, 2019.
  2. "Primary Election 06-30-1926" (PDF). North Dakota Secretary of State . Retrieved 2022-06-19.
  3. "General Election 11-02-1926" (PDF). North Dakota Secretary of State. Retrieved 2022-06-19.