| ||||||||||||||||||||||||||||||||||
34 of the 96 seats in the United States Senate 49 seats needed for a majority | ||||||||||||||||||||||||||||||||||
---|---|---|---|---|---|---|---|---|---|---|---|---|---|---|---|---|---|---|---|---|---|---|---|---|---|---|---|---|---|---|---|---|---|---|
| ||||||||||||||||||||||||||||||||||
Results of the elections: Democratic hold Republican gain Republican hold No election | ||||||||||||||||||||||||||||||||||
|
The 1920 United States Senate elections were elections for the United States Senate that coincided with the presidential election of Warren G. Harding. The 32 seats of Class 3 were contested in regular elections, and special elections were held to fill vacancies. Democrat Woodrow Wilson's unpopularity allowed Republicans to win races across the country, winning ten seats from the Democrats and providing them with an overwhelming 59-to-37 majority. The Republican landslide was so vast that Democrats lost over half of the contested seats this year and failed to win a single race outside the South. In fact, this is the most recent occasion where every race decided by under 10 points all voted for the same party, showcasing the sheer strength of Republicans' performance in this election.
Since the passage of the Seventeenth Amendment, these elections were the closest when the winning party in almost every Senate election mirrored the winning party for their state in the presidential election, with Kentucky being the only Senate race not to mirror their presidential result. No other Senate election cycle in a presidential year would come close to repeating this feat until 2016, in which the result of every Senate race mirrored the corresponding state's result in the presidential election. Coincidentally, that election cycle involved the same class of Senate seats, Class 3. [1] This is one of only five occasions where 10 or more Senate seats changed party in an election, with the other occasions being in 1932, 1946, 1958, and 1980.
As of 2024, the 59 seats held after this election cycle remains the highest number of seats that the Republican Party has held as the result of an election cycle. This number rose to 60, the highest number of seats the Republicans have ever held, after Democrat senator Josiah O. Wolcott of Delaware accepted an offer from Republican governor William D. Denney to become Chancellor of the Delaware Court of Chancery, allowing Denney to name Republican T. Coleman du Pont to replace Wolcott, a seat du Pont held until the next election, in which both a special election was held for the remainder of the term and a regular election was held as the seat was normally up then, both of which du Pont lost narrowly to Democrat Thomas F. Bayard Jr. In addition, the 22-seat majority is the largest majority that the Republicans have achieved in any election since.
Two Republicans and three Democrats retired instead of seeking re-election. One Democrat retired instead of seeking election to finish the unexpired term.
Ten Democrats and one Republican sought re-election but lost in the primary or general election.
D1 | D2 | D3 | D4 | D5 | D6 | D7 | D8 | ||
D18 | D17 | D16 | D15 | D14 | D13 | D12 | D11 | D10 | D9 |
D19 | D20 | D21 | D22 | D23 | D24 | D25 | D26 | D27 | D28 |
D38 Ky. Ran | D37 Idaho Ran | D36 Ga. Ran | D35 Fla. Ran | D34 Colo. Retired | D33 Calif. Ran | D32 Ark. Ran | D31 Ariz. Ran | D30 Ala. (sp) Retired | D29 Ala. (reg) Ran |
D39 La. Retired | D40 Md. Ran | D41 Nev. Ran | D42 N.C. Ran | D43 Okla. Ran | D44 Ore. Ran | D45 S.C. Ran | D46 S.D. Ran | D47 Va. (sp) Ran | R49 Wisc. Ran |
Majority → | |||||||||
R39 Kan. Ran | R40 Mo. Ran | R41 N.H. Ran | R42 N.Y. Ran | R43 N.D. Ran | R44 Ohio Retired | R45 Pa. Ran | R46 Utah Ran | R47 Vt. Ran | R8 Wash. Ran |
R38 Iowa Ran | R37 Ind. Retired | R36 Ill. Ran | R35 Conn. Ran | R34 | R33 | R32 | R31 | R30 | R29 |
R19 | R20 | R21 | R22 | R23 | R24 | R25 | R26 | R27 | R28 |
R18 | R17 | R16 | R15 | R14 | R13 | R12 | R11 | R10 | R9 |
R1 | R2 | R3 | R4 | R5 | R6 | R7 | R8 |
D1 | D2 | D3 | D4 | D5 | D6 | D7 | D8 | ||
D18 | D17 | D16 | D15 | D14 | D13 | D12 | D11 | D10 | D9 |
D19 | D20 | D21 | D22 | D23 | D24 | D25 | D26 | D27 | D28 |
R59 S.D. Gain | D37 Va. (sp) Elected [lower-alpha 2] | D36 S.C. Re-elected | D35 N.C. Re-elected | D34 La. Hold | D33 Ga. Hold | D32 Fla. Re-elected | D31 Ark. Hold | D30 Ala. (sp) Hold | D29 Ala. (reg) Re-elected |
R58 Ore. Gain | R57 Okla. Gain | R56 Nev. Gain | R55 Md. Gain | R54 Ky. Gain | R53 Idaho Gain | R52 Colo. Gain | R51 Calif. Gain | R50 Ariz. Gain | R49 Wisc. Re-elected |
Majority → | |||||||||
R39 Kan. Re-elected | R40 Mo. Re-elected | R41 N.H. Re-elected | R42 N.Y. Re-elected | R43 N.D. Hold | R44 Ohio Hold | R45 Pa. Re-elected | R46 Utah Re-elected | R47 Vt. Re-elected | R48 Wash. Re-elected |
R38 Iowa Re-elected | R37 Ind. Re-elected | R36 Ill. Hold | R35 Conn. Re-elected | R34 | R33 | R32 | R31 | R30 | R29 |
R19 | R20 | R21 | R22 | R23 | R24 | R25 | R26 | R27 | R28 |
R18 | R17 | R16 | R15 | R14 | R13 | R12 | R11 | R10 | R9 |
R1 | R2 | R3 | R4 | R5 | R6 | R7 | R8 |
Key |
|
---|
In these special elections, the winner was seated during 1920 or before March 4, 1921; ordered by election date.
State | Incumbent | Results | Candidates | ||
---|---|---|---|---|---|
Senator | Party | Electoral history | |||
Alabama (Class 2) | B. B. Comer | Democratic | 1920 (appointed) | Interim appointee retired. New senator elected November 2, 1920. Democratic hold. |
|
Virginia (Class 2) | Carter Glass | Democratic | 1920 (appointed) | Interim appointee elected November 2, 1920. |
|
In these general elections, the winners were elected for the term beginning March 4, 1921; ordered by state.
All of the elections involved the Class 3 seats.
State | Incumbent | Results | Candidates | ||
---|---|---|---|---|---|
Senator | Party | Electoral history | |||
Alabama | Oscar Underwood | Democratic | 1914 | Incumbent re-elected. |
|
Arizona | Marcus A. Smith | Democratic | 1912 (new state) 1914 | Incumbent lost re-election. Republican gain. |
|
Arkansas | William F. Kirby | Democratic | 1916 (special) | Incumbent lost renomination. Democratic hold. |
|
California | James D. Phelan | Democratic | 1914 | Incumbent lost re-election. Republican gain. |
|
Colorado | Charles S. Thomas | Democratic | 1913 (special) 1914 | Incumbent lost re-election as a Nationalist. Republican gain. |
|
Connecticut | Frank B. Brandegee | Republican | 1905 (special) 1909 1914 | Incumbent re-elected. |
Others
|
Florida | Duncan U. Fletcher | Democratic | 1909 (appointed) 1909 (special) 1914 | Incumbent re-elected. |
|
Georgia | Hoke Smith | Democratic | 1911 (special) 1914 | Incumbent lost renomination. Democratic hold. |
|
Idaho | John F. Nugent | Democratic | 1918 (appointed) 1918 (special) | Incumbent lost re-election. Republican gain. Incumbent resigned January 14, 1921 to give successor preferential seniority. Winner appointed January 15, 1921. |
|
Illinois | Lawrence Y. Sherman | Republican | 1913 (special) 1914 | Incumbent retired. Republican hold. |
Others
|
Indiana | James E. Watson | Republican | 1916 (special) | Incumbent re-elected. |
Others
|
Iowa | Albert B. Cummins | Republican | 1908 (special) 1914 | Incumbent re-elected. |
Others
|
Kansas | Charles Curtis | Republican | 1907 (special) 1907 1913 (lost) 1914 | Incumbent re-elected. |
|
Kentucky | J. C. W. Beckham | Democratic | 1914 | Incumbent lost re-election. Republican gain. |
|
Louisiana | Edward J. Gay | Democratic | 1918 (special) | Incumbent retired. Democratic hold. |
|
Maryland | John W. Smith | Democratic | 1908 (special) 1908 1914 | Incumbent lost re-election. Republican gain. |
Others
|
Missouri | Selden P. Spencer | Republican | 1918 (special) | Incumbent re-elected. |
|
Nevada | Charles Henderson | Democratic | 1918 (appointed) 1918 (special) | Incumbent lost re-election. Republican gain. |
|
New Hampshire | George H. Moses | Republican | 1918 (special) | Incumbent re-elected. |
|
New York | James W. Wadsworth Jr. | Republican | 1914 | Incumbent re-elected. |
|
North Carolina | Lee S. Overman | Democratic | 1903 1909 1914 | Incumbent re-elected. |
|
North Dakota | Asle Gronna | Republican | 1911 (special) 1914 | Incumbent lost renomination. Republican hold. |
|
Ohio | Warren G. Harding | Republican | 1914 | Incumbent retired to run for U.S. President. Republican hold. Incumbent resigned January 13, 1921, having won the Presidency. Winner appointed January 14, 1921. |
|
Oklahoma | Thomas Gore | Democratic | 1907 (new state) 1909 1914 | Incumbent lost renomination. Republican gain. |
|
Oregon | George E. Chamberlain | Democratic | 1909 1914 | Incumbent lost re-election. Republican gain. |
|
Pennsylvania | Boies Penrose | Republican | 1897 1903 1909 1914 | Incumbent re-elected. |
|
South Carolina | Ellison D. Smith | Democratic | 1909 1914 | Incumbent re-elected. |
|
South Dakota | Edwin S. Johnson | Democratic | 1914 | Incumbent retired. Republican gain. |
|
Utah | Reed Smoot | Republican | 1903 1909 1914 | Incumbent re-elected. |
|
Vermont | William P. Dillingham | Republican | 1900 (special) 1902 1908 1914 | Incumbent re-elected. |
|
Washington | Wesley L. Jones | Republican | 1909 1914 | Incumbent re-elected. |
|
Wisconsin | Irvine Lenroot | Republican | 1918 (special) | Incumbent re-elected. |
|
Nine races had a margin of victory under 10%:
State | Party of winner | Margin |
---|---|---|
Kentucky | Republican (flip) | 0.6% |
Maryland | Republican (flip) | 4.0% |
Nevada | Republican (flip) | 4.2% |
Oklahoma | Republican (flip) | 6.1% |
Wisconsin | Republican | 6.9% |
Oregon | Republican (flip) | 7.2% |
Idaho | Republican (flip) | 8.2% |
California | Republican (flip) | 8.3% |
Missouri | Republican | 9.2% |
The tipping point state is Colorado with a margin of 15.2%.
| |||||||||||||||||
| |||||||||||||||||
County Results Underwood: 50–60% 60–70% 70–80% 80–90% >90% Reynolds: 50–60% 60–70% | |||||||||||||||||
|
Party | Candidate | Votes | % | |
---|---|---|---|---|
Democratic | Oscar Underwood (Incumbent) | 154,664 | 66.10% | |
Republican | L. H. Reynolds | 77,337 | 33.05% | |
Socialist | A. M. Forsman | 1,984 | 0.85% | |
Majority | 77,327 | 33.05% | ||
Turnout | 233,985 | |||
Democratic hold |
| |||||||||||||||||
| |||||||||||||||||
County Results Heflin: 50–60% 60–70% 70–80% 80–90% >90% Lunsford: 50–60% 60–70% | |||||||||||||||||
|
Party | Candidate | Votes | % | |
---|---|---|---|---|
Democratic | J. Thomas Heflin | 160,680 | 69.27% | |
Republican | C. P. Lunsford | 68,460 | 29.51% | |
Socialist | W. H. Chichester | 2,820 | 1.22% | |
Majority | 92,220 | 39.76% | ||
Turnout | 231,960 | |||
Democratic hold |
| |||||||||||||||||
| |||||||||||||||||
County results Cameron: 50–60% 60–70% Smith: 50–60% 60–70% | |||||||||||||||||
|
Party | Candidate | Votes | % | |
---|---|---|---|---|
Republican | Ralph H. Cameron | 35,893 | 55.17% | |
Democratic | Marcus A. Smith (Incumbent) | 29,169 | 44.83% | |
Majority | 6,724 | 10.34% | ||
Turnout | 65,062 | |||
Republican gain from Democratic |
| |||||||||||||||||
| |||||||||||||||||
County results Caraway: 50–60% 60–70% 70–80% 80–90% Cole: 50–60% 60–70% | |||||||||||||||||
|
Party | Candidate | Votes | % | |
---|---|---|---|---|
Democratic | Thaddeus H. Caraway | 126,477 | 65.92% | |
Republican | Charles F. Cole | 65,381 | 34.08% | |
Majority | 61,096 | 31.84% | ||
Turnout | 191,858 | |||
Democratic hold |
| |||||||||||||||||||||
| |||||||||||||||||||||
County results Shortridge: 40–50% 50–60% 60–70% 80–90% Phelan: 40–50% 50–60% 60–70% | |||||||||||||||||||||
|
Party | Candidate | Votes | % | |
---|---|---|---|---|
Republican | Samuel M. Shortridge | 447,835 | 49.01% | |
Democratic | James D. Phelan (Incumbent) | 371,580 | 40.67% | |
Prohibition | James S. Edwards | 57,768 | 6.32% | |
Socialist | Elvina S. Beals | 36,545 | 4.00% | |
Majority | 76,255 | 8.34% | ||
Turnout | 913,728 | |||
Republican gain from Democratic |
| |||||||||||||||||
| |||||||||||||||||
Results by county Nicholson: 40–50% 50–60% 60–70% 70–80% Scott: 40–50% | |||||||||||||||||
|
Party | Candidate | Votes | % | |
---|---|---|---|---|
Republican | Samuel D. Nicholson | 156,577 | 54.52% | |
Democratic | Tully Scott | 112,890 | 39.31% | |
Farmer–Labor | G. F. Stevens | 9,041 | 3.15% | |
National | Charles S. Thomas (incumbent) | 8,665 | 3.02% | |
Majority | 43,687 | 15.21% | ||
Turnout | 287,173 | |||
Republican hold |
| |||||||||||||||||
| |||||||||||||||||
Brandegee: 40-50% 50-60% 60-70% 70-80% 80-90% 90-100% Lonergan: 40–50% 50–60% 60-70% | |||||||||||||||||
|
Party | Candidate | Votes | % | |
---|---|---|---|---|
Republican | Frank B. Brandegee (Incumbent) | 216,792 | 59.36% | |
Democratic | Augustine Lonergan | 131,824 | 36.10% | |
Socialist | Martin F. Plunkett | 10,118 | 2.77% | |
Prohibition | Emil L. G. Hohenthal | 2,892 | 0.79% | |
Farmer–Labor | Josephine B. Bennett | 2,076 | 0.57% | |
Socialist Labor | Charles J. Backofen | 1,486 | 0.41% | |
Majority | 84,968 | 23.26% | ||
Turnout | 365,188 | |||
Republican hold |
| |||||||||||||||||
| |||||||||||||||||
County results Fletcher: 50-60% 60-70% 70-80% 80-90% 90-100% | |||||||||||||||||
|
Party | Candidate | Votes | % | |
---|---|---|---|---|
Democratic | Duncan U. Fletcher (Incumbent) | 98,957 | 69.50% | |
Republican | John Moses Cheney | 37,065 | 26.03% | |
Socialist | M. J. Martin | 3,525 | 2.48% | |
White Republican | G. A. Klock | 2,847 | 2.00% | |
Majority | 61,892 | 43.47% | ||
Turnout | 142,394 | |||
Democratic hold |
| |||||||||||||||||
| |||||||||||||||||
|
Party | Candidate | Votes | % | |
---|---|---|---|---|
Democratic | Thomas E. Watson | 124,630 | 94.90% | |
Pro-League Independent | Harry S. Edwards | 6,700 | 5.10% | |
Majority | 117930 | 89.80% | ||
Turnout | 131330 | |||
Democratic hold |
| |||||||||||||||||
| |||||||||||||||||
County results Gooding: 50-60% 60-70% Nugent: 50-60% 60-70% | |||||||||||||||||
|
Party | Candidate | Votes | % | |
---|---|---|---|---|
Republican | Frank R. Gooding | 75,985 | 54.08% | |
Democratic | John F. Nugent (Incumbent) | 64,513 | 45.92% | |
Majority | 11,472 | 8.16% | ||
Turnout | 140,498 | |||
Republican gain from Democratic |
| |||||||||||||||||
| |||||||||||||||||
Results by county McKinley: 40–50% 50–60% 60–70% 70–80% 80–90% Waller: 40–50% 50–60% | |||||||||||||||||
|
Party | Candidate | Votes | % | |
---|---|---|---|---|
Republican | William B. McKinley | 1,381,384 | 66.83% | |
Democratic | Peter A. Waller | 554,372 | 26.82% | |
Socialist | Gustave T. Fraenckel | 66,463 | 3.22% | |
Farmer–Labor | John Fitzpatrick | 50,749 | 2.46% | |
Prohibition | Frank B. Vennum | 10,186 | 0.49% | |
Socialist Labor | Joseph B. Moody | 3,107 | 0.15% | |
Single Tax | George Dodd Carrington Jr. | 784 | 0.04% | |
Majority | 827,012 | 40.01% | ||
Turnout | 2,067,045 | |||
Republican hold |
| |||||||||||||||||
| |||||||||||||||||
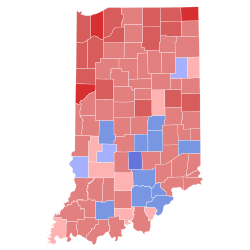
County results Watson: 40–50% 50–60% 60–70% 70–80% Taggart: 40–50% 50–60% 60–70% | |||||||||||||||||
|
Party | Candidate | Votes | % | |
---|---|---|---|---|
Republican | James Eli Watson (Incumbent) | 681,851 | 54.57% | |
Democratic | Thomas Taggart | 514,191 | 41.15% | |
Socialist | Francis M. Wampler | 23,395 | 1.87% | |
Farmer–Labor | Francis J. Dillon | 16,804 | 1.34% | |
Prohibition | Culla Bayhinger | 13,323 | 1.07% | |
Majority | 167,660 | 13.42% | ||
Turnout | 1,249,564 | |||
Republican hold |
| |||||||||||||||||
| |||||||||||||||||
County results Cummins: 50–60% 60–70% 70–80% Porter: 50–60% | |||||||||||||||||
|
Party | Candidate | Votes | % | |
---|---|---|---|---|
Republican | Albert B. Cummins (Incumbent) | 528,499 | 61.42% | |
Democratic | Claude R. Porter | 322,015 | 37.42% | |
Farmer–Labor | H. W. Cowles | 9,020 | 1.05% | |
Socialist Labor | Arthur S. Dowler | 933 | 0.11% | |
Majority | 206,484 | 24.00% | ||
Turnout | 860,467 | |||
Republican hold |
| |||||||||||||||||
| |||||||||||||||||
County results Curtis: 40–50% 50–60% 60–70% 70–80% | |||||||||||||||||
|
Party | Candidate | Votes | % | |
---|---|---|---|---|
Republican | Charles Curtis (Incumbent) | 327,072 | 64.01% | |
Democratic | George H. Hodges | 170,443 | 33.36% | |
Socialist | Dan Beedy | 13,417 | 2.63% | |
Majority | 156,629 | 30.65% | ||
Turnout | 510,932 | |||
Republican hold |
| |||||||||||||||||
| |||||||||||||||||
County results Ernst: 50–60% 60–70% 70–80% 80–90% >90% Beckham: 50–60% 60–70% 70–80% 80–90% | |||||||||||||||||
|
Party | Candidate | Votes | % | |
---|---|---|---|---|
Republican | Richard P. Ernst | 454,226 | 50.28% | |
Democratic | J. C. W. Beckham (Incumbent) | 449,244 | 49.72% | |
Majority | 4,982 | 0.56% | ||
Turnout | 903,470 | |||
Republican gain from Democratic |
| |||||||||||||||||||||
| |||||||||||||||||||||
|
Party | Candidate | Votes | % | |
---|---|---|---|---|
Democratic | Edwin S. Broussard | 49,718 | 45.74% | |
Democratic | Jared Y. Sanders Sr. | 43,425 | 39.95% | |
Democratic | Donelson Caffery III | 15,563 | 14.32% | |
Total votes | 108,706 | 100.00% |
Party | Candidate | Votes | % | |
---|---|---|---|---|
Democratic | Edwin S. Broussard | 94,944 | 100.00% | |
Democratic hold |
| |||||||||||||||||||||
| |||||||||||||||||||||
County results Weller: 40–50% 50–60% 60–70% Smith: 40–50% 50–60% 60–70% | |||||||||||||||||||||
|
Party | Candidate | Votes | % | |
---|---|---|---|---|
Republican | Ovington Weller | 184,999 | 47.29% | |
Democratic | John Walter Smith (Incumbent) | 169,200 | 43.25% | |
Independent | G. D. Iverson Jr. | 21,345 | 5.46% | |
Socialist | William A. Toole | 6,559 | 1.68% | |
Independent | William A. Hawkins | 6,538 | 1.67% | |
Labor | Frank N. H. Lang | 2,569 | 0.66% | |
Majority | 15,799 | 4.04% | ||
Turnout | 391,210 | |||
Republican gain from Democratic |
| |||||||||||||||||
| |||||||||||||||||
County results Spencer: 40–50% 50–60% 60–70% 70–80% 80–90% Long: 40–50% 50–60% 60–70% 70–80% 80–90% | |||||||||||||||||
|
Party | Candidate | Votes | % | |
---|---|---|---|---|
Republican | Selden P. Spencer (Incumbent) | 711,161 | 53.65% | |
Democratic | Breckinridge Long | 589,498 | 44.47% | |
Socialist | Elias F. Hodges | 20,002 | 1.51% | |
Farmer–Worker | W. J. Mallett | 3,158 | 0.24% | |
Socialist Labor | Andrew Trudell | 1,675 | 0.13% | |
Majority | 121,663 | 9.18% | ||
Turnout | 1,325,494 | |||
Republican hold |
| |||||||||||||||||||||
| |||||||||||||||||||||
County results Oddie: 30–40% 40–50% 50–60% 60–70% Henderson: 30–40% 40–50% 50–60% | |||||||||||||||||||||
|
Party | Candidate | Votes | % | |
---|---|---|---|---|
Republican | Tasker Oddie | 11,550 | 42.11% | |
Democratic | Charles B. Henderson (Incumbent) | 10,402 | 37.93% | |
Independent | Anne Henrietta Martin | 4,981 | 18.16% | |
Socialist | James Jepson | 494 | 1.80% | |
Majority | 1148 | 5.18% | ||
Turnout | 27,427 | |||
Republican gain from Democratic |
| |||||||||||||||||
| |||||||||||||||||
County results Moses: 50–60% 60–70% | |||||||||||||||||
|
Party | Candidate | Votes | % | |
---|---|---|---|---|
Republican | George H. Moses (Incumbent) | 90,173 | 57.72% | |
Democratic | Raymond Bartlett Stevens | 65,038 | 41.63% | |
Socialist | William H. Wilkins | 1,004 | 0.64% | |
Majority | 25135 | 16.09% | ||
Turnout | 156,215 | |||
Republican hold |
| |||||||||||||||||||||||||||||||||||||
| |||||||||||||||||||||||||||||||||||||
| |||||||||||||||||||||||||||||||||||||
County Results Wadsworth: 30–40% 40–50% 50–60% 60–70% | |||||||||||||||||||||||||||||||||||||
|
Party | Candidate | Votes | % | |
---|---|---|---|---|
Republican | James Wolcott Wadsworth Jr. (Incumbent) | 1,434,393 | 52.36% | |
Democratic | Harry C. Walker | 901,310 | 32.90% | |
Socialist | Jacob Panken | 208,155 | 7.60% | |
Prohibition | Ella A. Boole | 159,623 | 5.83% | |
Farmer–Labor | Rose Schneiderman | 27,934 | 1.02% | |
Socialist Labor | Harry Carlson | 7,822 | 0.29% | |
Majority | 533,083 | 19.46% | ||
Turnout | 2,739,237 | |||
Republican hold |
| |||||||||||||||||
| |||||||||||||||||
County Results Overman: 50–60% 60–70% 70–80% 80–90% 90–100% Holton: 50–60% 60–70% 70–80% 80–90% | |||||||||||||||||
|
Party | Candidate | Votes | % | |
---|---|---|---|---|
Democratic | Lee Slater Overman (Incumbent) | 310,504 | 57.52% | |
Republican | A. E. Holton | 229,343 | 42.48% | |
Majority | 81,161 | 15.04% | ||
Turnout | 539,847 | |||
Democratic hold |
| |||||||||||||||||
| |||||||||||||||||
County Results Ladd: 50–60% 60–70% 70–80% 80–90% Perry: 50–60% | |||||||||||||||||
|
Party | Candidate | Votes | % | |
---|---|---|---|---|
Republican | Edwin F. Ladd | 130,614 | 59.61% | |
Democratic | H. H. Perry | 88,495 | 40.39% | |
Majority | 42,109 | 19.22% | ||
Turnout | 219,109 | |||
Republican hold |
| |||||||||||||||||
| |||||||||||||||||
County Results Willis: 50–60% 60–70% 70–80% Julian: 50–60% 60–70% | |||||||||||||||||
|
Party | Candidate | Votes | % | |
---|---|---|---|---|
Republican | Frank B. Willis | 1,134,953 | 59.10% | |
Democratic | William Alexander Julian | 782,650 | 40.76% | |
Independent | Henry B. Strong | 2,647 | 0.14% | |
Majority | 352,303 | 18.34% | ||
Turnout | 1,920,250 | |||
Republican hold |
| |||||||||||||||||
| |||||||||||||||||
County results Harreld: 40–50% 50–60% 60–70% Ferris: 50–60% 60–70% 70–80% 80–90% | |||||||||||||||||
|
Party | Candidate | Votes | % | |
---|---|---|---|---|
Republican | John W. Harreld | 247,719 | 50.64% | |
Democratic | Scott Ferris | 217,783 | 44.52% | |
Socialist | A. A. Bagwell | 23,664 | 4.84% | |
Majority | 29,936 | 6.12% | ||
Turnout | 489,166 | |||
Republican gain from Democratic |
| |||||||||||||||||
| |||||||||||||||||
County Results Stanfield: 40–50% 50–60% 60–70% Chamberlain: 40–50% 50–60% | |||||||||||||||||
|
Party | Candidate | Votes | % | |
---|---|---|---|---|
Republican | Robert N. Stanfield | 116,696 | 50.73% | |
Democratic | George Earle Chamberlain (Incumbent) | 100,133 | 43.53% | |
Socialist | Albert Slaughter | 6,949 | 3.02% | |
Independent | Thomas A. Hayes | 4,456 | 1.94% | |
Industrial Labor | C. H. Svenson | 1,782 | 0.77% | |
Majority | 16,563 | 7.20% | ||
Turnout | 230,016 | |||
Republican gain from Democratic |
| |||||||||||||||||||||
| |||||||||||||||||||||
County results Penrose: 40–50% 50–60% 60–70% 70–80% Farrell: 40–50% 50–60% | |||||||||||||||||||||
|
Party | Candidate | Votes | % | |
---|---|---|---|---|
Republican | Boies Penrose (Incumbent) | 1,067,989 | 59.94% | |
Democratic | John A. Farrell | 484,362 | 27.18% | |
Prohibition | Leah Cobb Marion | 132,610 | 7.44% | |
Socialist | Birch Wilson | 67,316 | 3.78% | |
Labor | Robert J. Wheeler | 27,401 | 1.54% | |
Single Tax | Joseph E. Jennings | 2,110 | 0.12% | |
None | Scattering | 55 | 0.00% | |
Majority | 583,627 | 32.76% | ||
Turnout | 1,781,843 | |||
Republican hold |
| |||||||||||||||||
| |||||||||||||||||
Smith: 30–40% 40–50% 50–60% 60–70% 70–80% 80–90% Warren: 30–40% 40–50% 50-60% 60–70% 70–80% 80–90% | |||||||||||||||||
|
Democratic Primary Runoff | |||
---|---|---|---|
Candidate | Votes | % | ±% |
Ellison D. Smith | 65,880 | 60.7 | +12.0 |
George Warren | 42,735 | 39.3 | +8.5 |
Party | Candidate | Votes | % | |
---|---|---|---|---|
Democratic | Ellison D. Smith (Incumbent) | 64,388 | 100.00% | |
Independent | George Warren | 1 | 0.00% | |
Majority | 64387 | 100.00% | ||
Turnout | 64389 | |||
Democratic hold |
| |||||||||||||||||||||||||||||||||||||
| |||||||||||||||||||||||||||||||||||||
County results Norbeck: 30–40% 40–50% 50–60% 60–70% Ayres: 30-40% 40–50% 50–60% Richards: 30–40% No Vote: | |||||||||||||||||||||||||||||||||||||
|
Party | Candidate | Votes | % | |
---|---|---|---|---|
Republican | Peter Norbeck | 92,267 | 50.10% | |
Independent | Tom Ayres | 44,309 | 24.06% | |
Democratic | U. S. G. Cherry | 36,833 | 20.00% | |
Independent | Richard Olsen Richards | 10,032 | 5.45% | |
Independent | L. J. Manbeck | 738 | 0.40% | |
Majority | 47,958 | 26.04% | ||
Turnout | 184,179 | |||
Republican hold |
| |||||||||||||||||
| |||||||||||||||||
County results Smoot: 40–50% 50–60% 60–70% 70–80% | |||||||||||||||||
|
Party | Candidate | Votes | % | |
---|---|---|---|---|
Republican | Reed Smoot (Incumbent) | 82,566 | 56.57% | |
Democratic | Milton H. Welling | 56,280 | 38.56% | |
Socialist | J. Alex Beven | 7,112 | 4.87% | |
Majority | 26,286 | 18.01% | ||
Turnout | 145,958 | |||
Republican hold |
| |||||||||||||||||
| |||||||||||||||||
|
Party | Candidate | Votes | % | |
---|---|---|---|---|
Republican | William P. Dillingham (Incumbent) | 69,650 | 78.02% | |
Democratic | Howard E. Shaw | 19,580 | 21.93% | |
None | Scattering | 41 | 0.05% | |
Majority | 50,070 | 56.09% | ||
Total votes | 89,271 | |||
Republican hold |
| |||||||||||||||||
| |||||||||||||||||
|
Party | Candidate | Votes | % | |
---|---|---|---|---|
Democratic | Carter Glass (Incumbent) | 184,646 | 91.31% | |
Republican | J. R. Pollard | 17,576 | 8.69% | |
Majority | 167070 | 82.62% | ||
Total votes | 202,222 | |||
Democratic hold |
| |||||||||||||||||||||
| |||||||||||||||||||||
Results by county Jones: 30–40% 40–50% 50–60% 60–70% | |||||||||||||||||||||
|
Party | Candidate | Votes | % | |
---|---|---|---|---|
Republican | Wesley Livsey Jones (Incumbent) | 217,069 | 56.40% | |
Farmer–Labor | Clemens J. France | 99,309 | 25.80% | |
Democratic | George F. Cotterill | 68,488 | 17.80% | |
Majority | 117,760 | 30.60% | ||
Turnout | 384,866 | |||
Republican hold |
| |||||||||||||||||||||||||||||||||||||
| |||||||||||||||||||||||||||||||||||||
County results Lenroot: 30–40% 40–50% 50–60% 60–70% 70–80% Thompson: 30–40% 40–50% 50–60% 60–70% Weber: 20–30% | |||||||||||||||||||||||||||||||||||||
|
Party | Candidate | Votes | % | |
---|---|---|---|---|
Republican | Irvine Lenroot (Incumbent) | 281,576 | 41.58% | |
Independent | James Thompson | 235,029 | 34.71% | |
Democratic | Paul Samuel Reinsch | 89,265 | 13.18% | |
Socialist | Frank J. Weber | 66,172 | 9.77% | |
Prohibition | Clyde D. Mead | 5,107 | 0.75% | |
None | Scattering | 3 | 0.00% | |
Majority | 46,547 | 6.87% | ||
Turnout | 677,152 | |||
Republican hold |
The Democratic Senatorial Campaign Committee (DSCC) is the Democratic Hill committee for the United States Senate. Its purpose is to elect Democrats to the United States Senate. The DSCC's current Chair is Senator Gary Peters of Michigan, who succeeded Nevada's Catherine Cortez Masto after the 2020 Senate elections. DSCC's current executive director is Christie Roberts.
The 1960 United States Senate elections coincided with the election of John F. Kennedy as president on November 8, 1960. The 33 seats of Class 2 were contested in regular elections. A special election was also held on June 28, 1960, for a mid-term vacancy in North Dakota where Democrats flipped a seat to expand their majority to 66–34. As Majority Leader Lyndon Johnson was elected Vice President, Mike Mansfield became the new majority leader.
The 1954 United States Senate elections was a midterm election in the first term of Dwight D. Eisenhower's presidency. The 32 Senate seats of Class 2 were contested in regular elections, and six special elections were held to fill vacancies. Eisenhower's Republican party lost a net of two seats to the Democratic opposition. This small change was just enough to give Democrats control of the chamber with the support of an Independent who agreed to caucus with them; he later officially joined the party in April 1955.
The 1948 United States Senate elections were held concurrently with the election of Democratic President Harry S. Truman for a full term. The 32 seats of Class 2 were contested in regular elections, and one special election was held to fill a vacancy. Truman campaigned against an "obstructionist" Congress that had blocked many of his initiatives, and additionally, the U.S. economy recovered from the postwar recession of 1946–1947 by election day. Thus, Truman was rewarded with a Democratic gain of nine seats in the Senate, enough to give them control of the chamber. This was the last time until 2020 that Democrats flipped a chamber of Congress in a presidential election cycle.
The 1946 United States Senate elections were held November 5, 1946, in the middle of Democratic President Harry S. Truman's first term after Roosevelt's passing. The 32 seats of Class 1 were contested in regular elections, and four special elections were held to fill vacancies. The Republicans took control of the Senate by picking up twelve seats, mostly from the Democrats. This was the first time since 1932 that the Republicans had held the Senate, recovering from a low of 16 seats following the 1936 Senate elections.
The 1936 United States Senate elections coincided with the reelection of President Franklin D. Roosevelt. The 32 seats of Class 2 were contested in regular elections, and special elections were held to fill vacancies. The Great Depression continued and voters backed progressive candidates favoring Roosevelt's New Deal in races across the country. The Democrats gained 5 net seats during the election, and in combination with Democratic and Farmer–Labor interim appointments and the defection of George W. Norris from the Republican Party to become independent, the Republicans were reduced to 16 seats. Democrats gained a further two seats due to mid-term vacancies. The Democrats' 77 seats and their 62-seat majority remain their largest in history.
The 1928 United States Senate elections were elections that coincided with the presidential election of Republican Herbert Hoover. The 32 seats of Class 1 were contested in regular elections, and special elections were held to fill vacancies. The strong economy helped the Republicans to gain seven seats from the Democrats.
William duHamel Denney was an American businessman and politician from Dover, in Kent County, Delaware. He was a veteran of World War I and member of the Republican Party, who served in the Delaware General Assembly and as Governor of Delaware.
The 1910–11 United States Senate election were held on various dates in various states. As these U.S. Senate elections were prior to the ratification of the Seventeenth Amendment in 1913, senators were primarily chosen by state legislatures. Senators were elected over a wide range of time throughout 1910 and 1911, and a seat may have been filled months late or remained vacant due to legislative deadlock. However, some states had already begun direct elections during this time. Oregon pioneered direct election and experimented with different measures over several years until it succeeded in 1907. Soon after, Nebraska followed suit and laid the foundation for other states to adopt measures reflecting the people's will. By 1912, as many as 29 states elected senators either as nominees of their party's primary or in conjunction with a general election.
The Republican State Committee of Delaware is the affiliate of the United States Republican Party in Delaware. It has five regional offices in Kent County, Western New Castle County, Central New Castle County, Northern New Castle County, and Sussex County.
The 1858–59 United States Senate elections were held on various dates in various states. As these U.S. Senate elections were prior to the ratification of the Seventeenth Amendment in 1913, senators were chosen by state legislatures. Senators were elected over a wide range of time throughout 1858 and 1859, and a seat may have been filled months late or remained vacant due to legislative deadlock. In these elections, terms were up for the senators in Class 2.
The 1872–73 United States Senate elections were held on various dates in various states, coinciding with President Ulysses S. Grant's re-election. As these U.S. Senate elections were prior to the ratification of the Seventeenth Amendment in 1913, senators were chosen by state legislatures. Senators were elected over a wide range of time throughout 1872 and 1873, and a seat may have been filled months late or remained vacant due to legislative deadlock. In these elections, terms were up for the senators in Class 3.
The 1868–69 United States Senate elections were held on various dates in various states. As these U.S. Senate elections were prior to the ratification of the Seventeenth Amendment in 1913, senators were chosen by state legislatures. Senators were elected over a wide range of time throughout 1868 and 1869, and a seat may have been filled months late or remained vacant due to legislative deadlock. In these elections, terms were up for the senators in Class 1.
The 1884–85 United States Senate elections were held on various dates in various states, coinciding with the presidential election of 1884. As these U.S. Senate elections were prior to the ratification of the Seventeenth Amendment in 1913, senators were chosen by state legislatures. Senators were elected over a wide range of time throughout 1884 and 1885, and a seat may have been filled months late or remained vacant due to legislative deadlock. In these elections, terms were up for the senators in Class 3.
The 1886–87 United States Senate elections were held on various dates in various states. As these U.S. Senate elections were prior to the ratification of the Seventeenth Amendment in 1913, senators were chosen by state legislatures. Senators were elected over a wide range of time throughout 1886 and 1887, and a seat may have been filled months late or remained vacant due to legislative deadlock. In these elections, terms were up for the senators in Class 1.
The 1892–93 United States Senate elections were held on various dates in various states, coinciding with former Democratic President Grover Cleveland's return to power. As these U.S. Senate elections were prior to the ratification of the Seventeenth Amendment in 1913, senators were chosen by state legislatures. Senators were elected over a wide range of time throughout 1892 and 1893, and a seat may have been filled months late or remained vacant due to legislative deadlock. In these elections, terms were up for the senators in Class 1.
The 1836–37 United States Senate elections were held on various dates in various states. As these U.S. Senate elections were prior to the ratification of the Seventeenth Amendment in 1913, senators were chosen by state legislatures. Senators were elected over a wide range of time throughout 1836 and 1837, and a seat may have been filled months late or remained vacant due to legislative deadlock. In these elections, terms were up for the senators in Class 3.
The 1876 United States elections were held on November 7. In one of the most disputed presidential elections in American history, Republican Governor Rutherford B. Hayes of Ohio ended up winning despite Democratic Governor Samuel J. Tilden of New York earning a majority of the popular vote. The Republicans maintained their Senate majority and cut into the Democratic majority in the House.
The 1884 United States elections were held on November 4, electing the members of the 49th United States Congress. The election took place during the Third Party System. The Democratic governor Grover Cleveland of New York defeated Republican secretary of state James G. Blaine in the presidential election. In Congress, the Republicans retained control of the Senate while Democrats maintained control of the House of Representatives. This marks the last election in U.S. history in which the Democratic president came to office without unified control of Congress.
The 1922 United States Senate election in Delaware took place on November 7, 1922. This election pitted Delaware's two most powerful families, the Republican du Ponts and the Democratic Bayards, against each other.