| ||||||||||||||||||||||||||||||||||||||||||||||||||||||||||||||||||||
36 of the 96 seats in the United States Senate 49 seats needed for a majority | ||||||||||||||||||||||||||||||||||||||||||||||||||||||||||||||||||||
---|---|---|---|---|---|---|---|---|---|---|---|---|---|---|---|---|---|---|---|---|---|---|---|---|---|---|---|---|---|---|---|---|---|---|---|---|---|---|---|---|---|---|---|---|---|---|---|---|---|---|---|---|---|---|---|---|---|---|---|---|---|---|---|---|---|---|---|---|
| ||||||||||||||||||||||||||||||||||||||||||||||||||||||||||||||||||||
|
The 1946 United States Senate elections were held November 5, 1946, in the middle of Democratic President Harry S. Truman's first term after Roosevelt's passing. The 32 seats of Class 1 were contested in regular elections, and four special elections were held to fill vacancies. The Republicans took control of the Senate by picking up twelve seats, mostly from the Democrats. This was the first time since 1932 that the Republicans had held the Senate, recovering from a low of 16 seats following the 1936 Senate elections.
The vote was largely seen as a referendum on Truman, whose approval rating had sunk to 32% [1] over the president's controversial handling of a wave of post-war labor strikes, such as a nationwide railroad strike in May, at a time when Americans depended on train service for both commuter and long-distance travel. Just as damaging was Truman's back-and-forth over whether to end unpopular wartime price controls to handle shortages, particularly in foodstuffs. For example, price controls on beef had led to a "hamburger famine," but when Truman, in a surprise move, lifted the controls on October 14—just weeks before the election—meat prices shot up to record levels.[ citation needed ]
This is only one of two occasions in U.S. history that 10 or more Senate seats changed hands in a midterm election (the other being in 1958), and also one of five occasions where 10 or more Senate seats changed hands in any election, with the other occasions being in 1920, 1932, 1958, and 1980.
The president's lack of popular support is widely seen as the reason for the Democrats' congressional defeat, the largest since they were trounced in the 1928 pro-Republican wave that brought Herbert Hoover to power. [2] [3] And for the first time since before the Great Depression, Republicans were seen as the party which could best handle the American economy.
However, the Republicans also benefited from what today would be called "a good map," meaning that of the one-third of Senate seats up for election, the majority were held by Democrats. Besides the Republicans being able to hold onto all of their seats, this was the party's largest senate gain since 1920.
45 | 51 |
Democratic | Republican |
Colored shading indicates party with largest share of that row.
Parties | Total | ||||||||||||||||||||||||||||||||||||||||||||||||||||||||||||||||||||||||||||||||||||||||||||||||||
---|---|---|---|---|---|---|---|---|---|---|---|---|---|---|---|---|---|---|---|---|---|---|---|---|---|---|---|---|---|---|---|---|---|---|---|---|---|---|---|---|---|---|---|---|---|---|---|---|---|---|---|---|---|---|---|---|---|---|---|---|---|---|---|---|---|---|---|---|---|---|---|---|---|---|---|---|---|---|---|---|---|---|---|---|---|---|---|---|---|---|---|---|---|---|---|---|---|---|---|
Democratic | Republican | Other | |||||||||||||||||||||||||||||||||||||||||||||||||||||||||||||||||||||||||||||||||||||||||||||||||
Last elections (1944) | 57 | 38 | 1 | 96 | |||||||||||||||||||||||||||||||||||||||||||||||||||||||||||||||||||||||||||||||||||||||||||||||
Before these elections | 56 | 39 | 1 | 96 | |||||||||||||||||||||||||||||||||||||||||||||||||||||||||||||||||||||||||||||||||||||||||||||||
Not up | 32 | 28 | 0 | 60 | |||||||||||||||||||||||||||||||||||||||||||||||||||||||||||||||||||||||||||||||||||||||||||||||
Up | 24 | 11 | 1 | 36 | |||||||||||||||||||||||||||||||||||||||||||||||||||||||||||||||||||||||||||||||||||||||||||||||
Class 1 (1940→1946) | 21 | 10 | 1 | 32 | |||||||||||||||||||||||||||||||||||||||||||||||||||||||||||||||||||||||||||||||||||||||||||||||
Special: Class 2 | 3 | 1 | — | 4 | |||||||||||||||||||||||||||||||||||||||||||||||||||||||||||||||||||||||||||||||||||||||||||||||
Incumbent retired | 4 | 4 | — | 8 | |||||||||||||||||||||||||||||||||||||||||||||||||||||||||||||||||||||||||||||||||||||||||||||||
Held by same party | 3 | 4 | — | 7 | |||||||||||||||||||||||||||||||||||||||||||||||||||||||||||||||||||||||||||||||||||||||||||||||
Replaced by other party | 1 Democrat replaced by 1 Republican | — | 1 | ||||||||||||||||||||||||||||||||||||||||||||||||||||||||||||||||||||||||||||||||||||||||||||||||
Result | 3 | 5 | 0 | 8 | |||||||||||||||||||||||||||||||||||||||||||||||||||||||||||||||||||||||||||||||||||||||||||||||
Incumbent ran | 20 | 7 | 1 | 28 | |||||||||||||||||||||||||||||||||||||||||||||||||||||||||||||||||||||||||||||||||||||||||||||||
Won re-election | 9 | 6 | 0 | 16 | |||||||||||||||||||||||||||||||||||||||||||||||||||||||||||||||||||||||||||||||||||||||||||||||
Lost re-election | 7 Democrats replaced by 7 Republicans | — | 7 | ||||||||||||||||||||||||||||||||||||||||||||||||||||||||||||||||||||||||||||||||||||||||||||||||
Lost renomination but held by same party | 1 | 1 | — | 2 | |||||||||||||||||||||||||||||||||||||||||||||||||||||||||||||||||||||||||||||||||||||||||||||||
Lost (re)nomination and party lost | 3 Democrats replaced by 3 Republicans 1 Progressive replaced by 1 Republican | 4 | |||||||||||||||||||||||||||||||||||||||||||||||||||||||||||||||||||||||||||||||||||||||||||||||||
Result | 10 | 18 | 0 | 28 | |||||||||||||||||||||||||||||||||||||||||||||||||||||||||||||||||||||||||||||||||||||||||||||||
Total elected | 13 | 23 | 0 | 36 | |||||||||||||||||||||||||||||||||||||||||||||||||||||||||||||||||||||||||||||||||||||||||||||||
Net change | 11 | 12 | 1 | 12 | |||||||||||||||||||||||||||||||||||||||||||||||||||||||||||||||||||||||||||||||||||||||||||||||
Nationwide vote | 12,062,433 | 15,489,926 | 1,142,765 | 28,695,124 | |||||||||||||||||||||||||||||||||||||||||||||||||||||||||||||||||||||||||||||||||||||||||||||||
Share | 42.04% | 53.98% | 3.98% | 100% | |||||||||||||||||||||||||||||||||||||||||||||||||||||||||||||||||||||||||||||||||||||||||||||||
Result | 45 | 51 | 0 | 96 |
Source: Clerk of the U.S. House of Representatives [4]
Three Republicans and five Democrats retired instead of seeking re-election.
One Republican, one Progressive, and ten Democrats sought re-election but lost in the primary or general election.
State | Senator | Replaced by |
---|---|---|
Louisiana | John H. Overton | William C. Feazel |
South Dakota | Harlan J. Bushfield | Vera C. Bushfield |
Mississippi | Theodore G. Bilbo | John C. Stennis |
D1 | D2 | D3 | D4 | D5 | D6 | D7 | D8 | ||
D18 | D17 | D16 | D15 | D14 | D13 | D12 | D11 | D10 | D9 |
D19 | D20 | D21 | D22 | D23 | D24 | D25 | D26 | D27 | D28 |
D38 Md. Ran | D37 Idaho (sp) Ran | D36 Fla. Ran | D35 Del. Ran | D34 Ariz. Ran | D33 Ala. (sp) Retired | D32 | D31 | D30 | D29 |
D39 Mass. Ran | D40 Miss. Ran | D41 Mo. Ran | D42 Mont. Ran | D43 Nev. Ran | D44 N.M. Ran | D45 N.Y. Retired | D46 Ohio (reg) Ohio (sp) Retired | D47 Pa. Ran | D48 R.I. Retired |
Majority → | D49 Tenn. Ran | ||||||||
R39 Vt. Ran | P1 Wis. Ran | D56 Wyo. Ran | D55 W.Va. Ran | D54 Wash. Ran | D53 Va. (sp) Retired | D52 Va. (reg) Ran | D51 Utah Ran | D50 Texas Ran | |
R38 N.D. (reg) Ran | R37 N.J. Ran | R36 Neb. Ran | R35 Minn. Ran | R34 Mich. Ran | R33 Maine Ran | R32 Ky. (sp) Retired | R31 Ind. Retired | R30 Conn. (reg) Conn. (sp) Retired | R29 Calif. (reg) Calif. (sp) Ran |
R19 | R20 | R21 | R22 | R23 | R24 | R25 | R26 | R27 | R28 |
R18 | R17 | R16 | R15 | R14 | R13 | R12 | R11 | R10 | R9 |
R1 N.D. (sp) Elected [a] | R2 | R3 | R4 | R5 | R6 | R7 | R8 |
D1 | D2 | D3 | D4 | D5 | D6 | D7 | D8 | ||
D18 | D17 | D16 | D15 | D14 | D13 | D12 | D11 | D10 | D9 |
D19 | D20 | D21 | D22 | D23 | D24 | D25 | D26 | D27 | D28 |
D38 N.M. Re-elected | D37 Miss. Re-elected | D36 Md. Hold | D35 Fla. Elected [b] | D34 Ariz. Re-elected | D33 Ala. (sp) Hold | D32 | D31 | D30 | D29 |
D39 R.I. Hold | D40 Tenn. Re-elected | D41 Texas Re-elected | D42 Va. (reg) Re-elected | D43 Va. (sp) Hold | D44 W.Va. Re-elected | D45 Wyo. Re-elected | R51 Wis. Gain | R50 Wash. Gain | R49 Utah Gain |
Majority → | |||||||||
R39 Vt. Elected [b] | R40 Del. Gain | R41 Idaho (sp) Gain | R42 Mass. Gain | R43 Mo. Gain [c] | R44 Mont. Gain | R45 Nev. Gain | R46 N.Y. Gain | R47 Ohio (reg) Gain Ohio (sp) Gain | R48 Pa. Gain |
R38 N.D. (reg) Re-elected | R37 N.J. Re-elected | R36 Neb. Re-elected | R35 Minn. Hold | R34 Mich. Re-elected | R33 Maine Re-elected | R32 Ky. (sp) Hold | R31 Ind. Hold | R30 Conn. (reg) Conn. (sp) Hold | R29 Calif. (reg) Calif. (sp) Elected [b] |
R19 | R20 | R21 | R22 | R23 | R24 | R25 | R26 | R27 | R28 |
R18 | R17 | R16 | R15 | R14 | R13 | R12 | R11 | R10 | R9 |
R1 | R2 | R3 | R4 | R5 | R6 | R7 | R8 |
Key |
|
---|
In these special elections, the winner was seated during 1946, ordered by election date, then state.
State | Incumbent | Results | Candidates | ||
---|---|---|---|---|---|
Senator | Party | Electoral history | |||
North Dakota (Class 3) | Milton Young | Republican | 1945 (Appointed) | Interim appointee elected June 25, 1946. |
|
Alabama (Class 2) | George R. Swift | Democratic | 1946 (Appointed) | Interim appointee retired. New senator elected November 5, 1946. Democratic hold. |
|
California (Class 1) | William Knowland | Republican | 1945 (Appointed) | Interim appointee elected November 5, 1946. Winner also elected to next term; see below. |
|
Connecticut (Class 1) | Thomas C. Hart | Republican | 1945 (Appointed) | Interim appointee retired. New senator elected November 5, 1946. Republican hold. Winner also elected to next term; see below. |
|
Idaho (Class 2) | Charles C. Gossett | Democratic | 1945 (Appointed) | Interim appointee lost nomination. New senator elected November 5, 1946. Republican gain. |
|
Kentucky (Class 2) | William A. Stanfill | Republican | 1945 (Appointed) | Interim appointee retired. New senator elected November 5, 1946. Republican hold. |
|
Ohio (Class 1) | James W. Huffman | Democratic | 1945 (Appointed) | Interim appointee retired. New senator elected November 5, 1946. Republican gain. Winner was not elected to the next term; see below. |
|
Virginia (Class 2) | Thomas G. Burch | Democratic | 1946 (Appointed) | Interim appointee retired. New senator elected November 5, 1946. Democratic hold. |
|
In these general elections, the winners were elected for the term beginning January 3, 1947; ordered by state.
All of the elections involved the Class 1 seats.
State | Incumbent | Results | Candidates | ||
---|---|---|---|---|---|
Senator | Party | Electoral history | |||
Arizona | Ernest McFarland | Democratic | 1940 | Incumbent re-elected. |
|
California | William Knowland | Republican | 1945 (Appointed) | Interim appointee elected. Winner also elected to finish term; see above. |
|
Connecticut | Thomas C. Hart | Republican | 1945 (Appointed) | Interim appointee retired. New senator elected. Republican hold. Winner also elected to finish term; see above. |
|
Delaware | James M. Tunnell | Democratic | 1940 | Incumbent lost re-election. New senator elected. Republican gain. |
|
Florida | Spessard Holland | Democratic | 1946 (Appointed) | Interim appointee elected. |
|
Indiana | Raymond E. Willis | Republican | 1940 | Incumbent retired. New senator elected. Republican hold. |
|
Maine | Owen Brewster | Republican | 1940 | Incumbent re-elected. |
|
Maryland | George L. P. Radcliffe | Democratic | 1934 1940 | Incumbent lost renomination. New senator elected. Democratic hold. |
|
Massachusetts | David I. Walsh | Democratic | 1918 1924 (Lost) 1926 (special) 1928 1934 1940 | Incumbent lost re-election. New senator elected. Republican gain. |
|
Michigan | Arthur Vandenberg | Republican | 1928 (special) 1928 1934 1940 | Incumbent re-elected. |
|
Minnesota | Henrik Shipstead | Republican | 1922 1928 1934 1940 | Incumbent lost renomination. New senator elected. Republican hold. |
|
Mississippi | Theodore G. Bilbo | Democratic | 1934 1940 | Incumbent re-elected. |
|
Missouri | Frank P. Briggs | Democratic | 1945 (Appointed) | Interim appointee lost election. New senator elected. Republican gain. |
|
Montana | Burton K. Wheeler | Democratic | 1922 1928 1934 1940 | Incumbent lost renomination. New senator elected. Republican gain. |
|
Nebraska | Hugh A. Butler | Republican | 1940 | Incumbent re-elected. |
|
Nevada | Edward P. Carville | Democratic | 1945 (Appointed) | Incumbent lost renomination. New senator elected. Republican gain. |
|
New Jersey | H. Alexander Smith | Republican | 1944 (special) | Incumbent re-elected. |
|
New Mexico | Dennis Chávez | Democratic | 1935 (Appointed) 1936 (special) 1940 | Incumbent re-elected. |
|
New York | James M. Mead | Democratic | 1940 | Incumbent retired to run for New York Governor. New senator elected. Republican gain. |
|
North Dakota | William Langer | Republican | 1940 | Incumbent re-elected. |
|
Ohio | James W. Huffman | Democratic | 1945 (Appointed) | Interim appointee retired. New senator elected. Republican gain. Winner was not elected to finish the term; see above. |
|
Pennsylvania | Joseph F. Guffey | Democratic | 1934 1940 | Incumbent lost re-election. New senator elected. Republican gain. |
|
Rhode Island | Peter G. Gerry | Democratic | 1934 1940 | Incumbent retired. New senator elected. Democratic hold. |
|
Tennessee | Kenneth McKellar | Democratic | 1916 1922 1928 1934 1940 | Incumbent re-elected. |
|
Texas | Tom Connally | Democratic | 1928 1934 1940 | Incumbent re-elected. |
|
Utah | Abe Murdock | Democratic | 1940 | Incumbent lost re-election. New senator elected. Republican gain. |
|
Vermont | Ralph Flanders | Republican | 1946 (Appointed) | Interim appointee elected. |
|
Virginia | Harry F. Byrd | Democratic | 1933 (Appointed) 1933 (special) 1934 1940 | Incumbent re-elected. |
|
Washington | Hugh Mitchell | Democratic | 1945 (Appointed) | Interim appointee lost election. New senator elected. Republican gain. Incumbent resigned December 25, 1946. Winner appointed December 26, 1946, to finish term. |
|
West Virginia | Harley M. Kilgore | Democratic | 1940 | Incumbent re-elected. |
|
Wisconsin | Robert M. La Follette Jr. | Progressive | 1925 (special) 1928 1934 1940 | Incumbent lost renomination as a Republican. New senator elected. Republican gain. |
|
Wyoming | Joseph C. O'Mahoney | Democratic | 1933 (Appointed) 1934 1940 | Incumbent re-elected. |
|
Ten races had a margin of victory under 10%:
State | Party of winner | Margin |
---|---|---|
Maryland | Democratic | 0.4% |
West Virginia | Democratic | 0.6% |
Utah | Republican (flip) | 2.4% |
New Mexico | Democratic | 3.0% |
New York | Republican (flip) | 5.0% |
Missouri | Republican (flip) | 5.6% [d] |
Kentucky | Republican | 6.8% |
Montana | Republican (flip) | 8.1% |
Washington | Republican (flip) | 9.1% |
California | Republican | 9.9% |
| |||||||||||||||||
| |||||||||||||||||
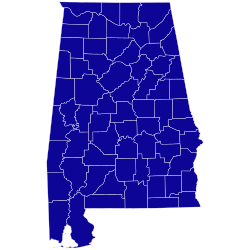
County results Sparkman: 100% | |||||||||||||||||
|
Party | Candidate | Votes | % | |
---|---|---|---|---|
Democratic | John Sparkman | 85,049 | 50.14% | |
Democratic | James A. Simpson | 46,762 | 27.57% | |
Democratic | Frank W. Boykin | 35,982 | 21.21% | |
Democratic | Ted Allen | 1,260 | 0.74% | |
Democratic | Thomas H. Maxwell | 585 | 0.35% | |
Total votes | 169,638 | 100.00% |
Party | Candidate | Votes | % | |
---|---|---|---|---|
Democratic | John Sparkman | 163,217 | 100.00% | |
Democratic hold |
| |||||||||||||||||
| |||||||||||||||||
County results McFarland: 60–70% 70–80% 80–90% | |||||||||||||||||
|
Incumbent Democrat Ernest McFarland ran for re-election to a second term, easily defeating Republican Ward S. Powers in the general election.
Party | Candidate | Votes | % | |
---|---|---|---|---|
Democratic | Ernest McFarland (incumbent) | 80,415 | 69.18% | |
Republican | Ward S. Powers | 35,022 | 30.13% | |
Communist | Morris Graham | 802 | 0.69% | |
Majority | 45,393 | 39.05% | ||
Turnout | 116,239 | |||
Democratic hold |
Party | Candidate | Votes | % | |
---|---|---|---|---|
Write-in | William F. Knowland (inc.) | 425,273 | 74.31% | |
Write-in | Will Rogers Jr. | 90,723 | 15.85% | |
Write-in | George H. McLain | 17,883 | 3.13% | |
Write-in | Ellis E. Patterson | 3,889 | 0.68% | |
Write-in | Douglas Corrigan | 2,464 | 0.43% | |
Write-in | Vic Paulsen | 1,616 | 0.28% | |
Write-in | Moody Staten | 1,494 | 0.26% | |
Write-in | Hartley F. Peart | 1,383 | 0.24% | |
Write-in | George C. Highley | 1,268 | 0.22% | |
Write-in | James Moran | 918 | 0.16% | |
Write-in | Ben Rinaldo | 765 | 0.13% | |
Write-in | Aubrey D. Lewis | 519 | 0.09% | |
Write-in | Frank Merriam | 507 | 0.09% | |
Write-in | All others | 23,619 | 4.13% | |
Total votes | 572,321 | 100.00% |
| |||||||||||||||||
| |||||||||||||||||
| |||||||||||||||||
County results Knowland: 40–50% 50-60% 60-70% 70-80% Rogers: 50–60% | |||||||||||||||||
|
Party | Candidate | Votes | % | |
---|---|---|---|---|
Republican | William Knowland (Incumbent) | 1,428,067 | 54.10% | |
Democratic | Will Rogers Jr. | 1,167,161 | 44.22% | |
Prohibition | Douglas Corrigan | 42,683 | 1.62% | |
Write-In | Herbert Steiner | 156 | 0.01% | |
None | Scattering | 1,398 | 0.05% | |
Majority | 260,906 | 9.88% | ||
Turnout | 2,639,465 | |||
Republican hold |
There were 2 elections for the same seat due to the January 16, 1945, death of Democrat Francis T. Maloney. Republican Thomas C. Hart was appointed February 15, 1945, to continue the term, pending a special election. Republican Governor of Connecticut Raymond E. Baldwin won both elections, but resigned only three years after the election to become a state judge.
| |||||||||||||||||
| |||||||||||||||||
Baldwin: 50-60% 60-70% 70-80% 80-90% 90-100% Tone: 50–60% 60-70% | |||||||||||||||||
|
Party | Candidate | Votes | % | |
---|---|---|---|---|
Republican | Raymond E. Baldwin | 381,328 | 55.84% | |
Democratic | Joseph M. Tone | 276,424 | 40.48% | |
Socialist | Frederick C. Smedley | 22,012 | 3.22% | |
Socialist Labor | John W. Aiken | 3,156 | 0,46% | |
Majority | 104,904 | 29.32% | ||
Turnout | 682,920 | |||
Republican hold |
Party | Candidate | Votes | % | |
---|---|---|---|---|
Republican | Raymond E. Baldwin | 378,707 | 55.77% | |
Democratic | Wilbur Lucius Cross | 278,188 | 40.97% | |
Socialist | Frederic C. Smedly | 22,164 | 3.26% | |
Majority | 100,519 | 14.80% | ||
Turnout | 679,059 | |||
Republican hold |
| |||||||||||||||||
| |||||||||||||||||
County results Williams: 50-60% | |||||||||||||||||
|
Party | Candidate | Votes | % | |
---|---|---|---|---|
Republican | John J. Williams | 62,603 | 55.15% | |
Democratic | James M. Tunnell (Incumbent) | 50,910 | 44.85% | |
Majority | 11,693 | 10.30% | ||
Turnout | 113,513 | |||
Republican gain from Democratic |
| |||||||||||||||||
| |||||||||||||||||
County results Holland: 50-60% 60-70% 70-80% 80-90% >90% | |||||||||||||||||
|
Party | Candidate | Votes | % | |
---|---|---|---|---|
Democratic | Spessard Holland (Incumbent) | 156,232 | 78.65% | |
Republican | J. Harry Schad | 42,408 | 21.35% | |
Majority | 113,824 | 57.30% | ||
Turnout | 198,640 | |||
Democratic hold |
| |||||||||||||||||
| |||||||||||||||||
County results Dworshak: 50–60% 60–70% 70–80% Donart: 50–60% 60–70% | |||||||||||||||||
|
Party | Candidate | Votes | % | |
---|---|---|---|---|
Republican | Henry Dworshak | 105,523 | 58.57% | |
Democratic | George E. Donart | 74,629 | 41.43% | |
Majority | 30,894 | 17.14% | ||
Turnout | 180,152 | |||
Republican gain from Democratic |
| |||||||||||||||||
| |||||||||||||||||
County results Jenner: 40–50% 50–60% 60–70% 70–80% Townsend: 40–50% 50–60% | |||||||||||||||||
|
Party | Candidate | Votes | % | |
---|---|---|---|---|
Republican | William E. Jenner | 739,809 | 54.91% | |
Democratic | M. Clifford Townsend | 584,288 | 43.36% | |
Prohibition | Elmer D. Riggs | 21,008 | 1.56% | |
Socialist Labor | John Marion Morris | 1,523 | 0.11% | |
Communist | Elmer G. Johnson | 806 | 0.06% | |
Majority | 155,521 | 15.55% | ||
Turnout | 1,347,434 | |||
Republican hold |
| |||||||||||||||||
| |||||||||||||||||
County results Cooper: 50–60% 60–70% 70–80% 80–90% >90% Brown: 50–60% 60–70% 70–80% 80–90% | |||||||||||||||||
|
Party | Candidate | Votes | % | |
---|---|---|---|---|
Republican | John Sherman Cooper | 327,652 | 53.27% | |
Democratic | John Young Brown | 285,829 | 46.47% | |
Socialist | W. E. Sandefur | 1,638 | 0.27% | |
Majority | 41,823 | 6.80% | ||
Turnout | 615,119 | |||
Republican hold |
| |||||||||||||||||
| |||||||||||||||||
County Results Brewster: 50–60% 60–70% 70–80% 80–90% McDonald: 50–60% | |||||||||||||||||
|
Party | Candidate | Votes | % | |
---|---|---|---|---|
Republican | Ralph Owen Brewster (Incumbent) | 111,215 | 63.55% | |
Democratic | Peter M. MacDonald | 63,799 | 36.45% | |
Majority | 47,416 | 27.10% | ||
Turnout | 175,014 | |||
Republican hold |
| |||||||||||||||||
| |||||||||||||||||
County results Markey: 50–60% 60–70% O'Conor: 50–60% | |||||||||||||||||
|
Party | Candidate | Votes | % | |
---|---|---|---|---|
Democratic | Herbert O'Conor | 237,232 | 50.24% | |
Republican | D. John Markey | 235,000 | 49.76% | |
Majority | 2,232 | 0.48% | ||
Turnout | 472,232 | |||
Democratic hold |
| |||||||||||||||||
| |||||||||||||||||
Lodge: 40–50% 50–60% 60–70% 70–80% 80–90% 90–100% Walsh: 50–60% 60–70% | |||||||||||||||||
|
Republican Henry Cabot Lodge Jr. defeated incumbent David I. Walsh.
Party | Candidate | Votes | % | |
---|---|---|---|---|
Republican | Henry Cabot Lodge Jr. | 989,736 | 59.55 | |
Democratic | David I. Walsh (Incumbent) | 660,200 | 39.72 | |
Socialist Labor | Henning A. Blomen | 9,221 | 0.56 | |
Prohibition | Mark R. Shaw | 2,898 | 0.17 | |
Majority | 329,536 | 19.83% | ||
Turnout | 1,662,055 | |||
Republican gain from Democratic |
| |||||||||||||||||
| |||||||||||||||||
County results Vandenberg: 50–60% 60–70% 70–80% 80–90% | |||||||||||||||||
|
Party | Candidate | Votes | % | |
---|---|---|---|---|
Republican | Arthur Vandenberg (Incumbent) | 1,985,570 | 67.06% | |
Democratic | James H. Lee | 517,923 | 32.00% | |
Prohibition | Lawrence A. Ruble | 8,109 | 0.50% | |
Socialist Labor | Theos A. Grove | 4,572 | 0.28% | |
Communist | Hugo Beiswenger | 2,546 | 0.16% | |
Majority | 1,467,647 | 35.06% | ||
Turnout | 1,618,720 | |||
Republican hold |
| |||||||||||||||||
| |||||||||||||||||
County results Thye: 50–60% 60–70% 70–80% 80–90% Jorgenson: 40–50% 50–60% 60–70% | |||||||||||||||||
|
Party | Candidate | Votes | % | |
---|---|---|---|---|
Republican | Edward John Thye | 517,775 | 58.92% | |
Democratic (DFL) | Theodore Jorgenson | 349,520 | 39.78% | |
Revolutionary Workers | Grace Carlson | 11,421 | 1.30% | |
Write-In | Henrik Shipstead (Incumbent) | 15 | 0.00% | |
Majority | 168,255 | 19.14% | ||
Turnout | 878,731 | |||
Republican hold |
| |||||||||||||||||||||||||||||||||||||
| |||||||||||||||||||||||||||||||||||||
| |||||||||||||||||||||||||||||||||||||
County results Bilbo: 30-40% 40-50% 50-60% 60-70% 70-80% 80-90% Ellis: 40-50% 50-60% 60-70% | |||||||||||||||||||||||||||||||||||||
|
Party | Candidate | Votes | % | |
---|---|---|---|---|
Democratic | Theodore G. Bilbo (Incumbent) | 46,747 | 100.00% | |
Democratic hold |
| |||||||||||||||||
| |||||||||||||||||
County results Kem: 50–60% 60–70% 70–80% 80–90% Briggs: 50–60% 60–70% 70–80% 80–90% | |||||||||||||||||
|
Party | Candidate | Votes | % | |
---|---|---|---|---|
Republican | James P. Kem | 572,556 | 52.71% | |
Democratic | Frank P. Briggs (Incumbent) | 411,544 | 47.09% | |
Prohibition | Jackson | 979 | 0.09% | |
Socialist | W. F. Rinck | 887 | 0.08% | |
Socialist Labor | Baeff | 275 | 0.03% | |
Majority | 61,012 | 5.62% | ||
Turnout | 1,086,241 | |||
Republican gain from Democratic |
| |||||||||||||||||
| |||||||||||||||||
County results Ecton: 50–60% 60–70% 70–80% Erickson: 40–50% 50–60% 60–70% No data | |||||||||||||||||
|
Party | Candidate | Votes | % | |
---|---|---|---|---|
Republican | Zales Ecton | 101,901 | 53.47% | |
Democratic | Leif Erickson | 86,476 | 45.38% | |
Socialist | Floyd P. Jones | 2,189 | 1.15% | |
Majority | 15,425 | 8.09% | ||
Turnout | 190,566 | |||
Republican gain from Democratic |
| |||||||||||||||||
| |||||||||||||||||
County results Butler: 50–60% 60–70% 70–80% 80–90% Mekota: 60–70% | |||||||||||||||||
|
Party | Candidate | Votes | % | |
---|---|---|---|---|
Republican | Hugh Butler (Incumbent) | 271,208 | 70.82% | |
Democratic | John E. Mekota | 111,751 | 29.18% | |
Majority | 159,457 | 41.64% | ||
Turnout | 382,958 | |||
Republican hold |
| |||||||||||||||||
| |||||||||||||||||
County results Malone: 50–60% 60–70% 70–80% Bunker: 50–60% 60–70% | |||||||||||||||||
|
Party | Candidate | Votes | % | |
---|---|---|---|---|
Republican | George W. Malone | 27,801 | 55.21% | |
Democratic | Berkeley L. Bunker | 22,553 | 44.79% | |
Majority | 5,248 | 10.42% | ||
Turnout | 50,354 | |||
Republican gain from Democratic |
| |||||||||||||||||
| |||||||||||||||||
County Results Smith: 50-60% 60-70% 70-80% 80–90% Brunner: 50–60% 60–70% | |||||||||||||||||
|
Party | Candidate | Votes | % | |
---|---|---|---|---|
Republican | H. Alexander Smith (Incumbent) | 799,808 | 58.50% | |
Democratic | George E. Brunner | 548,458 | 40.12% | |
Socialist Labor | John C. Butterworth | 7,675 | 0.56% | |
Socialist Workers | George Breitman | 4,976 | 0.36% | |
Socialist | Arthur Riley | 2,226 | 0.16% | |
Prohibition | George W. Ridout | 1,711 | 0.13% | |
Anti-Medical Trust Federation | Frederick W. Collins | 1,676 | 0.12% | |
Independent American | Mark M. Jones | 625 | 0.05% | |
Majority | 251,350 | 18.38% | ||
Turnout | 1,367,155 | |||
Republican hold |
| |||||||||||||||||
| |||||||||||||||||
County results Chevez: 50–60% 60–70% Hurley: 50–60% 60–70% | |||||||||||||||||
|
Party | Candidate | Votes | % | |
---|---|---|---|---|
Democratic | Dennis Chávez (Incumbent) | 68,650 | 51.51% | |
Republican | Patrick J. Hurley | 64,632 | 48.49% | |
Majority | 4,018 | 3.02% | ||
Turnout | 133,282 | |||
Democratic hold |
| ||||||||||||||||||||
| ||||||||||||||||||||
| ||||||||||||||||||||
County results Ives: 50–60% 60–70% 70–80% 80–90% Lehman: 50–60% 60–70% | ||||||||||||||||||||
|
The New York state election was held on November 5, 1946.
The Socialist Labor state convention met on April 7 and nominated Eric Hass for the U.S.Senate. [14] The party filed a petition to nominate candidates under the name "Industrial Government Party."
The Liberal Party gathered 51,015 signatures and filed a petition to nominate candidates with the Secretary of State on September 2. [15]
The Republican state convention met on September 4 at Saratoga Springs, New York. They nominated Assembly Majority Leader Irving M. Ives. [16]
The Democratic state convention met on September 4 at Albany, New York, and nominated Ex-Governor Herbert H. Lehman (in office 1933–1942) for the U.S. Senate. [17]
The American Labor state convention met on September 3 and endorsed Lehman. [18] Fielding, Chapman and Abt were withdrawn from the ticket on September 5, and Democrats Corning, Young and Epstein substituted on the ticket. [19]
The Socialist Workers Party filed a petition to nominate candidates headed by Farrell Dobbs for Governor.
The Industrial Government, Socialist and Socialist Workers tickets were not allowed on the ballot because of "defective nominating petitions." The Court of Appeals upheld the decisions of the lower courts. [20]
The whole Republican ticket was elected in a landslide.
Party | Candidate | Votes | % | ±% | |
---|---|---|---|---|---|
Republican | Irving M. Ives | 2,559,365 | 52.58% | 5.92% | |
Total | Herbert Lehman | 2,308,112 | 47.42% | 5.16% | |
Democratic | Herbert Lehman | 1,688,887 | 34.70% | ||
American Labor | Herbert Lehman | 435,846 | 8.95% | ||
Liberal | Herbert Lehman | 183,379 | 3.77% | ||
Total votes | 4,867,477 | 36.14% | |||
Republican gain from Democratic |
Obs.:
| |||||||||||||||||||||
| |||||||||||||||||||||
County results Young: 40-50% 50-60% 60-70% 70-80% | |||||||||||||||||||||
|
Newly-elected Democrat John Moses had died March 3, 1945, and Republican state senator Milton Young was appointed March 12, 1945, to continue the term, pending a special election.
Young was elected June 25, 1946, to finish the term that would end in 1951.
Party | Candidate | Votes | % | |
---|---|---|---|---|
Republican | Milton Young (Incumbent) | 75,998 | 55.53 | |
Democratic | Bill Lanier | 37,507 | 27.41 | |
Independent | Gerald P. Nye | 20,848 | 15.23 | |
Independent | E.A. Johansson | 2,473 | 1.81 | |
None | Scattering | 26 | 0.02 | |
Majority | 38,491 | 28.13 | ||
Turnout | 136,852 | |||
Republican hold |
Young would go on to be elected 5 more times, serving until his 1981 retirement.
| |||||||||||||||||||||
| |||||||||||||||||||||
County results Langer: 30-40% 40-50% 50-60% 60-70% 70-80% | |||||||||||||||||||||
|
First-term Republican William Langer was re-elected to a second term.
Party | Candidate | Votes | % | |
---|---|---|---|---|
Republican | William Langer (Incumbent) | 88,210 | 53.34 | |
Independent | Arthur E. Thompson | 38,804 | 23.46 | |
Democratic | Abner B. Larson | 38,368 | 23.20 | |
Majority | 49,406 | 29.88 | ||
Turnout | 165,382 | |||
Republican hold |
Langer would be re-elected twice more, serving until his 1959 death.
There were 2 elections to the same seat due to the September 30, 1945, resignation of Republican Harold H. Burton.
Democrat James W. Huffman was appointed to continue the term, pending a special election in which Huffman was not a candidate. Huffman was, however, nominated to the regular election, [23] which he lost.
Party | Candidate | Votes | % | |
---|---|---|---|---|
Republican | Kingsley A. Taft | 1,193,852 | 56.22% | |
Democratic | Henry P. Webber | 929,584 | 43.78% | |
Majority | 264,268 | 12.44% | ||
Turnout | 2,123,436 | |||
Republican gain from Democratic |
| |||||||||||||||||
| |||||||||||||||||
|
Party | Candidate | Votes | % | |
---|---|---|---|---|
Republican | John W. Bricker | 1,275,774 | 57.02% | |
Democratic | James W. Huffman (Incumbent) | 947,610 | 42.36% | |
Socialist Labor | William Farkas | 13,885 | 0.62% | |
Majority | 328,164 | 14.66% | ||
Turnout | 2,237,269 | |||
Republican gain from Democratic |
| |||||||||||||||||
| |||||||||||||||||
County results Cooke: 40–50% 50–60% 60–70% 70–80% 80–90% Guffey: 40–50% 50–60% | |||||||||||||||||
|
Incumbent Democrat Joseph F. Guffey lost re-election to Republican Edward Martin.
Party | Candidate | Votes | % | ±% | ||
---|---|---|---|---|---|---|
Republican | Edward Martin | 1,853,458 | 59.26% | +11.90% | ||
Democratic | Joseph F. Guffey (Incumbent) | 1,245,338 | 39.81% | −11.98% | ||
Prohibition | Dale H. Learn | 17,451 | 0.56% | +0.28% | ||
Socialist Labor | Frank Knotek | 11,613 | 0.37% | +0.31% | ||
Majority | 608,120 | 19.45% | ||||
Turnout | 3,127,860 | |||||
Republican gain from Democratic |
Party | Candidate | Votes | % | |
---|---|---|---|---|
Democratic | J. Howard McGrath | 150,748 | 55.11% | |
Republican | W. Gurnee Dwyer | 122,780 | 44.89% | |
Majority | 27,968 | 10.22% | ||
Turnout | 273,528 | |||
Democratic hold |
| |||||||||||||||||||||
| |||||||||||||||||||||
County results McKellar: 40–50% 50–60% 60–70% 70–80% 80–90% >90% Ladd: 40–50% 50–60% 60–70% | |||||||||||||||||||||
|
Party | Candidate | Votes | % | |
---|---|---|---|---|
Democratic | Kenneth D. McKellar (Incumbent) | 145,654 | 66.60% | |
Republican | William B. Ladd | 57,238 | 26.17% | |
Independent | John Randolph Neal Jr. | 11,516 | 5.27% | |
Independent | Herman H. Ross | 4,303 | 1.97% | |
None | Scattering | 3 | 0.00% | |
Majority | 88,416 | 40.43% | ||
Turnout | 218,714 | |||
Democratic hold |
| |||||||||||||||||
| |||||||||||||||||
|
Party | Candidate | Votes | % | |
---|---|---|---|---|
Democratic | Tom Connally (Incumbent) | 336,931 | 88.51% | |
Republican | Murray C. Sells | 43,750 | 11.49% | |
Majority | 293,181 | 77.02% | ||
Turnout | 380,681 | |||
Democratic hold |
| |||||||||||||||||
| |||||||||||||||||
County results Watkins: 50–60% 70–80% Murdock: 50–60% 60–70% | |||||||||||||||||
|
Party | Candidate | Votes | % | |
---|---|---|---|---|
Republican | Arthur Vivian Watkins | 101,142 | 51.24% | |
Democratic | Abe Murdock (incumbent) | 96,257 | 48.76% | |
Majority | 4,885 | 2.48% | ||
Turnout | 197,399 | |||
Republican gain from Democratic |
| |||||||||||||||||
| |||||||||||||||||
Municipality Results Flanders: 50–60% 60–70% 70–80% 80–90% >90% McDevitt: 50–60% 60–70% | |||||||||||||||||
|
Incumbent Republican Ralph Flanders successfully ran for re-election to a full term in the United States Senate, defeating Democratic candidate Charles P. McDevitt.
Party | Candidate | Votes | % | |
---|---|---|---|---|
Republican | Ralph Flanders (inc.) | 54,729 | 74.62% | |
Democratic | Charles P. McDevitt | 18,594 | 25.35% | |
None | Scattering | 17 | 0.02% | |
Majority | 36,135 | 49.27% | ||
Total votes | 73,340 | |||
Republican hold |
| |||||||||||||||||
| |||||||||||||||||
County and Independent City Results Byrd: 40-50% 50-60% 60-70% 70-80% 80-90% 90-100% | |||||||||||||||||
|
Incumbent Harry F. Byrd Sr. was re-elected to a fourth term after defeating Republican Lester S. Parsons.
Party | Candidate | Votes | % | ±% | |
---|---|---|---|---|---|
Democratic | Harry F. Byrd Sr. (Incumbent) | 163,960 | 64.84% | −28.48% | |
Republican | Lester S. Parsons | 77,005 | 30.45% | +30.45% | |
Independent | Howard Carwile | 5,189 | 2.05% | ||
Communist | Alice Burke | 3,318 | 1.31% | −1.50% | |
Prohibition | Thomas E. Boorde | 1,764 | 0.70% | +0.70% | |
Socialist | Clarke T. Robb | 1,592 | 0.63% | +0.63% | |
Write-ins | 35 | 0.01% | −0.06% | ||
Majority | 86,955 | 34.39% | −55.14% | ||
Turnout | 252,863 | ||||
Democratic hold |
| |||||||||||||||||
| |||||||||||||||||
|
Appointed Democrat Thomas G. Burch retired after filling the vacancy caused by the May 28, 1946, death of Democrat Carter Glass. Democrat Absalom Willis Robertson defeated Republican Robert H. Woods and was elected to finish Glass's term.
Party | Candidate | Votes | % | ±% | |
---|---|---|---|---|---|
Democratic | Absalom Willis Robertson | 169,680 | 68.15% | −22.93% | |
Republican | Robert H. Woods | 72,253 | 29.02% | +29.02% | |
Socialist | Lawrence S. Wilkes | 7,024 | 2.82% | −3.71% | |
Write-ins | 5 | <0.01% | |||
Majority | 97,427 | 39.13% | −45.42% | ||
Turnout | 248,962 | ||||
Democratic hold |
| |||||||||||||||||
| |||||||||||||||||
| |||||||||||||||||
County results Cain: 40–50% 50–60% 60–70% 70–80% Mitchell: 50–60% | |||||||||||||||||
|
Party | Candidate | Votes | % | |
---|---|---|---|---|
Republican | Harry P. Cain | 358,847 | 54.34% | |
Democratic | Hugh B. Mitchell (Incumbent) | 298,683 | 45.23% | |
Socialist Labor | Harry Morton | 2,297 | 0.35% | |
Socialist Workers | Charles R. Swett | 515 | 0.08% | |
Majority | 60,164 | 9.11% | ||
Turnout | 660,342 | |||
Republican gain from Democratic |
| |||||||||||||||||
| |||||||||||||||||
County results Kilgore: 50–60% 60–70% Sweeney: 50–60% 60–70% 70–80% 80–90% | |||||||||||||||||
|
Party | Candidate | Votes | % | |
---|---|---|---|---|
Democratic | Harley M. Kilgore (Incumbent) | 273,151 | 50.33% | |
Republican | Thomas Sweeney | 269,617 | 49.67% | |
Majority | 3,534 | 0.66% | ||
Turnout | 542,768 | |||
Democratic hold |
| |||||||||||||||||
| |||||||||||||||||
County results McCarthy: 50–60% 60–70% 70–80% 80–90% McMurray: 50–60% | |||||||||||||||||
|
Three-term incumbent Republican Robert La Follette Jr. lost renomination to Joseph McCarthy, who then won the general election.
}
Party | Candidate | Votes | % | |
---|---|---|---|---|
Republican | Joseph McCarthy | 207,935 | 47.25% | |
Republican | Robert M. La Follette Jr. (Incumbent) | 202,557 | 46.03% | |
Republican | Perry J. Stearns | 29,605 | 6.73% | |
Turnout | 440,097 |
Party | Candidate | Votes | % | ||
---|---|---|---|---|---|
Republican | Joseph McCarthy | 620,430 | 61.15% | ||
Democratic | Howard J. McMurray | 378,772 | 37.33% | ||
Socialist | Edwin Knappe | 11,750 | 1.16% | ||
Socialist Labor | Georgia Cozzini | 1,552 | 0.15% | ||
None | Scattering | 2,090 | 0.21% | ||
Majority | 241,658 | 23.82% | |||
Turnout | 1,014,594 | ||||
Republican hold |
| |||||||||||||||||
| |||||||||||||||||
County results O'Mahoney: 50–60% 60–70% Henderson: 50–60% 60–70% | |||||||||||||||||
|
Party | Candidate | Votes | % | |
---|---|---|---|---|
Democratic | Joseph C. O'Mahoney (Incumbent) | 45,843 | 56.21% | |
Republican | Harry B. Henderson | 35,714 | 43.79% | |
Majority | 10,129 | 12.42% | ||
Turnout | 81,557 | |||
Democratic hold |
The 1990 United States Senate elections were held on Tuesday, November 6, 1990, with the 33 seats of Class 2 contested in regular elections. Special elections were also held to fill vacancies. The Democratic Party increased its majority with a net gain of one seat from the Republican Party. The election cycle took place in the middle of President George H. W. Bush's term, and as with most other midterm elections, the party not holding the presidency gained seats in Congress. This was the first time since 1980 that any party successfully defended all their own seats, and the first time Democrats did so since 1958.
The 1988 United States Senate elections were elections for the United States Senate. Held on November 8, 1988, the 33 seats of Class 1 were contested in regular elections. In spite of the Republican victory by George H. W. Bush in the presidential election, the Democrats gained a net of 1 seat in the Senate. 7 seats changed parties, with 4 incumbents being defeated. The Democratic majority in the Senate increased by one to 55–45.
The 1986 United States Senate elections were elections for the United States Senate. Held on November 4, in the middle of Ronald Reagan's second presidential term, the 34 seats of Class 3 were contested in regular elections. The Republicans had to defend an unusually large number of freshman Senate incumbents who had been elected on President Ronald Reagan's coattails in 1980. Democrats won a net of eight seats, defeating seven freshman incumbents, picking up two Republican-held open seats, and regaining control of the Senate for the first time since January 1981. This remains the most recent midterm election cycle in which the sitting president's party suffered net losses while still flipping a Senate seat.
The 1984 United States Senate elections were held on November 6, with the 33 seats of Class 2 contested in regular elections. They coincided with the landslide re-election of President Ronald Reagan in the presidential election. In spite of the lopsided presidential race, Reagan's Republican Party suffered a net loss of two Senate seats to the Democrats, although it retained control of the Senate with a reduced 53–47 majority.
The 1980 United States Senate elections were held on November 4, coinciding with Ronald Reagan's victory in the presidential election. The 34 Senate seats of Class 3 were contested in regular elections. Reagan's large margin of victory over incumbent Jimmy Carter gave a huge boost to Republican Senate candidates, allowing them to flip 12 Democratic seats and win control of the chamber for the first time since the end of the 83rd Congress in January 1955. This was the first time since 1966 that any party successfully defended all their own seats.
The 1978 United States Senate elections were held on November 7, in the middle of Democratic President Jimmy Carter's term. The 33 seats of Class 2 were contested in regular elections. Special elections were also held to fill vacancies.
The 1976 United States Senate elections was an election for the United States Senate. Held on November 2, the 33 seats of Class 1 were contested in regular elections. They coincided with Democrat Jimmy Carter's presidential election and the United States Bicentennial celebration. Although almost half of the seats decided in this election changed parties, Carter's narrow victory did not provide coattails for the Democratic Party. Each party flipped seven Senate seats, although, one of the seats flipped by Democrats was previously held by a Conservative.
The 1972 United States Senate elections were held on November 7, with the 33 seats of Class 2 contested in regular elections. They coincided with the landslide re-election of Republican President Richard Nixon. Despite Nixon's landslide victory, Democrats increased their majority by two seats. The Democrats picked up open seats in Kentucky and South Dakota, and defeated four incumbent senators: Gordon Allott of Colorado, J. Caleb Boggs of Delaware, Jack Miller of Iowa, and Margaret Chase Smith of Maine. The Republicans picked up open seats in New Mexico, North Carolina, and Oklahoma, and defeated one incumbent, William B. Spong Jr. of Virginia.
The 1964 United States Senate elections were held on November 3. The 33 seats of Class 1 were contested in regular elections. Special elections were also held to fill vacancies. They coincided with the election of President Lyndon B. Johnson by an overwhelming majority, to a full term. His Democratic Party picked up a net two seats from the Republicans. As of 2023, this was the last time either party has had a two-thirds majority in the Senate, which allowed the Senate Democrats to override a veto, propose constitutional amendments, or convict and expel certain officials without any votes from Senate Republicans. However, internal divisions would have prevented the Democrats from having done so. The Senate election cycle coincided with Democratic gains in the House in the same year.
The 1958 United States Senate elections were elections for the United States Senate which occurred in the middle of President Dwight D. Eisenhower's second term. Thirty-two seats of Class 1 were contested in regular elections, the new state of Alaska held its first Senate elections for its Class 2 and 3 seats, and two special elections were held to fill vacancies.
The 1954 United States Senate elections was a midterm election in the first term of Dwight D. Eisenhower's presidency. The 32 Senate seats of Class 2 were contested in regular elections, and six special elections were held to fill vacancies. Eisenhower's Republican party lost a net of two seats to the Democratic opposition. This small change was just enough to give Democrats control of the chamber with the help of the Independent who at the start of this Congress in January 1955 agreed to caucus with them; he later officially joined the party in April 1955.
The 1952 United States Senate elections was an election for the United States Senate which coincided with the election of Dwight D. Eisenhower to the presidency by a large margin. The 32 Senate seats of Class 1 were contested in regular elections, and three special elections were held to fill vacancies. The Republicans took control of the Senate by managing to make a net gain of two seats. However, Wayne Morse (R-OR) became an independent forcing Republicans to rely on Vice President Richard Nixon's tie-breaking vote, although Republicans maintained a 48–47–1 plurality. Wayne Morse would caucus with the Republicans at the start of Congress’ second session on January 6, 1954 to allow the GOP to remain in control of the Senate. This was the third time, as well as second consecutive, in which a sitting Senate leader lost his seat.
The 1950 United States Senate elections occurred in the middle of Harry S. Truman's second term as president. The 32 seats of Class 3 were contested in regular elections, and four special elections were held to fill vacancies. As with most 20th-century second-term midterms, the party not holding the presidency made significant gains. The Republican opposition made a net gain of five seats, taking advantage of the Democratic administration's declining popularity during the Cold War and the aftermath of the Recession of 1949. The Democrats held a narrow 49-to-47-seat majority after the election. This was the first time since 1932 that the Senate majority leader lost his seat, and the only instance of the majority leader losing his seat while his party retained the majority.
The 1938 United States Senate elections occurred in the middle of Franklin D. Roosevelt's second term. The 32 seats of Class 3 were contested in regular elections, and special elections were held to fill vacancies. The Republicans gained eight seats from the Democrats, though this occurred after multiple Democratic gains since the 1932 election, leading to the Democrats retaining a commanding lead over the Republicans with more than two-thirds of the legislative chamber.
The 1934 United States Senate elections were held in the middle of Democratic President Franklin D. Roosevelt's first term. The 32 seats of Class 1 were contested in regular elections, and special elections were held to fill vacancies. During the Great Depression, voters strongly backed Roosevelt's New Deal and his allies in the Senate, with Democrats picking up a net of nine seats, giving them a supermajority. Republicans later lost three more seats due to mid-term vacancies ; however, a Democrat in Iowa died and the seat remained vacant until the next election. The Democrats entered the next election with a 70-22-2-1 majority.
The 1932 United States Senate elections coincided with Democrat Franklin D. Roosevelt's landslide victory over incumbent Herbert Hoover in the presidential election. The 32 seats of Class 3 were contested in regular elections, and special elections were held to fill vacancies.
The 1930 United States Senate elections occurred in the middle of Republican President Herbert Hoover's term. The 32 seats of Class 2 were contested in regular elections, and special elections were held to fill vacancies. With the Great Depression beginning to take hold, Republican incumbents became unpopular, and Democrats picked up a net of eight seats, erasing the Republican gains from the previous election cycle, however, Republicans retained control of the chamber. This was the first of four consecutive Senate elections during the Depression in which Democrats made enormous gains, achieving a cumulative pick-up of 34 seats.
The 1932 United States House of Representatives elections were elections for the United States House of Representatives to elect members to serve in the 73rd United States Congress. They were held for the most part on November 8, 1932, while Maine held theirs on September 12. They coincided with the landslide election of President Franklin D. Roosevelt.
The 1910–11 United States Senate election were held on various dates in various states. As these U.S. Senate elections were prior to the ratification of the Seventeenth Amendment in 1913, senators were primarily chosen by state legislatures. Senators were elected over a wide range of time throughout 1910 and 1911, and a seat may have been filled months late or remained vacant due to legislative deadlock. However, some states had already begun direct elections during this time. Oregon pioneered direct election and experimented with different measures over several years until it succeeded in 1907. Soon after, Nebraska followed suit and laid the foundation for other states to adopt measures reflecting the people's will. By 1912, as many as 29 states elected senators either as nominees of their party's primary or in conjunction with a general election.
The 1908–09 United States Senate elections were held on various dates in various states. As these U.S. Senate elections were prior to the ratification of the Seventeenth Amendment in 1913, senators were primarily chosen by state legislatures. Senators were elected over a wide range of time throughout 1906 and 1907, and a seat may have been filled months late or remained vacant due to legislative deadlock. However, some states had already begun direct elections during this time. Oregon pioneered direct election and experimented with different measures over several years until it succeeded in 1907. Soon after, Nebraska followed suit and laid the foundation for other states to adopt measures reflecting the people's will. By 1912, as many as 29 states elected senators either as nominees of their party's primary or in conjunction with a general election.