![]() | |||||||||||||||||||||||||||||||||||||||||||||||||||||||||||||||||||||||
| |||||||||||||||||||||||||||||||||||||||||||||||||||||||||||||||||||||||
33 of the 100 seats in the United States Senate 51 seats needed for a majority | |||||||||||||||||||||||||||||||||||||||||||||||||||||||||||||||||||||||
---|---|---|---|---|---|---|---|---|---|---|---|---|---|---|---|---|---|---|---|---|---|---|---|---|---|---|---|---|---|---|---|---|---|---|---|---|---|---|---|---|---|---|---|---|---|---|---|---|---|---|---|---|---|---|---|---|---|---|---|---|---|---|---|---|---|---|---|---|---|---|---|
| |||||||||||||||||||||||||||||||||||||||||||||||||||||||||||||||||||||||
![]() Results of the elections: Democratic gain Republican gain Democratic hold Republican hold Independent hold No election | |||||||||||||||||||||||||||||||||||||||||||||||||||||||||||||||||||||||
|
The 1976 United States Senate elections was an election for the United States Senate. Held on November 2, the 33 seats of Class 1 were contested in regular elections. They coincided with Democrat Jimmy Carter's presidential election and the United States Bicentennial celebration. Although almost half of the seats decided in this election changed parties, Carter's narrow victory did not provide coattails for the Democratic Party. Each party flipped seven Senate seats, although, one of the seats flipped by Democrats was previously held by a Conservative.
This was the first election in which the Libertarian Party competed, running candidates in 9 of the 33 contested seats. As of 2024 [update] this is the first and so far only time both party leaders retired from the Senate in the same election cycle since the creation of the positions. This is the last time Democrats or any party won a 60% supermajority via direct elections (although Democrats briefly held one in the summer of 2009).
61 | 1 | 38 |
Democratic | I | Republican |
Parties | Total | ||||||||||||||||||||||||||||||||||||||||||||||||||||||||||||||||||||||||||||||||||||||||||||||||||
---|---|---|---|---|---|---|---|---|---|---|---|---|---|---|---|---|---|---|---|---|---|---|---|---|---|---|---|---|---|---|---|---|---|---|---|---|---|---|---|---|---|---|---|---|---|---|---|---|---|---|---|---|---|---|---|---|---|---|---|---|---|---|---|---|---|---|---|---|---|---|---|---|---|---|---|---|---|---|---|---|---|---|---|---|---|---|---|---|---|---|---|---|---|---|---|---|---|---|---|
Democratic | Republican | Independent | Other | ||||||||||||||||||||||||||||||||||||||||||||||||||||||||||||||||||||||||||||||||||||||||||||||||
Last elections (1974) Before these elections | 61 | 37 | 1 | 1 | 100 | ||||||||||||||||||||||||||||||||||||||||||||||||||||||||||||||||||||||||||||||||||||||||||||||
Not up | 40 | 27 | 0 | 0 | 67 | ||||||||||||||||||||||||||||||||||||||||||||||||||||||||||||||||||||||||||||||||||||||||||||||
Up Class 1 (1970→1976) | 21 | 10 | 1 | 1 | 33 | ||||||||||||||||||||||||||||||||||||||||||||||||||||||||||||||||||||||||||||||||||||||||||||||
Incumbent retired | 5 | 3 | 0 | 0 | 8 | ||||||||||||||||||||||||||||||||||||||||||||||||||||||||||||||||||||||||||||||||||||||||||||||
Held by same party | 2 | 1 | — | — | 3 | ||||||||||||||||||||||||||||||||||||||||||||||||||||||||||||||||||||||||||||||||||||||||||||||
Replaced by other party | ![]() ![]() ![]() ![]() | — | — | 5 | |||||||||||||||||||||||||||||||||||||||||||||||||||||||||||||||||||||||||||||||||||||||||||||||
Result | 6 | 2 | — | — | 8 | ||||||||||||||||||||||||||||||||||||||||||||||||||||||||||||||||||||||||||||||||||||||||||||||
Incumbent ran | 16 | 7 | 1 | 1 | 25 | ||||||||||||||||||||||||||||||||||||||||||||||||||||||||||||||||||||||||||||||||||||||||||||||
Won re-election | 11 | 4 | 1 | 0 | 16 | ||||||||||||||||||||||||||||||||||||||||||||||||||||||||||||||||||||||||||||||||||||||||||||||
Lost re-election | ![]() ![]() ![]() ![]() ![]() ![]() | 9 | |||||||||||||||||||||||||||||||||||||||||||||||||||||||||||||||||||||||||||||||||||||||||||||||||
Lost renomination, but held by same party | 0 | 0 | 0 | 0 | 0 | ||||||||||||||||||||||||||||||||||||||||||||||||||||||||||||||||||||||||||||||||||||||||||||||
Result | 15 | 9 | 1 | 0 | 25 | ||||||||||||||||||||||||||||||||||||||||||||||||||||||||||||||||||||||||||||||||||||||||||||||
Total elected | 21 | 11 | 1 | 0 | 33 | ||||||||||||||||||||||||||||||||||||||||||||||||||||||||||||||||||||||||||||||||||||||||||||||
Net gain/loss | ![]() | ![]() | ![]() | ![]() | 1 | ||||||||||||||||||||||||||||||||||||||||||||||||||||||||||||||||||||||||||||||||||||||||||||||
Nationwide vote | 31,790,526 [a] | 24,562,431 [a] | 1,173,414 | 1,647,636 | 59,174,007 | ||||||||||||||||||||||||||||||||||||||||||||||||||||||||||||||||||||||||||||||||||||||||||||||
Share | 53.72% | 41.51% | 1.98% | 2.78% | 100% | ||||||||||||||||||||||||||||||||||||||||||||||||||||||||||||||||||||||||||||||||||||||||||||||
Result | 61 | 38 | 1 | 0 | 100 |
Source: "Statistics of the Presidential and Congressional Election of November 2, 1976" (PDF). U.S. Government Printing Office. Retrieved February 25, 2013.
Four Republicans and four Democrats retired instead of seeking re-election.
Three Republicans, five Democrats, and one Conservative sought re-election but lost in the general election.
Five Democrats either resigned or died between at the end of 93rd Congress and during the 94th Congress. All were initially replaced by Democratic appointees.
State | Senator | Replaced by |
---|---|---|
Alabama (Class 3) | James Allen | Maryon Pittman Allen |
Arkansas (Class 2) | John L. McClellan | Kaneaster Hodges Jr. |
Minnesota (Class 1) | Hubert Humphrey | Muriel Humphrey |
Minnesota (Class 2) | Walter Mondale | Wendell R. Anderson |
Montana (Class 2) | Lee Metcalf | Paul G. Hatfield |
D1 | D2 | D3 | D4 | D5 | D6 | D7 | D8 | D9 | D10 |
D20 | D19 | D18 | D17 | D16 | D15 | D14 | D13 | D12 | D11 |
D21 | D22 | D23 | D24 | D25 | D26 | D27 | D28 | D29 | D30 |
D40 | D39 | D38 | D37 | D36 | D35 | D34 | D33 | D32 | D31 |
D41 Ca. Ran | D42 Fla. Ran | D43 Ind. Ran | D44 Maine Ran | D45 Mass. Ran | D46 Mich. Retired | D47 Minn. Ran | D48 Miss. Ran | D49 Mo. Retired | D50 Mont. Retired |
Majority → | D51 Nev. Ran | ||||||||
D60 Wis. Ran | D59 W.Va. Ran | D58 Wa. Ran | D57 Utah Ran | D56 Texas Ran | D55 R.I. Retired | D54 N.D. Ran | D53 N.M. Ran | D52 N.J. Ran | |
D61 Wy. Ran | I1 Va. Ran | C1 N.Y. Ran | R37 Vt. Ran | R36 Tenn. Ran | R35 Pa. Retired | R34 Ohio Ran | R33 Neb. Retired | R32 Md. Ran | R31 Hawaii Retired |
R21 | R22 | R23 | R24 | R25 | R26 | R27 | R28 Ariz. Retired | R29 Conn. Ran | R30 Del. Ran |
R20 | R19 | R18 | R17 | R16 | R15 | R14 | R13 | R12 | R11 |
R1 | R2 | R3 | R4 | R5 | R6 | R7 | R8 | R9 | R10 |
D1 | D2 | D3 | D4 | D5 | D6 | D7 | D8 | D9 | D10 |
D20 | D19 | D18 | D17 | D16 | D15 | D14 | D13 | D12 | D11 |
D21 | D22 | D23 | D24 | D25 | D26 | D27 | D28 | D29 | D30 |
D40 | D39 | D38 | D37 | D36 | D35 | D34 | D33 | D32 | D31 |
D41 Fla. Re-elected | D42 Maine Re-elected | D43 Mass. Re-elected | D44 Mich. Hold | D45 Minn. Re-elected | D46 Miss. Re-elected | D47 Mont. Hold | D48 Nev. Re-elected | D49 N.J. Re-elected | D50 N.D. Re-elected |
Majority → | D51 Texas Re-elected | ||||||||
D60 Ohio Gain | D59 N.Y. Gain | D58 Neb. Gain | D57 Md. Gain | D56 Hawaii Gain | D55 Ariz. Gain | D54 Wis. Re-elected | D53 W.Va. Re-elected | D52 Wa. Re-elected | |
D61 Tenn. Gain | I1 Va. Re-elected | R38 Wy. Gain | R37 Utah Gain | R36 R.I. Gain | R35 N.M. Gain | R34 Mo. Gain | R33 Ind. Gain | R32 Ca. Gain | R31 Vt. Re-elected |
R21 | R22 | R23 | R24 | R25 | R26 | R27 | R28 Conn. Re-elected | R29 Del. Re-elected | R30 Pa. Hold |
R20 | R19 | R18 | R17 | R16 | R15 | R14 | R13 | R12 | R11 |
R1 | R2 | R3 | R4 | R5 | R6 | R7 | R8 | R9 | R10 |
Key |
|
---|
In these general elections, the winners were elected for the term beginning January 3, 1977; ordered by state.
All of the elections involved the Class 1 seats.
State | Incumbent | Result | Candidates | ||
---|---|---|---|---|---|
Senator | Party | Electoral history | |||
Arizona | Paul Fannin | Republican | 1964 1970 | Incumbent retired. Democratic gain. |
Others
|
California | John V. Tunney | Democratic | 1970 1971 (appointed) | Incumbent lost re-election. Republican gain. Incumbent resigned January 1, 1977 to give successor preferential seniority. Winner appointed January 2, 1977. |
Others
|
Connecticut | Lowell Weicker | Republican | 1970 | Incumbent re-elected. |
|
Delaware | William Roth | Republican | 1970 1971 (appointed) | Incumbent re-elected. |
Others
|
Florida | Lawton Chiles | Democratic | 1970 | Incumbent re-elected. |
|
Hawaii | Hiram Fong | Republican | 1959 (new state) 1964 1970 | Incumbent retired. Democratic gain. |
Others
|
Indiana | Vance Hartke | Democratic | 1958 1964 1970 | Incumbent lost re-election. Republican gain. |
Others
|
Maine | Edmund Muskie | Democratic | 1958 1964 1970 | Incumbent re-elected. |
|
Maryland | J. Glenn Beall Jr. | Republican | 1970 | Incumbent lost re-election. Democratic gain. |
|
Massachusetts | Ted Kennedy | Democratic | 1962 (special) 1964 1970 | Incumbent re-elected. |
Others
|
Michigan | Philip Hart | Democratic | 1958 1964 1970 | Incumbent retired. Democratic hold. Incumbent died December 26, 1976. Winner appointed December 30, 1976. |
Others
|
Minnesota | Hubert Humphrey | DFL | 1948 1954 1960 1964 (resigned) 1970 | Incumbent re-elected. |
Others
|
Mississippi | John C. Stennis | Democratic | 1947 (special) 1952 1958 1964 1970 | Incumbent re-elected. |
|
Missouri | Stuart Symington | Democratic | 1952 1958 1964 1970 | Incumbent retired. Republican gain. Incumbent resigned December 27, 1976 to give successor preferential seniority. Winner appointed the same day. |
|
Montana | Mike Mansfield | Democratic | 1952 1958 1964 1970 | Incumbent retired. Democratic hold. |
|
Nebraska | Roman Hruska | Republican | 1954 (special) 1958 1964 1970 | Incumbent retired. Democratic gain. Incumbent resigned December 27, 1976 to give successor preferential seniority. Winner appointed December 28, 1976 to finish the term. |
|
Nevada | Howard Cannon | Democratic | 1958 1964 1970 | Incumbent re-elected. |
Others
|
New Jersey | Harrison A. Williams | Democratic | 1958 1964 1970 | Incumbent re-elected. |
Others
|
New Mexico | Joseph Montoya | Democratic | 1964 (special) 1964 1970 | Incumbent lost re-election. Republican gain. |
Others
|
New York | James L. Buckley | Conservative | 1970 | Incumbent ran as a Republican and lost re-election. Democratic gain. |
Others
|
North Dakota | Quentin Burdick | Democratic-NPL | 1960 (special) 1964 1970 | Incumbent re-elected. |
|
Ohio | Robert Taft Jr. | Republican | 1970 | Incumbent lost re-election. Democratic gain. Incumbent resigned December 28, 1976 to give successor preferential seniority. Winner appointed December 29, 1976. |
Others
|
Pennsylvania | Hugh Scott | Republican | 1958 1964 1970 | Incumbent retired. Republican hold. |
Others
|
Rhode Island | John Pastore | Democratic | 1950 (special) 1952 1958 1964 1970 | Incumbent retired. Republican gain Incumbent resigned December 28, 1976 to give successor preferential seniority. Winner appointed December 29, 1976. |
|
Tennessee | Bill Brock | Republican | 1970 | Incumbent lost re-election. Democratic gain. |
Others
|
Texas | Lloyd Bentsen | Democratic | 1970 | Incumbent re-elected. |
Others
|
Utah | Frank Moss | Democratic | 1958 1964 1970 | Incumbent lost re-election. Republican gain. |
Others
|
Vermont | Robert Stafford | Republican | 1971 (appointed) 1972 (special) | Incumbent re-elected. |
|
Virginia | Harry F. Byrd Jr. | Independent | 1965 (appointed) [c] 1966 (special) 1970 | Incumbent re-elected. |
|
Washington | Henry M. Jackson | Democratic | 1952 1958 1964 1970 | Incumbent re-elected. |
Others
|
West Virginia | Robert Byrd | Democratic | 1958 1964 1970 | Incumbent re-elected. |
|
Wisconsin | William Proxmire | Democratic | 1957 (special) 1958 1964 1970 | Incumbent re-elected. |
Others
|
Wyoming | Gale W. McGee | Democratic | 1958 1964 1970 | Incumbent lost re-election. Republican gain. |
|
9 races had a margin of victory under 10%:
State | Party of winner | Margin |
---|---|---|
Ohio | Democratic (flip) | 2.99% |
California | Republican (flip) | 3.2% |
Vermont | Republican | 4.6% |
Tennessee | Democratic (flip) | 5.45% |
Michigan | Democratic | 5.6% |
Pennsylvania | Republican | 5.6% |
Nebraska | Democratic (flip) | 5.82% |
Utah | Republican (flip) | 8.9% |
New York | Democratic (flip) | 9.2% |
Nevada was the tipping point state with a margin of 31.6%.
![]() | |||||||||||||||||
| |||||||||||||||||
![]() County results DeConcini: 40–50% 50–60% 60–70% 70–80% Steiger: 50–60% | |||||||||||||||||
|
Incumbent Republican Paul Fannin retired instead of seeking a third term. Democratic attorney and businessman Dennis DeConcini won the open seat over Sam Steiger, U.S. Congressman of Arizona's 3rd congressional district.
Party | Candidate | Votes | % | |
---|---|---|---|---|
Democratic | Dennis DeConcini | 400,334 | 54.01 | |
Republican | Sam Steiger | 321,236 | 43.34 | |
Independent | Bob Field | 10,765 | 1.45 | |
Libertarian | Allan Norwitz | 7,310 | 0.99 | |
Independent | Wm. Mathews Feighan | 1,565 | 0.21 | |
Majority | 79,098 | 8.68 | ||
Turnout | 741,210 | |||
Democratic gain from Republican |
![]() | |||||||||||||||||
| |||||||||||||||||
![]() County results Hayakawa: 40–50% 50–60% 60–70% Tunney: 40–50% 50–60% | |||||||||||||||||
|
Incumbent Democrat John Tunney ran for re-election to a second term, but was defeated by Republican Sam Hayakawa, President emeritus of San Francisco State University.
Party | Candidate | Votes | % | |
---|---|---|---|---|
Republican | S. I. Hayakawa | 3,748,973 | 50.12 | |
Democratic | John V. Tunney (Incumbent) | 3,502,862 | 46.89 | |
Peace and Freedom | David Wald | 104,383 | 1.40 | |
American Independent | Jack McCoy | 82,739 | 1.11 | |
Independent | Omari Musa | 31,629 | 0.42 | |
Majority | 246,111 | 3.23 | ||
Turnout | 7,470,586 | |||
Republican gain from Democratic |
![]() | |||||||||||||||||
| |||||||||||||||||
Weicker: 40–50% 50–60% 60–70% 70–80% Schaffer: 40–50% 50–60% 60–70% | |||||||||||||||||
|
Incumbent Republican Lowell Weicker won re-election to a second term over Gloria Schaffer, Connecticut Secretary of State [2]
Party | Candidate | Votes | % | |
---|---|---|---|---|
Republican | Lowell Weicker (Incumbent) | 785,683 | 57.70 | |
Democratic | Gloria Schaffer | 561,018 | 41.20 | |
George Wallace | Robert Barnabei | 14,407 | 1.06 | |
Others | 558 | 0.0 | ||
Majority | 224,665 | 16.50 | ||
Turnout | 1,361,666 | |||
Republican hold |
![]() | |||||||||||||||||
| |||||||||||||||||
County results Roth: 50–60% 60–70% 70–80% | |||||||||||||||||
|
Incumbent Republican William Roth won reelection to a second term over Thomas Maloney, Mayor of Wilmington [3]
Party | Candidate | Votes | % | |
---|---|---|---|---|
Republican | William Roth (Incumbent) | 125,454 | 55.81 | |
Democratic | Thomas Maloney | 98,042 | 43.61 | |
American | Donald G. Gies | 646 | 0.29 | |
Non-Partisan | Joseph F. McInerney | 437 | 0.19 | |
Prohibition | John A. Massimilla | 216 | 0.0 | |
Majority | 27,412 | 12.20 | ||
Turnout | 224,795 | |||
Republican hold |
![]() | |||||||||||||||||
| |||||||||||||||||
![]() County results Chiles: 50–60% 60–70% 70–80% 80–90% Grady: 50–60% | |||||||||||||||||
|
Incumbent Democrat Lawton Chiles won re-election to a second term over John Grady, Mayor of Belle Glade [4]
Party | Candidate | Votes | % | |
---|---|---|---|---|
Democratic | Lawton Chiles (Incumbent) | 1,799,518 | 63.0 | |
Republican | John Grady | 1,057,886 | 37.0 | |
Write-In | Ed Ice | 123 | 0.0 | |
Write-In | Tim Adams | 7 | 0.0 | |
Majority | 741,632 | 26.0 | ||
Turnout | 2,857,534 | |||
Democratic hold |
![]() | |||||||||||||||||
| |||||||||||||||||
![]() County results Matsunaga: 50–60% 60–70% | |||||||||||||||||
|
Incumbent Republican Hiram Fong retired instead of seeking re-election to a fourth term. Democrat Spark Matsunaga won the open seat over Republican William Quinn, Former Governor of Hawaii.
Party | Candidate | Votes | % | |
---|---|---|---|---|
Democratic | Spark Matsunaga | 162,305 | 53.7 | |
Republican | William Quinn | 122,724 | 40.6 | |
People's | Anthony Hodges | 14,226 | 4.7 | |
Nonpartisan | James Kimmel | 1,433 | 0.5 | |
Libertarian | Rockne Hart Johnson | 1,404 | 0.5 | |
Majority | 39,581 | 13.1 | ||
Turnout | 302,092 | |||
Democratic gain from Republican |
![]() | |||||||||||||||||
| |||||||||||||||||
![]() County results Lugar: 50–60% 60–70% 70–80% Hartke: 50–60% 60–70% | |||||||||||||||||
|
Incumbent Democrat Vance Hartke ran for re-election to a fourth term, but was defeated by Republican challenger Richard Lugar, Mayor of Indianapolis.
Party | Candidate | Votes | % | |
---|---|---|---|---|
Republican | Richard Lugar | 1,275,833 | 59.03 | |
Democratic | Vance Hartke (Incumbent) | 868,522 | 40.19 | |
Don L. Lee | 14,321 | 0.66 | ||
U.S. Labor | David Lee Hoagland | 2,511 | 0.12 | |
Majority | 407,311 | 18.85 | ||
Turnout | 2,161,187 | |||
Republican gain from Democratic |
![]() | |||||||||||||||||
| |||||||||||||||||
![]() County results Muskie: 50–60% 60–70% Monks: 50–60% | |||||||||||||||||
|
Incumbent Democrat Edmund Muskie won re-election to a fourth term over Republican Robert A. G. Monks, shareholder activist.
Party | Candidate | Votes | % | |
---|---|---|---|---|
Democratic | Edmund Muskie (Incumbent) | 292,704 | 60.20 | |
Republican | Robert A. G. Monks | 193,489 | 39.80 | |
Majority | 99,215 | 20.41 | ||
Turnout | 486,193 | |||
Democratic hold |
![]() | |||||||||||||||||
| |||||||||||||||||
![]() County results Sarbanes: 40–50% 50–60% 70–80% Beall: 40–50% 50–60% 60–70% | |||||||||||||||||
|
Incumbent Republican J. Glenn Beall Jr. ran for re-election to a second term, but was defeated by Democratic challenger Paul Sarbanes, member of the U.S. House of Representatives.
Party | Candidate | Votes | % | |
---|---|---|---|---|
Democratic | Paul Sarbanes | 772,101 | 56.55 | |
Republican | J. Glenn Beall Jr. (Incumbent) | 530,439 | 38.85 | |
Independent | Bruce Bradley | 62,750 | 4.60 | |
Majority | 241,662 | 17.70 | ||
Turnout | 1,365,290 | |||
Democratic gain from Republican |
![]() | |||||||||||||||||
| |||||||||||||||||
| |||||||||||||||||
|
Incumbent Democrat Ted Kennedy won re-election to his fourth (his third full) term over Republican businessman, Michael Robertson. [7]
Party | Candidate | Votes | % | ±% | |
---|---|---|---|---|---|
Democratic | Edward M. Kennedy (Incumbent) | 1,726,657 | 69.31 | +7.15% | |
Republican | Michael S. Robertson | 722,641 | 29.01 | −7.99% | |
Socialist Workers | Carol Henderson Evans | 26,283 | 1.06 | +0.52% | |
U.S. Labor | H. Graham Lowry | 15,517 | 0.62 | ||
All others | 157 | 0.01 | |||
Total votes | 2,491,255 | 85.55 | |||
Majority | 1,004,016 | 40.30 | 15.14% | ||
Democratic hold | Swing |
![]() | |||||||||||||||||
| |||||||||||||||||
![]() County results Riegle: 40–50% 50–60% 60–70% Esch: 40-50% 50-60% 60-70% 70-80% | |||||||||||||||||
|
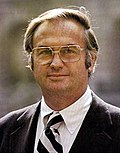
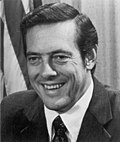
Incumbent Democrat Philip Hart retired instead of seeking a fourth term. Democrat Donald Riegle, member of the U.S. House of Representatives, won the open seat over fellow congressman Republican Marvin Esch.
Party | Candidate | Votes | % | |
---|---|---|---|---|
Democratic | Donald Riegle | 1,831,031 | 52.46 | |
Republican | Marvin L. Esch | 1,635,087 | 46.85 | |
Libertarian | Bette Jane Erwin | 8,842 | <1 | |
Human Rights | Theodore G. Albert | 7,281 | <1 | |
Socialist Workers | Paula L. Reimers | 3,399 | <1 | |
Socialist Labor | Frank Girard | 2,554 | <1 | |
U.S. Labor | Peter A. Signorelli | 2,218 | <1 | |
Majority | 195,944 | 5.61 | ||
Turnout | 3,490,412 | |||
Democratic hold |
![]() | |||||||||||||||||||||||||||||||||||||
| |||||||||||||||||||||||||||||||||||||
![]() County results Humphrey: 50–60% 60–70% 70–80% 80–90% | |||||||||||||||||||||||||||||||||||||
|
Incumbent Democrat Hubert Humphrey won re-election to a fifth term over Republican Gerald Brekke, college professor [9]
Party | Candidate | Votes | % | |
---|---|---|---|---|
Democratic (DFL) | Hubert H. Humphrey (Incumbent) | 317,632 | 91.3 | |
Democratic (DFL) | Dick Bullock | 30,262 | 8.7 |
Party | Candidate | Votes | % | |
---|---|---|---|---|
Ind.-Republican | Gerald W. Brekke | 76,183 | 54.5 | |
Ind.-Republican | Richard "Dick" Franson | 32,115 | 23.0 | |
Ind.-Republican | John H. Glover | 13,014 | 9.3 | |
Ind.-Republican | Roland "Butch" Riemers | 9,307 | 6.7 | |
Ind.-Republican | Bea Mooney | 9,150 | 6.5 |
Party | Candidate | Votes | % | |
---|---|---|---|---|
Democratic (DFL) | Hubert H. Humphrey (Incumbent) | 1,290,736 | 67.51 | |
Ind.-Republican | Gerald W. Brekke | 478,602 | 25.03 | |
American | Paul Helm | 125,612 | 6.57 | |
Socialist Workers | Bill Peterson | 9,380 | 0.49 | |
Libertarian | Robin E. Miller | 5,476 | 0.29 | |
Communist | Matt Savola | 2,214 | 0.12 | |
Majority | 812,134 | 42.48 | ||
Turnout | 1,912,020 | |||
Democratic (DFL) hold |
![]() | |||||||||||||||||
| |||||||||||||||||
|
Incumbent Democrat John C. Stennis won re-election to his sixth term.
Party | Candidate | Votes | % | |
---|---|---|---|---|
Democratic | John Stennis (Incumbent) | 554,433 | 100.0 |
![]() | |||||||||||||||||
| |||||||||||||||||
![]() County results Danforth: 50-60% 60-70% 70-80% Hearnes: 50–60% 60–70% 70–80% | |||||||||||||||||
|
Incumbent Democrat Stuart Symington retired, instead of seeking a fifth term. Republican John Danforth, Attorney General of Missouri, won the open seat, defeating Democrat Warren Hearnes, former Governor of Missouri. (Jerry Litton had won the Democratic nomination earlier, but was killed in a plane crash, and Hearnes was chosen by the party committee.)
Party | Candidate | Votes | % | |
---|---|---|---|---|
Republican | John Danforth | 1,090,067 | 56.94 | |
Democratic | Warren E. Hearnes | 813,571 | 42.50 | |
Independent | Lawrence "Red" Petty | 10,822 | 0.57 | |
Majority | 276,496 | 14.44 | ||
Turnout | 1,914,460 | |||
Republican gain from Democratic |
![]() | |||||||||||||||||
| |||||||||||||||||
![]() County results Melcher: 50–60% 60–70% 70–80% 80–90% Burger: 50-60% | |||||||||||||||||
|
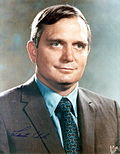
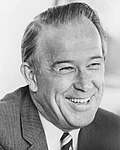
Rather than seek a fifth term, Democratic incumbent Mike Mansfield opted to retire, creating an open seat. United States Congressman John Melcher, who had represented Montana's 2nd congressional district from 1969 to 1977, won the Democratic nomination and defeated Stanley C. Burger, the Republican nominee and former executive officer of the Montana Farm Bureau Federation, by a wide margin in the general election.
Party | Candidate | Votes | % | |
---|---|---|---|---|
Democratic | Jack Melcher | 89,413 | 88.52 | |
Democratic | Ray E. Gulick | 11,593 | 11.48 | |
Total votes | 101,006 | 100.00 |
Party | Candidate | Votes | % | |
---|---|---|---|---|
Republican | Stanley C. Burger | 32,313 | 40.41 | |
Republican | Dave Drum | 27,257 | 34.09 | |
Republican | Jack Tierney | 15,129 | 18.92 | |
Republican | Larry L. Gilbert | 5,258 | 6.58 | |
Total votes | 79,957 | 100.00 |
Party | Candidate | Votes | % | ±% | |
---|---|---|---|---|---|
Democratic | John Melcher | 206,232 | 64.16 | +3.62% | |
Republican | Stanley C. Burger | 115,213 | 35.84 | −3.62% | |
Majority | 91,019 | 28.32 | +7.24% | ||
Turnout | 321,445 | ||||
Democratic hold | Swing |
![]() | |||||||||||||||||
| |||||||||||||||||
![]() County results Zorinsky: 50–60% 60–70% 70–80% >90% McCollister: 50-60% 60-70% 70-80% | |||||||||||||||||
|
Incumbent Republican Roman Hruska retired instead of seeking another term. Democrat Edward Zorinsky, Mayor of Omaha, won the open seat over Republican John Y. McCollister, U.S. Congressman of Nebraska's 2nd congressional district.
Party | Candidate | Votes | % | |
---|---|---|---|---|
Democratic | Edward Zorinsky | 313,805 | 52.89 | |
Republican | John Y. McCollister | 279,284 | 47.07 | |
Write-in candidate | Lenore Etchison | 58 | 0.01 | |
N/A | Others | 163 | 0.03 | |
Majority | 34,521 | 5.82 | ||
Turnout | 593,310 | |||
Democratic gain from Republican |
![]() | |||||||||||||||||
| |||||||||||||||||
![]() County results Cannon: 40–50% 50–60% 60–70% 70–80% Towell: 40–50% | |||||||||||||||||
|
Incumbent Democrat Howard Cannon won re-election to a fourth term over Republican David Towell, U.S. Representative from Nevada's At-large congressional district.
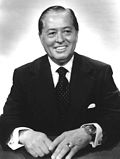
In the Senate, Cannon was known as a moderate in the Democratic Party. He served as chairman of several committees, including the rules committee and the inaugural arrangements committee. Cannon was nearly defeated for re-election in 1964 by Republican Lieutenant Governor Paul Laxalt in one of the closest election in history. However, he became more popular over the next few years and won re-election in 1970 with nearly 58% of the vote. In 1976, he faced U.S. Representative David Towell, who served just one term in the U.S. House of Representatives before running for the U.S. Senate. Cannon won re-election with 63% of the vote, one of his best election performances of his career. He won every county in the state, except for Eureka County, which Towell won with just 51% of the vote.
Party | Candidate | Votes | % | ±% | |
---|---|---|---|---|---|
Democratic | Howard Cannon (Incumbent) | 127,214 | 63.01 | +5.36% | |
Republican | David Towell | 63,471 | 31.44 | −9.73% | |
None of These Candidates | 5,288 | 2.62 | |||
Independent American | Byron D. Young | 3,619 | 1.79 | ||
Libertarian | Dan Becan | 2,307 | 1.14 | ||
Majority | 63,743 | 31.57 | +15.09% | ||
Turnout | 201,899 | ||||
Democratic hold | Swing |
![]() | |||||||||||||||||
| |||||||||||||||||
![]() County Results Williams: 50–60% 60–70% | |||||||||||||||||
|
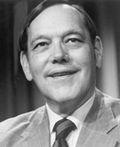
Harrison A. Williams, the incumbent originally elected in 1958, elected to run for a fourth term. He defeated anti-abortion activist Stephen J. Foley handily in the Democratic primary with 85% of the vote. David A. Norcross won the Republican primary with the endorsement of the New Jersey Republican Party with 68% of the vote.
In the general election, Williams soundly won re-election to a fourth term over Norcross. He won 60% of the vote, winning every county in the state. This would be Williams' last election to the U.S. Senate, as he would resign in 1981 following his involvement in the Abscam scandal.
Party | Candidate | Votes | % | |
---|---|---|---|---|
Democratic | Harrison A. Williams (Incumbent) | 1,681,140 | 60.66 | |
Republican | David A. Norcross | 1,054,508 | 38.05 | |
Libertarian | Hannibal Cundari | 19,907 | 0.72 | |
Socialist Labor | Bernardo S. Doganiero | 9,185 | 0.33 | |
Labor Party | Leif Johnson | 6,650 | 0.24 | |
Majority | 626,632 | 22.61 | ||
Turnout | 2,771,390 | |||
Democratic hold |
![]() | |||||||||||||||||
| |||||||||||||||||
![]() County results Schmitt: 50–60% 60–70% Montoya: 50–60% | |||||||||||||||||
|
Incumbent Democrat Joseph Montoya ran for re-election to a third term, but was defeated by Republican former Astronaut Harrison Schmitt.
Party | Candidate | Votes | % | ±% | |
---|---|---|---|---|---|
Republican | Harrison Schmitt | 234,681 | 56.82 | +9.69% | |
Democratic | Joseph Montoya (Incumbent) | 176,382 | 42.70 | −10.17% | |
Raza Unida | Ernesto B. Borunda | 1,087 | 0.26 | ||
American Independent | Matt Dillion | 906 | 0.22 | ||
Majority | 58,299 | 14.11 | +8.36% | ||
Turnout | 413,056 | ||||
Republican gain from Democratic | Swing |
![]() | |||||||||||||||||
| |||||||||||||||||
![]() County results Moynihan: 50–60% 60–70% 70–80% Buckley: 50–60% 60–70% 70–80% | |||||||||||||||||
|
Incumbent Conservative James Buckley ran for re-election to a second term as a Republican, but was defeated by Daniel Patrick Moynihan.
Party | Candidate | Votes | % | |
---|---|---|---|---|
Democratic | Paul O'Dwyer | 32.50 | ||
Democratic | Daniel Patrick Moynihan | 31.10 | ||
Democratic | Bella Abzug | 28.70 | ||
Democratic | Ramsey Clark | 7.00 | ||
Democratic | Abraham Hirschfeld | 0.70 | ||
Total votes | 100.00 |
Party | Candidate | Votes | % | |
---|---|---|---|---|
Democratic | Daniel Patrick Moynihan | 333,697 | 36.41 | |
Democratic | Bella Abzug | 323,705 | 35.32 | |
Democratic | Ramsey Clark | 94,191 | 10.28 | |
Democratic | Paul O'Dwyer | 82,689 | 9.02 | |
Democratic | Abraham Hirschfeld | 82,331 | 8.98 | |
Total votes | 916,613 | 100.00 |
Party | Candidate | Votes | % | |
---|---|---|---|---|
Republican | James Buckley (Incumbent) | 242,257 | 70.45 | |
Republican | Peter Peyser | 101,629 | 29.55 | |
Total votes | 343,886 | 100.00 |
Party | Candidate | Votes | % | ±% | |
---|---|---|---|---|---|
Democratic | Daniel Patrick Moynihan | 3,238,511 | |||
Liberal | Daniel Patrick Moynihan | 184,083 | |||
total | Daniel Patrick Moynihan | 3,422,594 | 54.17 | + 17.21 | |
Republican | James Buckley (Incumbent) | 2,525,139 | |||
Conservative | James Buckley | 311,494 | |||
total | James Buckley | 2,836,633 | 44.90 | + 5.95 | |
Communist | Herbert Aptheker | 25,141 | 0.40 | + 0.37 | |
Socialist Workers | Marcia Gallo | 16,350 | 0.26 | + 0.20 | |
Libertarian | Martin E. Nixon | 10,943 | 0.17 | + 0.17 | |
U.S. Labor | Elijah C. Boyd | 6,716 | 0.11 | + 0.11 | |
Majority | 675,961 | 9.27 | |||
Turnout | 6,408,377 | ||||
Democratic gain from Republican | Swing |
![]() | |||||||||||||||||
| |||||||||||||||||
![]() County results Burdick: 50–60% 60–70% 70–80% Stroup: 50–60% | |||||||||||||||||
|
Incumbent North Dakota Democratic NPL Party Democrat Quentin Burdick, sought and received re-election to his fourth term to the United States Senate, defeating Republican candidate Robert Stroup. [1] Only Burdick filed as a Dem-NPLer, and the endorsed Republican candidate was Robert Stroup, as state senator from Hazen, North Dakota. Burdick and Stroup won the primary elections for their respective parties. One independent candidate, Clarence Haggard, also filed before the deadline under the American Party.
Party | Candidate | Votes | % | |
---|---|---|---|---|
Democratic | Quentin Burdick (Incumbent) | 175,772 | 62.10 | |
Republican | Robert Stroup | 103,466 | 36.55 | |
Independent | Clarence Haggard | 3,824 | 1.35 | |
Turnout | 283,062 | |||
Democratic hold |
![]() | |||||||||||||||||
| |||||||||||||||||
![]() County results Metzenbaum: 40–50% 50–60% 60–70% Taft: 40–50% 50–60% 60–70% | |||||||||||||||||
|
Incumbent Republican Robert Taft Jr. ran for re-election to second term, but was defeated by Democratic former senator Howard Metzenbaum.
Party | Candidate | Votes | % | |
---|---|---|---|---|
Democratic | Howard Metzenbaum | 1,941,113 | 49.51 | |
Republican | Robert Taft Jr. (Incumbent) | 1,823,774 | 46.52 | |
Independent | John O'Neill | 53,657 | 1.37 | |
American Independent | Donald E. Babcock | 36,979 | 0.94 | |
Independent | Emma Lila Fundaburk | 33,285 | 0.85 | |
Socialist Workers | Melissa Singler | 31,805 | 0.81 | |
Majority | 117,339 | 2.99 | ||
Turnout | 3,920,613 | |||
Democratic gain from Republican |
![]() | |||||||||||||||||
| |||||||||||||||||
![]() County results Heinz: 50–60% 60–70% Green: 40–50% 50–60% 70–80% | |||||||||||||||||
|
Incumbent Republican and Minority Leader Hugh Scott retired. Republican John Heinz won the open seat over Democrat Bill Green, United States Representative [16] [1]
In December 1975, U.S. senator Hugh Scott announced that he would not seek re-election in 1976 at the age of 75 after serving in Congress for 33 years. Scott listed personal reasons and several "well-qualified potential candidates" for the seat among the reasons of his decision to retire. Other reasons, including his support for Richard Nixon and accusations that he had illegally obtained contributions from Gulf Oil were alleged to have contributed to the decision. [17]
Party | Candidate | Votes | % | |
---|---|---|---|---|
Democratic | William J. Green III | 762,733 | 68.71 | |
Democratic | Jeanette Reibman | 345,264 | 31.10 | |
Democratic | Others | 2,058 | 0.19 |
Party | Candidate | Votes | % | |
---|---|---|---|---|
Republican | John Heinz | 358,715 | 37.73 | |
Republican | Arlen Specter | 332,513 | 34.98 | |
Republican | George Packard | 160,379 | 16.87 | |
Republican | Others | 99,074 | 10.43 |
Heinz was the victor in all but nine counties, defeating opponent William Green, who had a 300,000 vote advantage in his native Philadelphia area. Heinz and Green spend $2.5 million and $900,000, respectively, during the ten-month campaign. Much of the money Heinz spent on his campaign was his own, leading to accusations from Green that he was "buying the seat". Heinz replied to this by claiming that the spending was necessary to overcome the Democratic voter registration advantage. [20]
Party | Candidate | Votes | % | ±% | |
---|---|---|---|---|---|
Republican | John Heinz | 2,381,891 | 52.39 | +0.96% | |
Democratic | William J. Green III | 2,126,977 | 46.79 | +1.41% | |
Constitution | Andrew J. Watson | 26,028 | 0.57 | −1.79% | |
Socialist Workers | Frederick W. Stanton | 5,484 | 0.12 | +0.01% | |
Labor Party | Bernard Salera | 3,637 | 0.08 | +0.08% | |
Communist Party | Frank Kinces | 2,097 | 0.05 | +0.05% | |
N/A | Other | 239 | 0.00 | N/A | |
Turnout | 4,546,353 | {{{change}}} | |||
Majority | 254,914 | 6.60 | {{{change}}} | ||
Republican hold | Swing |
![]() | |||||||||||||||||
| |||||||||||||||||
Chafee: 50–60% 60–70% 70–80% Lorber: 50–60% | |||||||||||||||||
|
Incumbent Democrat John O. Pastore did not seek re-election. Republican John Chafee won the seat, defeating Democrat Richard P. Lorber.
Party | Candidate | Votes | % | |
---|---|---|---|---|
Democratic | Richard P. Lorber | 60,118 | 37.78 | |
Democratic | Philip W. Noel | 60,018 | 37.71 | |
Democratic | John P. Hawkins | 25,456 | 16.00 | |
Democratic | Paul E. Goulding | 5,500 | 3.46 | |
Democratic | Ralph J. Perrotta | 4,481 | 2.82 | |
Democratic | John E. Caddick | 2,160 | 1.36 | |
Democratic | Earl F. Pasbach | 962 | 0.60 | |
Democratic | Arthur E. Marley | 447 | 0.28 | |
Majority | 100 | 0.06 | ||
Total votes | 159,142 | 100.00 |
Party | Candidate | Votes | % | |
---|---|---|---|---|
Republican | John Chafee | 230,329 | 57.74 | |
Democratic | Richard P. Lorber | 167,665 | 42.03 | |
Communist | Margaret Cann | 912 | 0.23 | |
Majority | 62,664 | 15.71 | ||
Total votes | 398,906 | 100.00 | ||
Republican gain from Democratic |
![]() | |||||||||||||||||
| |||||||||||||||||
![]() County results Sasser: 50–60% 60–70% 70–80% 80–90% Brock: 50–60% 60–70% 70–80% | |||||||||||||||||
|
Incumbent Republican Bill Brock ran for re-election to a second term, but was defeated by Democratic challenger James Sasser.
Party | Candidate | Votes | % | ±% | |
---|---|---|---|---|---|
Democratic | James Sasser | 751,180 | 52.46 | ||
Republican | Bill Brock (Incumbent) | 673,231 | 47.01 | −5.44% | |
Independent | Mark Clark Bates | 5,137 | 0.36 | ||
Independent | Willie C. Jacox | 1,406 | 0.10 | ||
Independent | Arnold Joseph Zandie | 1,061 | 0.07 | ||
None | Write-Ins | 31 | 0.00 | ||
Majority | 77,949 | 5.45 | |||
Turnout | 1,432,046 | ||||
Democratic gain from Republican | Swing |
![]() | |||||||||||||||||
| |||||||||||||||||
![]() County results Bentsen: 50–60% 60–70% 70–80% 80–90% >90% Steelman: 50–60% 60–70% | |||||||||||||||||
|
Incumbent Democrat Lloyd Bentsen won re-election to a second term over Republican Alan Steelman, U.S. Representative from Texas's 5th district.
Party | Candidate | Votes | % | |
---|---|---|---|---|
Democratic | Lloyd Bentsen (Incumbent) | 2,199,956 | 56.8 | |
Republican | Alan Steelman | 1,636,370 | 42.2 | |
Socialist Workers Party | Pedro Vasquez | 20,549 | 0.5 | |
American Independent | Marjorie P. Gallion | 17,355 | 0.5 | |
Majority | 563,586 | 14.6 | ||
Turnout | 3,874,230 | |||
Democratic hold |
![]() | |||||||||||||||||
| |||||||||||||||||
![]() County results Hatch: 40–50% 50-60% 60-70% 70-80% Moss: 50–60% 60–70% | |||||||||||||||||
|
Incumbent Democrat Frank Moss ran for re-election to a fourth term but was defeated by his Republican opponent Orrin Hatch.
Party | Candidate | Votes | % | ±% | |
---|---|---|---|---|---|
Republican | Orrin Hatch | 290,221 | 53.73% | ||
Democratic | Frank Moss (incumbent) | 241,948 | 44.80% | ||
Independent American | George M. Batchelor | 4,913 | 0.91% | ||
Libertarian | Steve Trotter | 3,026 | 0.56% | ||
Majority | 48,273 | 8.93% | |||
Turnout | 540,108 | ||||
Republican gain from Democratic | Swing |
![]() | |||||||||||||||||
| |||||||||||||||||
Stafford: 40-50% 50-60% 60-70% 70-80% Salmon: 40-50% 50-60% 60-70% | |||||||||||||||||
|
Incumbent Republican Robert Stafford successfully ran for re-election to another term in the United States Senate, defeating Democratic candidate Governor Thomas P. Salmon.
Party | Candidate | Votes | % | |
---|---|---|---|---|
Republican | Robert Stafford (Incumbent) | 24,338 | 68.7 | |
Republican | John J. Welch | 10,911 | 30.8 | |
Republican | Other | 178 | 0.5 | |
Total votes | 35,427 | 100 |
Party | Candidate | Votes | % | |
---|---|---|---|---|
Democratic | Thomas P. Salmon | 21,674 | 52.7 | |
Democratic | Scott Skinner | 19,238 | 46.8 | |
Democratic | Other | 178 | 0.4 | |
Total votes | 41,090 | 100 |
Party | Candidate | Votes | % | |
---|---|---|---|---|
Republican | Robert Stafford (Incumbent) | 94,481 | 50.0 | |
Democratic | Thomas P. Salmon | 82,174 | 43.5 | |
Independent Vermonters | Thomas P. Salmon | 3,508 | 1.9 | |
Total | Thomas P. Salmon | 85,682 | 45.4 | |
Liberty Union | Nancy Kaufman | 8,801 | 4.7 | |
N/A | Other | 96 | 0.1 | |
Total votes | 189,060 | 100 | ||
Majority | 12,307 | 6.5 | ||
Republican hold |
![]() | |||||||||||||||||
Turnout | 47.0% [30] | ||||||||||||||||
---|---|---|---|---|---|---|---|---|---|---|---|---|---|---|---|---|---|
| |||||||||||||||||
![]() County and independent city results Byrd: 40–50% 50–60% 60–70% 70–80% 80–90% Zumwalt: 40–50% 50–60% 60–70% Perper: 40–50% | |||||||||||||||||
|
Incumbent Independent Harry F. Byrd Jr. was re-elected to a second term over retired Admiral Elmo Zumwalt and state legislator Martin H. Perper.
Party | Candidate | Votes | % | ±% | |
---|---|---|---|---|---|
Independent | Harry F. Byrd Jr. (Incumbent) | 890,778 | 57.19 | +3.65% | |
Democratic | Elmo Zumwalt | 596,009 | 38.27 | +7.12% | |
Independent | Martin H. Perper | 70,559 | 4.53 | ||
Write-ins | 154 | 0.01 | |||
Majority | 294,769 | 18.93 | −3.45% | ||
Turnout | 1,557,500 | ||||
Independent hold |
![]() | |||||||||||||||||
| |||||||||||||||||
![]() County results Jackson: 40–50% 50–60% 60–70% 70–80% | |||||||||||||||||
|
Party | Candidate | Votes | % | |
---|---|---|---|---|
Democratic | Henry M. Jackson (Incumbent) | 1,071,219 | 71.84 | |
Republican | George M. Brown | 361,546 | 24.25 | |
American Independent | Dave Smith | 28,182 | 1.89 | |
Libertarian | Richard K. Kenney | 19,973 | 1.30 | |
Socialist Workers | Karl Bermann | 7,402 | 0.50 | |
U.S. Labor | William F. Wertz Jr. | 3,389 | 0.23 | |
Majority | 709,673 | 47.59 | ||
Turnout | 1,491,111 | |||
Democratic hold |
![]() | |||||||||||||||||
| |||||||||||||||||
![]() County results Byrd: 100% | |||||||||||||||||
|
For most of the state's history, West Virginia has been a solidly Democratic state. Often, winning the Democratic primary was tantamount to winning the general election in the state. Despite West Virginia occasionally electing a Republican governor (Arch A. Moore Jr. and Cecil H. Underwood both served as governor) and voting for Dwight D. Eisenhower in 1956, West Virginia has only elected Democratic Senators since 1958. Byrd had faced Republican opposition every term since he defeated Chapman Revercomb in 1958, but the Republicans chose not to mount a nominee in 1976. [31] Freshman Congressman Cleve Benedict would serve as the Republican nominee in 1982.
Party | Candidate | Votes | % | |
---|---|---|---|---|
Democratic | Robert Byrd (Incumbent) | 566,359 | 100.00 | |
Democratic hold |
![]() | |||||||||||||||||
| |||||||||||||||||
![]() County results Proxmire: 50–60% 60–70% 70–80% 80–90% | |||||||||||||||||
|
Originally elected in 1957 to fill the seat of Joseph McCarthy, William Proxmire had won re-election three times prior to 1976. He only faced significant Republican opposition twice during his re-election years, winning 70% of the vote and every county in 1970. Clergyman Stanley York was the Republican nominee. Proxmire ultimately defeated York and increased his margin of victory by 4%. Proxmire would serve two more terms, ultimately retiring in 1989.
Party | Candidate | Votes | % | |
---|---|---|---|---|
Democratic | William Proxmire (Incumbent) | 1,396,970 | 72.19 | |
Republican | Stanley York | 521,902 | 26.97 | |
Democratic Socialist | William Osborne Hart | 7,354 | 0.38 | |
Socialist Workers | Robert Schwarz | 4,876 | 0.25 | |
Labor Party | Michael A. MacLaurin | 2,148 | 0.11 | |
Socialist Labor | Robert E. Nordlander | 1,731 | 0.09 | |
None | Write-Ins | 202 | 0.01 | |
Majority | 875,068 | 45.22 | ||
Turnout | 1,935,183 | |||
Democratic hold |
![]() | |||||||||||||||||
| |||||||||||||||||
| |||||||||||||||||
![]() County results Wallop: 50–60% 60–70% 70–80% McGee: 50–60% | |||||||||||||||||
|
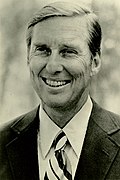
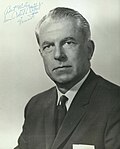
Gale W. McGee, the incumbent senator and former professor at the University of Wyoming, was originally elected in 1958 over Frank A. Barrett. He subsequently won two more elections to the senate over John S. Wold. McGee, who managed to become re-elected several times in a heavily Republican-leaning state, faced headwinds from Gerald Ford's popularity in the state. State senator Malcolm Wallop was the Republican nominee.
In the general election, Wallop comfortably defeated McGee, who won just four counties in the state. To date, McGee is the last Democratic senator from the state of Wyoming.
Party | Candidate | Votes | % | |
---|---|---|---|---|
Republican | Malcolm Wallop | 84,810 | 54.59 | |
Democratic | Gale McGee (Incumbent) | 70,558 | 45.41 | |
Majority | 14,252 | 9.12 | ||
Turnout | 155,368 | |||
Republican gain from Democratic |
The 2002 United States Senate elections featured a series of fiercely contested elections that resulted in a victory for the Republican Party, which gained two seats and thus a narrow majority from the Democratic Party in the United States Senate. The Senate seats up for election, known as class 2 Senate seats, were last up for regular election in 1996. The election cycle was held on November 5, 2002, almost 14 months after the September 11, 2001, attacks.
The 1998 United States Senate elections were held on November 3, 1998, with the 34 seats of Class 3 contested in regular elections. This was seen as an even contest between the Republican Party and Democratic Party. While the Democrats had to defend more seats up for election, Republican attacks on the morality of President Bill Clinton failed to connect with voters and anticipated Republican gains did not materialize. The Republicans picked open seats up in Ohio and Kentucky and narrowly defeated Democratic incumbent Carol Moseley Braun, but these were cancelled out by the Democrats' gain of an open seat in Indiana and defeats of Republican Senators Al D'Amato and Lauch Faircloth. The balance of the Senate remained unchanged at 55–45 in favor of the Republicans.
The 1996 United States Senate elections were held on November 5, 1996, with the 33 seats of Class 2 contested in regular elections. Special elections were also held to fill vacancies. They coincided with the presidential election of the same year, in which Democrat Bill Clinton was re-elected president.
The 1990 United States Senate elections were held on Tuesday, November 6, 1990, with the 33 seats of Class 2 contested in regular elections. Special elections were also held to fill vacancies. The Democratic Party increased its majority with a net gain of one seat from the Republican Party. The election cycle took place in the middle of President George H. W. Bush's term, and as with most other midterm elections, the party not holding the presidency gained seats in Congress. This was the first time since 1980 that any party successfully defended all their own seats, and the first time Democrats did so since 1958.
The 1988 United States Senate elections were elections for the United States Senate. Held on November 8, 1988, the 33 seats of Class 1 were contested in regular elections. In spite of the Republican victory by George H. W. Bush in the presidential election, the Democrats gained a net of 1 seat in the Senate. 7 seats changed parties, with 4 incumbents being defeated. The Democratic majority in the Senate increased by one to 55–45.
The 1986 United States Senate elections were elections for the United States Senate. Held on November 4, in the middle of Ronald Reagan's second presidential term, the 34 seats of Class 3 were contested in regular elections. The Republicans had to defend an unusually large number of freshman Senate incumbents who had been elected on President Ronald Reagan's coattails in 1980. Democrats won a net of eight seats, defeating seven freshman incumbents, picking up two Republican-held open seats, and regaining control of the Senate for the first time since January 1981. This remains the most recent midterm election cycle in which the sitting president's party suffered net losses while still flipping a Senate seat.
The 1984 United States Senate elections were held on November 6, with the 33 seats of Class 2 contested in regular elections. They coincided with the landslide re-election of President Ronald Reagan in the presidential election. In spite of the lopsided presidential race, Reagan's Republican Party suffered a net loss of two Senate seats to the Democrats, although it retained control of the Senate with a reduced 53–47 majority.
The 1982 United States Senate elections were held on November 2, 1982. They were elections for the United States Senate following Republican gains in 1980. The 33 Senate seats of Class 1 were up for election in 1982. A total of four seats changed hands between parties, with Democrats winning seats in New Jersey and New Mexico, and Republicans taking seats in Nevada and the seat of the lone independent, Senator Harry Byrd Jr., in Virginia. Democrats made a net gain of one seat bringing them to 46 seats, while Republicans stayed at 54 seats for a majority. However, the Democratic gain in New Jersey replaced a Republican that had been appointed earlier in the year. Liberal Republicans senators in Connecticut, Rhode Island and Vermont held onto their seats, keeping the Senate in Republican hands.
The 1980 United States Senate elections were held on November 4, coinciding with Ronald Reagan's victory in the presidential election. The 34 Senate seats of Class 3 were contested in regular elections. Reagan's large margin of victory over incumbent Jimmy Carter gave a huge boost to Republican Senate candidates, allowing them to flip 12 Democratic seats and win control of the chamber for the first time since the end of the 83rd Congress in January 1955. This was the first time since 1966 that any party successfully defended all their own seats.
The 1978 United States Senate elections were held on November 7, in the middle of Democratic President Jimmy Carter's term. The 33 seats of Class 2 were contested in regular elections. Special elections were also held to fill vacancies.
The 1974 United States Senate elections were held on November 5, with the 34 seats of Class 3 contested in regular elections. They occurred in the wake of the Watergate scandal, Richard M. Nixon's resignation from the presidency, and Gerald Ford's subsequent pardon of Nixon. Economic issues, specifically inflation and stagnation, were also a factor that contributed to Republican losses. As an immediate result of the November 1974 elections, Democrats made a net gain of three seats from the Republicans, as they defeated Republican incumbents in Colorado and Kentucky and picked up open seats in Florida and Vermont, while Republicans won the open seat in Nevada. Following the elections, at the beginning of the 94th U.S. Congress, the Democratic caucus controlled 60 seats, and the Republican caucus controlled 38 seats.
The 1972 United States Senate elections were held on November 7, with the 33 seats of Class 2 contested in regular elections. They coincided with the landslide re-election of Republican President Richard Nixon. Despite Nixon's landslide victory, Democrats increased their majority by two seats. The Democrats picked up open seats in Kentucky and South Dakota, and defeated four incumbent senators: Gordon Allott of Colorado, J. Caleb Boggs of Delaware, Jack Miller of Iowa, and Margaret Chase Smith of Maine. The Republicans picked up open seats in New Mexico, North Carolina, and Oklahoma, and defeated one incumbent, William B. Spong Jr. of Virginia.
The 1970 United States Senate elections was an election for the United States Senate. It took place on November 3, with the 33 seats of Class 1 contested in regular elections. Special elections were also held to fill vacancies. These races occurred in the middle of Richard Nixon's first term as president. The Democrats lost a net of three seats, while the Republicans and the Conservative Party of New York picked up one net seat each, and former Democrat Harry F. Byrd Jr. was re-elected as an independent.
The 1968 United States Senate elections were elections for the United States Senate. Held on November 5, the 34 seats of Class 3 were contested in regular elections. They coincided with the presidential election of the same year. The Republicans picked up five net seats in the Senate. This saw Republicans win a Senate seat in Florida for the first time since Reconstruction.
The 1964 United States Senate elections were held on November 3. The 33 seats of Class 1 were contested in regular elections. Special elections were also held to fill vacancies. They coincided with the election of President Lyndon B. Johnson by an overwhelming majority, to a full term. His Democratic Party picked up a net two seats from the Republicans. As of 2023, this was the last time either party has had a two-thirds majority in the Senate, which allowed the Senate Democrats to override a veto, propose constitutional amendments, or convict and expel certain officials without any votes from Senate Republicans. However, internal divisions would have prevented the Democrats from having done so. The Senate election cycle coincided with Democratic gains in the House in the same year.
The 1962 United States Senate elections was an election for the United States Senate. Held on November 6, the 34 seats of Class 3 were contested in regular elections. Special elections were also held to fill vacancies. They occurred in the middle of President John F. Kennedy's term. His Democratic Party made a net gain of four seats from the Republicans, increasing their control of the Senate to 68–32. However, this was reduced to 67–33 between the election and the next Congress, as on November 18, 1962, Democrat Dennis Chávez, who was not up for election that year, died. He was replaced on November 30, 1962, by Republican appointee Edwin L. Mechem. Additionally, Democrat Strom Thurmond became a Republican in 1964, further reducing Democrats to 66–34. This was the first time since 1932 that Democrats gained seats in this class of Senators.
The 1960 United States Senate elections coincided with the election of John F. Kennedy as president on November 8, 1960. The 33 seats of Class 2 were contested in regular elections. A special election was also held on June 28, 1960, for a mid-term vacancy in North Dakota where Democrats flipped a seat to expand their majority to 66–34. As Majority Leader Lyndon Johnson was elected Vice President, Mike Mansfield became the new majority leader.
The 1958 United States Senate elections were elections for the United States Senate which occurred in the middle of President Dwight D. Eisenhower's second term. Thirty-two seats of Class 1 were contested in regular elections, the new state of Alaska held its first Senate elections for its Class 2 and 3 seats, and two special elections were held to fill vacancies.
The 1954 United States Senate elections was a midterm election in the first term of Dwight D. Eisenhower's presidency. The 32 Senate seats of Class 2 were contested in regular elections, and six special elections were held to fill vacancies. Eisenhower's Republican party lost a net of two seats to the Democratic opposition. This small change was just enough to give Democrats control of the chamber with the help of the Independent who at the start of this Congress in January 1955 agreed to caucus with them; he later officially joined the party in April 1955.
The 1912–13 United States Senate elections were held on various dates in various states. They were the last U.S. Senate elections before the ratification of the Seventeenth Amendment in 1913, establishing direct elections for all Senate seats. Senators had been primarily chosen by state legislatures. Senators were elected over a wide range of time throughout 1912 and 1913, and a seat may have been filled months late or remained vacant due to legislative deadlock. Some states elected their senators directly even before passage of Seventeenth Amendment. Oregon pioneered direct election and experimented with different measures over several years until it succeeded in 1907. Soon after, Nebraska followed suit and laid the foundation for other states to adopt measures reflecting the people's will. By 1912, as many as 29 states elected senators either as nominees of their party's primary or in conjunction with a general election.