List of United States Senate elections in California

Last updated

United States Senate elections in California occur when voters in the U.S. state of California select an individual to represent the state in the United States Senate in either of the state's two seats allotted by the Constitution. Regularly scheduled general elections occur on Election Day, coinciding with various other federal, statewide, and local races.

Contents

Each state is allotted two U.S. Senators elected to staggered six-year terms, which were originally selected by the state legislature. The Senate is divided into three classes to stagger the terms of its members such that one-third of the Senate would be up for re-election every two years. Upon California's admission to the Union in 1850, the state was assigned a Class 1 seat and a Class 3 seat, first elected in 1849. Since the passage of the Seventeenth Amendment in 1913, U.S. Senators are elected directly by the voters of each state. Special elections may be held to fill mid-term vacancies to elect an individual to serve the remainder of the unexpired term.

The list below contains results from all U.S. Senate elections held in California after the passage of the Seventeenth Amendment, sorted by year. The next scheduled election for the Class 1 seat is in 2030, while the Class 3 seat will hold its next election in 2028.

List of recent elections

Class 1

YearWinnerRunner(s)-upOthersRef
CandidatePartyVotes%CandidatePartyVotes%Votes%
1916 Hiram Johnson Republican [a] 574,66761.09% George S. Patton Democratic 277,85229.54%38,7974.12% [1]
Walter Thomas Mills Socialist 49,3415.25%
1922 Hiram Johnson* Republican 564,42262.17%William J. Pearson Democratic 215,74823.76% [2]
Henry Clay Needham Prohibition 70,7487.79%
Upton Sinclair Socialist 56,9826.28%
1928 Hiram Johnson* Republican 1,148,39774.11%Minor Moore Democratic 282,41118.23%26,6241.72% [3]
Charles Hiram Randall Prohibition 92,1065.94%
1934 Hiram Johnson* Republican [b] 1,946,57294.66% George Ross Kirkpatrick Socialist 108,7485.29%1,0250.05% [4]
1940 Hiram Johnson* Republican [c] 2,238,89982.62%Fred Dyster Prohibition 366,04413.51%104,8933.87% [5]
1946 (sp) William Knowland* Write-in 425,27374.31% Will Rogers Jr. Write-in 90,72315.85%56,3259.84% [6]
1946 William Knowland* Republican 1,428,06754.10% Will Rogers Jr. Democratic 1,167,16144.22%44,2371.68%
1952 William Knowland* Republican [b] 3,982,44887.79%Reuben W. Borough Progressive 542,27011.95%11,8120.26% [7]
1958 Clair Engle Democratic 2,927,69357.01% Goodwin Knight Republican 2,204,33742.93%3,1910.06% [8]
1964 George Murphy Republican 3,628,55251.54% Pierre Salinger* Democratic 3,411,91548.46% [9]
1970 John V. Tunney Democratic 3,496,55853.86% George Murphy* Republican 2,877,61744.33%117,9821.81% [10]
1976 S. I. Hayakawa Republican 3,748,97350.17% John V. Tunney* Democratic 3,502,86246.88%220,4332.95% [11]
1982 Pete Wilson Republican 4,022,56551.54% Jerry Brown Democratic 3,494,96844.78%288,0053.68% [12]
1988 Pete Wilson* Republican 5,143,40952.79% Leo T. McCarthy Democratic 4,287,25344.00%312,9393.21% [13]
1992 (sp) Dianne Feinstein Democratic 5,853,65154.29% John Seymour* Republican 4,093,50137.96%835,5917.75% [14]
1994 Dianne Feinstein* Democratic 3,979,15246.74% Michael Huffington Republican 3,817,02544.83%717,9128.43% [15]
2000 Dianne Feinstein* Democratic 5,932,52255.84% Tom Campbell Republican 3,886,85336.59%804,2397.57% [16]
2006 Dianne Feinstein* Democratic 5,076,28959.43% Dick Mountjoy Republican 2,990,82235.02%474,3655.55% [17]
2012 Dianne Feinstein* Democratic 7,864,62462.52%Elizabeth Emken Republican 4,713,88737.48%N/A [d] [18]
2018 Dianne Feinstein* Democratic 6,019,42254.16% Kevin de León Democratic 5,093,94245.84%N/A [d] [19]
2024 (sp) Adam Schiff Democratic 8,837,05158.75% Steve Garvey Republican 6,204,63741.25%N/A [d]
2024 Adam Schiff Democratic 9,036,25258.87% Steve Garvey Republican 6,312,59441.13%N/A [d]
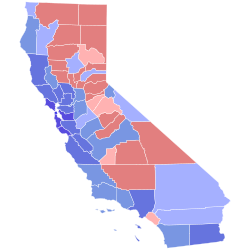
County results of Class 1 elections since 2000

Class 3

YearWinnerRunner(s)-upOthersRef
CandidatePartyVotes%CandidatePartyVotes%Votes%
1914 James D. Phelan Democratic 279,89631.59% Francis J. Heney Progressive 255,23228.81%39,9214.51% [20]
Joseph R. Knowland Republican 254,15928.69%
Ernest Untermann Socialist 56,8056.41%
1920 Samuel M. Shortridge Republican 447,83549.01% James D. Phelan* Democratic 371,58040.67%36,5454.00% [21]
James S. Edwards Prohibition 57,7686.32%
1926 Samuel M. Shortridge* Republican 670,12863.12%John B. Elliott Democratic 391,59936.88% [22]
1932 William Gibbs McAdoo Democratic 943,16443.39% Tallant Tubbs Republican 669,67630.81%9060.03% [23]
Robert P. Shuler Prohibition 560,08825.77%
1938 Sheridan Downey Democratic [e] 1,372,31454.43%Philip Bancroft Republican 1,126,24044.67%22,5690.90% [24]
1944 Sheridan Downey* Democratic 1,728,15552.29% Frederick F. Houser Republican [f] 1,576,55347.71% [25]
1950 Richard Nixon Republican 2,183,45459.23% Helen Gahagan Douglas Democratic 1,502,50740.76%3540.01% [26]
1954 (sp) Thomas Kuchel* Republican 2,090,83653.21% Sam Yorty Democratic 1,788,07145.51%50,5061.29% [27]
1956 Thomas Kuchel* Republican 2,892,91853.96%Richard Richards Democratic 2,445,81645.62%22,4100.42% [28]
1962 Thomas Kuchel* Republican 3,180,48356.33%Richard Richards Democratic 2,452,83943.44%12,9410.23% [29]
1968 Alan Cranston Democratic 3,680,35251.82% Max Rafferty Republican 3,329,14846.87%92,9651.31% [30]
1974 Alan Cranston* Democratic 3,693,16060.52% H. L. Richardson Republican 2,210,26736.22%199,0053.26% [31]
1980 Alan Cranston* Democratic 4,705,39956.50% Paul Gann Republican 3,093,42637.15%528,6576.35% [32]
1986 Alan Cranston* Democratic 3,646,67249.29% Ed Zschau Republican 3,541,80447.87%210,0732.84% [33]
1992 Barbara Boxer Democratic 5,173,46747.90% Bruce Herschensohn Republican 4,644,18243.00%982,0549.10% [14]
1998 Barbara Boxer* Democratic 4,411,70553.06% Matt Fong Republican 3,576,35143.01%326,8973.93% [34]
2004 Barbara Boxer* Democratic 6,955,72857.71% Bill Jones Republican 4,555,92237.80%541,6437.49% [35]
2010 Barbara Boxer* Democratic 5,218,44152.18% Carly Fiorina Republican 4,217,36642.17%564,3535.65% [36]
2016 Kamala Harris Democratic 7,542,75361.60% Loretta Sanchez Democratic 4,701,41738.40%N/A [d] [37]
2022 (sp) Alex Padilla* Democratic 6,559,30360.89%Mark Meuser Republican 4,212,44639.11%N/A [d] [38]
2022 Alex Padilla* Democratic 6,621,61661.06%Mark Meuser Republican 4,222,02538.94%N/A [d] [39]
County results of Class 3 elections since 2004

See also

Notes

References

  1. "CA US Senate Race - Nov 07, 1916". Our Campaigns.
  2. "Statistics of the Congressional Election of November 7, 1922" (PDF). Clerk of the United States House of Representatives .
  3. "Statistics of the Congressional and Presidential Election of November 6, 1928" (PDF). Clerk of the United States House of Representatives .
  4. "Statistics of the Congressional Election of November 6, 1934" (PDF). Clerk of the United States House of Representatives .
  5. "Statistics of the Presidential and Congressional Election of November 5, 1940" (PDF). Clerk of the United States House of Representatives .
  6. "Statistics of the Congressional Election of November 5, 1946" (PDF). Clerk of the United States House of Representatives .
  7. "Statistics of the Presidential and Congressional Election of November 4, 1952" (PDF). Clerk of the United States House of Representatives .
  8. "Statistics of the Congressional Election of November 4, 1958" (PDF). Clerk of the United States House of Representatives .
  9. "Statistics of the Presidential and Congressional Election of November 3, 1964" (PDF). Clerk of the United States House of Representatives .
  10. "Statistics of the Congressional Election of November 3, 1970" (PDF). Clerk of the United States House of Representatives .
  11. "Statistics of the Presidential and Congressional Election of November 2, 1976" (PDF). Clerk of the United States House of Representatives .
  12. "Federal Elections 1982" (PDF). Federal Election Commission .
  13. "Federal Elections 1988" (PDF). Federal Election Commission .
  14. 1 2 "Federal Elections 1992" (PDF). Federal Election Commission .
  15. "Federal Elections 1994" (PDF). Federal Election Commission .
  16. "Federal Elections 2000" (PDF). Federal Election Commission .
  17. "Federal Elections 2006" (PDF). Federal Election Commission .
  18. "Federal Elections 2012" (PDF). Federal Election Commission .
  19. "Federal Elections 2018" (PDF). Federal Election Commission .
  20. "CA US Senate Race - Nov 03, 1914". Our Campaigns.
  21. "Statistics of the Congressional and Presidential Election of November 2, 1920" (PDF). Clerk of the United States House of Representatives .
  22. "Statistics of the Congressional Election of November 2, 1926" (PDF). Clerk of the United States House of Representatives .
  23. "Statistics of the Congressional and Presidential Election of November 8, 1932" (PDF). Clerk of the United States House of Representatives .
  24. "Statistics of the Congressional Election of November 8, 1938" (PDF). Clerk of the United States House of Representatives .
  25. "Statistics of the Presidential and Congressional Election of November 7, 1944" (PDF). Clerk of the United States House of Representatives .
  26. "Statistics of the Congressional Election of November 7, 1950" (PDF). Clerk of the United States House of Representatives .
  27. "Statistics of the Congressional Election of November 2, 1954" (PDF). Clerk of the United States House of Representatives .
  28. "Statistics of the Presidential and Congressional Election of November 6, 1956" (PDF). Clerk of the United States House of Representatives .
  29. "Statistics of the Congressional Election of November 6, 1962" (PDF). Clerk of the United States House of Representatives .
  30. "Statistics of the Presidential and Congressional Election of November 5, 1968" (PDF). Clerk of the United States House of Representatives .
  31. "Statistics of the Congressional Election of November 4, 1974" (PDF). Clerk of the United States House of Representatives .
  32. "Statistics of the Presidential and Congressional Election of November 4, 1980" (PDF). Clerk of the United States House of Representatives .
  33. "Federal Elections 1986" (PDF). Federal Election Commission .
  34. "Federal Elections 1998" (PDF). Federal Election Commission .
  35. "Federal Elections 2004" (PDF). Federal Election Commission .
  36. "Federal Elections 2010" (PDF). Federal Election Commission .
  37. "Federal Elections 2016" (PDF). Federal Election Commission .
  38. "United States Senator (Partial Term) - General Election - Statement of the Vote, November 8, 2022" (PDF). Secretary of State of California .
  39. "United States Senator (Full Term) - General Election - Statement of the Vote, November 8, 2022" (PDF). Secretary of State of California .