Presidential elections in California
 | |
| Number of elections | 44 |
|---|---|
| Voted Democratic | 20 |
| Voted Republican | 22 |
| Voted other | 2 [a] |
| Voted for winning candidate | 35 |
| Voted for losing candidate | 9 |

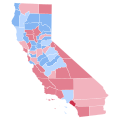
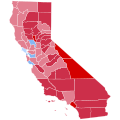
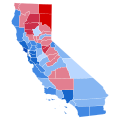
Since being admitted to the Union on September 9, 1850, California has participated in 43 presidential elections. A bellwether from 1888 to 1996, voting for the losing candidates only three times in that span, California has become a reliable state for Democratic presidential candidates since 1992.