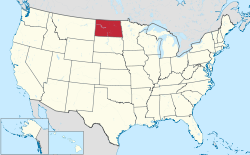
United States presidential elections in North Dakota

Last updated

Presidential elections in North Dakota
North Dakota in United States.svg
Number of elections34
Voted Democratic5
Voted Republican28
Voted other1 [a]
Voted for winning candidate23
Voted for losing candidate11

Following is a table of United States presidential elections in North Dakota, ordered by year. Since its admission to statehood in 1889, North Dakota has participated in every U.S. presidential election.

Contents

Winners of the state are in bold. The shading refers to the state winner, and not the national winner.

YearWinner (nationally)VotesPercentRunner-up (nationally)VotesPercentOther national
candidates [b]
VotesPercentElectoral
votes
Notes
2024 [1] Donald Trump 246,50566.96 Kamala Harris 112,32730.51__3
2020 [2] Joe Biden 114,90231.76 Donald Trump 235,59565.113
2016 [3] Donald Trump [c] 216,79462.96 Hillary Clinton 93,75827.23__3
2012 [4] Barack Obama 124,82738.69 Mitt Romney 188,16358.323
2008 [5] Barack Obama 141,27844.62 John McCain 168,60153.253
2004 [6] George W. Bush 196,65162.86 John Kerry 111,05235.53
2000 [7] George W. Bush [c] 174,85260.66 Al Gore 95,28433.063
1996 [8] Bill Clinton 106,90540.13 Bob Dole 125,05046.94 Ross Perot 32,51512.23
1992 Bill Clinton 99,16832.18 George H. W. Bush 136,24444.22 Ross Perot 71,08423.073
1988 George H. W. Bush 166,55956.03 Michael Dukakis 127,73942.973
1984 Ronald Reagan 200,33664.84 Walter Mondale 104,42933.83
1980 Ronald Reagan 193,69564.23 Jimmy Carter 79,18926.26 John B. Anderson 23,6407.843
1976 Jimmy Carter 136,07845.80 Gerald Ford 153,47051.663
1972 Richard Nixon 174,10962.07 George McGovern 100,38435.793
1968 Richard Nixon 138,66955.94 Hubert Humphrey 94,76938.23 George Wallace 14,2445.754
1964 Lyndon B. Johnson 149,78457.97 Barry Goldwater 108,20741.884
1960 John F. Kennedy 123,96344.52 Richard Nixon 154,31055.424
1956 Dwight D. Eisenhower 156,76661.72 Adlai Stevenson II 96,74238.09 T. Coleman Andrews/
Unpledged Electors [d]
4830.194
1952 Dwight D. Eisenhower 191,71270.97 Adlai Stevenson II 76,69428.394
1948 Harry S. Truman 95,81243.41 Thomas E. Dewey 115,13952.17 Strom Thurmond 3740.174
1944 Franklin D. Roosevelt 100,14445.48 Thomas E. Dewey 118,53553.844
1940 Franklin D. Roosevelt 124,03644.18 Wendell Willkie 154,59055.064
1936 Franklin D. Roosevelt 163,14859.60 Alf Landon 72,75126.584
1932 Franklin D. Roosevelt 178,35069.59 Herbert Hoover 71,772284
1928 Herbert Hoover 131,44154.80 Al Smith 106,64844.465
1924 Calvin Coolidge 94,93147.68 John W. Davis 13,8586.96 Robert M. La Follette 89,92245.175
1920 Warren G. Harding 160,07277.79 James M. Cox 37,42218.19 Parley P. Christensen 5
1916 Woodrow Wilson 55,20647.84 Charles E. Hughes 53,47146.345
1912 Woodrow Wilson 29,55534.14 Theodore Roosevelt 25,72629.71 William H. Taft 23,09026.675
1908 William H. Taft 57,68061.02 William Jennings Bryan 32,88534.794
1904 Theodore Roosevelt 52,59575.12 Alton B. Parker 14,27320.394
1900 William McKinley 35,89862.12 William Jennings Bryan 20,53135.533
1896 William McKinley 26,33555.57 William Jennings Bryan 20,68643.653
1892 Grover Cleveland 00 Benjamin Harrison 17,51948.50 James B. Weaver 17,70049.013Electoral vote split three ways, with each candidate getting one electoral vote.

See also

Notes

  1. James B. Weaver, 1892.
  2. For purposes of these lists, other national candidates are defined as those who won at least one electoral vote, or won at least ten percent of the vote in multiple states.
  3. 1 2 Won the electoral college while losing the popular vote
  4. Was allied with a slate of unpledged electors in Louisiana, Mississippi and South Carolina

References

  1. "Official (without recounts) 2024 General Election Results". Vote.nd.gov. Retrieved November 22, 2024.
  2. 2020 official Federal Election Commission report.
  3. 2016 official Federal Election Commission report.
  4. 2012 official Federal Election Commission report.
  5. 2008 official Federal Election Commission report.
  6. "Federal Elections 2004: Election Results for the U.S. President, the U.S. Senate and the U.S. House of Representatives" (PDF). Federal Elections Commission. May 2005.
  7. "2000 Presidential Election Statistics". Dave Leip’s Atlas of U.S. Presidential Elections.
  8. "1996 Presidential Election Statistics". Dave Leip’s Atlas of U.S. Presidential Elections. Retrieved March 5, 2018.