November 3, 2020 | |||||||||||||||||
| Turnout | 61.16% | ||||||||||||||||
|---|---|---|---|---|---|---|---|---|---|---|---|---|---|---|---|---|---|
| |||||||||||||||||
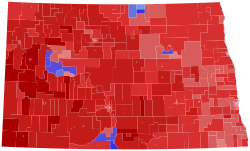
Armstrong: 40–50% 50–60% 60–70% 70–80% 80–90% >90% Raknerud: 40–50% 50–60% 60–70% 70–80% 80–90% | |||||||||||||||||
| |||||||||||||||||
| Elections in North Dakota |
|---|
The 2020 United States House of Representatives election in North Dakota was held on November 3, 2020, to elect the U.S. representative from North Dakota's at-large congressional district. The election coincided with the 2020 U.S. presidential election, as well as other elections to the House of Representatives, elections to the United States Senate, and various state and local elections.
The incumbent was Republican Kelly Armstrong, who was elected with 60.2% of the vote in 2018. [2] He was re-elected in 2020 and won 5 counties he lost in 2018.
| Party | Candidate | Votes | % | |
|---|---|---|---|---|
| Republican | Kelly Armstrong (incumbent) | 99,582 | 99.54% | |
| Republican | Write-in | 461 | 0.46% | |
| Total votes | 100,043 | 100.0% | ||
Labor unions
Organizations
| Party | Candidate | Votes | % | |
|---|---|---|---|---|
| Democratic–NPL | Zach Raknerud | 21,394 | 62.03% | |
| Democratic–NPL | Roland Riemers | 12,747 | 36.96% | |
| Democratic–NPL | Write-in | 346 | 1.00% | |
| Total votes | 34,487 | 100.0% | ||
| Party | Candidate | Votes | % | |
|---|---|---|---|---|
| Libertarian | Steven Peterson | 729 | 78.47% | |
| Libertarian | Write-in | 200 | 22.36% | |
| Total votes | 929 | 100.0% | ||
| Source | Ranking | As of |
|---|---|---|
| The Cook Political Report [10] | Safe R | November 2, 2020 |
| Inside Elections [11] | Safe R | October 28, 2020 |
| Sabato's Crystal Ball [12] | Safe R | November 2, 2020 |
| Politico [13] | Safe R | November 2, 2020 |
| Daily Kos [14] | Safe R | November 2, 2020 |
| RCP [15] | Safe R | November 2, 2020 |
| Party | Candidate | Votes | % | ±% | |
|---|---|---|---|---|---|
| Republican | Kelly Armstrong (incumbent) | 245,229 | 68.96% | +8.76% | |
| Democratic–NPL | Zach Raknerud | 97,970 | 27.55% | −8.02% | |
| Libertarian | Steven Peterson | 12,024 | 3.38% | N/A | |
| n/a | Write-ins | 375 | 0.11% | N/A | |
| Total votes | 355,598 | 100.00% | |||
| Republican hold | |||||
| County | Kelly Armstrong Republican | Zach Raknerud Democratic–NPL | All others | Margin | Total votes | ||||
|---|---|---|---|---|---|---|---|---|---|
| # | % | # | % | # | % | # | % | ||
| Adams | 1,010 | 80.4% | 213 | 17.0% | 33 | 2.6% | 797 | 63.4% | 1,256 |
| Barnes | 3,737 | 68.3% | 1,562 | 28.6% | 172 | 3.2% | 2,175 | 39.7% | 5,471 |
| Benson | 1,138 | 58.8% | 738 | 38.2% | 58 | 3.0% | 400 | 20.6% | 1,934 |
| Billings | 554 | 87.4% | 64 | 10.1% | 16 | 2.5% | 490 | 77.3% | 634 |
| Bottineau | 2,646 | 77.3% | 692 | 20.2% | 84 | 2.5% | 1,954 | 57.1% | 3,422 |
| Bowman | 1,413 | 85.9% | 195 | 11.9% | 37 | 2.3% | 1,218 | 74.0% | 1,645 |
| Burke | 977 | 86.2% | 140 | 12.3% | 17 | 1.5% | 837 | 73.9% | 1,134 |
| Burleigh | 36,122 | 72.4% | 12,111 | 24.3% | 1,643 | 3.3% | 24,011 | 48.1% | 49,876 |
| Cass | 46,877 | 55.5% | 34,055 | 40.3% | 3,603 | 4.3% | 12,822 | 15.2% | 84,535 |
| Cavalier | 1,548 | 77.7% | 400 | 20.1% | 44 | 2.3% | 1,148 | 57.6% | 1,992 |
| Dickey | 1,796 | 74.7% | 532 | 22.1% | 77 | 3.3% | 1,264 | 52.6% | 2,405 |
| Divide | 913 | 76.6% | 242 | 20.3% | 37 | 3.1% | 671 | 56.3% | 1,192 |
| Dunn | 1,948 | 83.6% | 319 | 13.7% | 62 | 2.7% | 1,629 | 69.9% | 2,329 |
| Eddy | 874 | 70.1% | 336 | 27.0% | 36 | 2.9% | 538 | 43.1% | 1,246 |
| Emmons | 1,736 | 87.7% | 207 | 10.5% | 37 | 1.9% | 1,529 | 77.2% | 1,980 |
| Foster | 1,391 | 79.6% | 318 | 18.2% | 38 | 2.2% | 1,073 | 61.4% | 1,747 |
| Golden Valley | 871 | 86.5% | 114 | 11.3% | 22 | 2.2% | 757 | 75.2% | 1,007 |
| Grand Forks | 18,427 | 61.0% | 10,746 | 35.6% | 1,038 | 3.5% | 7,681 | 25.4% | 30,211 |
| Grant | 1,163 | 84.3% | 189 | 13.7% | 27 | 2.0% | 974 | 70.6% | 1,379 |
| Griggs | 941 | 76.7% | 260 | 21.2% | 26 | 2.1% | 681 | 55.5% | 1,227 |
| Hettinger | 1,126 | 86.5% | 149 | 11.5% | 26 | 2.0% | 977 | 75.0% | 1,301 |
| Kidder | 1,217 | 83.6% | 212 | 14.6% | 27 | 1.9% | 1,005 | 69.0% | 1,456 |
| LaMoure | 1,695 | 77.2% | 437 | 19.9% | 63 | 2.8% | 1,258 | 57.3% | 2,195 |
| Logan | 914 | 86.6% | 113 | 10.7% | 28 | 2.7% | 801 | 75.9% | 1,055 |
| McHenry | 2,358 | 79.1% | 554 | 18.6% | 69 | 2.4% | 1,804 | 60.5% | 2,981 |
| McIntosh | 1,191 | 82.4% | 220 | 15.2% | 34 | 2.4% | 971 | 67.2% | 1,445 |
| McKenzie | 4,395 | 82.7% | 719 | 13.5% | 201 | 3.8% | 3,676 | 69.2% | 5,315 |
| McLean | 4,220 | 77.1% | 1,119 | 20.4% | 137 | 2.5% | 3,101 | 66.7% | 5,476 |
| Mercer | 3,871 | 83.5% | 668 | 14.4% | 98 | 2.1% | 3,203 | 69.1% | 4,637 |
| Morton | 12,382 | 75.8% | 3,375 | 20.6% | 587 | 3.6% | 9,007 | 55.2% | 16,344 |
| Mountrail | 2,819 | 68.8% | 1,154 | 28.2% | 125 | 3.1% | 1,665 | 40.6% | 4,098 |
| Nelson | 1,195 | 68.6% | 495 | 28.4% | 53 | 3.1% | 1,665 | 40.2% | 4,098 |
| Oliver | 906 | 85.9% | 121 | 11.5% | 28 | 2.7% | 785 | 74.4% | 1,055 |
| Pembina | 2,518 | 76.7% | 685 | 20.9% | 81 | 2.4% | 1,833 | 55.8% | 3,284 |
| Pierce | 1,633 | 78.0% | 411 | 19.6% | 49 | 2.3% | 1,222 | 57.6% | 2,093 |
| Ramsey | 3,786 | 71.1% | 1,362 | 25.6% | 175 | 3.3% | 2,424 | 45.5% | 5,323 |
| Ransom | 1,492 | 61.8% | 818 | 33.9% | 105 | 4.3% | 674 | 27.9% | 2,415 |
| Renville | 1,073 | 81.8% | 194 | 14.8% | 44 | 3.4% | 879 | 67.0% | 1,311 |
| Richland | 5,276 | 68.7% | 2,124 | 27.7% | 276 | 3.6% | 3,152 | 41.0% | 7,676 |
| Rolette | 1,344 | 36.0% | 2,292 | 61.3% | 102 | 2.8% | -948 | -25.3% | 3,738 |
| Sargent | 1,295 | 63.9% | 674 | 33.2% | 59 | 2.9% | 621 | 30.7% | 2,028 |
| Sheridan | 684 | 85.1% | 103 | 12.8% | 17 | 2.1% | 581 | 72.3% | 804 |
| Sioux | 294 | 25.1% | 728 | 62.1% | 150 | 12.8% | -434 | -37.1% | 1,172 |
| Slope | 377 | 89.5% | 37 | 8.8% | 7 | 1.7% | 340 | 80.7% | 421 |
| Stark | 12,408 | 83.5% | 1,981 | 13.3% | 463 | 3.1% | 10,427 | 70.2% | 14,852 |
| Steele | 704 | 65.6% | 344 | 32.1% | 25 | 2.3% | 360 | 33.5% | 1,073 |
| Stutsman | 7,005 | 73.0% | 2,252 | 23.5% | 342 | 3.6% | 4,753 | 49.5% | 9,599 |
| Towner | 866 | 75.0% | 271 | 23.5% | 18 | 1.6% | 595 | 51.5% | 1,155 |
| Traill | 2,709 | 66.1% | 1,275 | 31.1% | 115 | 2.8% | 1,434 | 35.0% | 4,099 |
| Walsh | 3,485 | 74.3% | 1,082 | 23.1% | 122 | 2.6% | 2,403 | 51.2% | 4,689 |
| Ward | 20,465 | 73.4% | 6,320 | 22.7% | 1,100 | 3.9% | 14,145 | 50.7% | 27,885 |
| Wells | 1,910 | 81.2% | 386 | 16.4% | 55 | 2.3% | 1,524 | 64.8% | 2,351 |
| Williams | 11,534 | 82.9% | 1,862 | 13.4% | 511 | 3.6% | 9,672 | 69.5% | 13,907 |
| Totals | 245,229 | 69.0% | 97,970 | 27.6% | 12,399 | 3.5% | 147,259 | 41.4% | 355,598 |
Counties that flipped from Democratic to Republican
Official campaign websites