2020 United States presidential election in Pennsylvania

Last updated

2020 United States presidential election in Pennsylvania
Flag of Pennsylvania.svg
  2016 November 3, 2020 2024  
Turnout76.5% [1]
  Joe Biden presidential portrait (cropped).jpg Donald Trump official portrait (cropped).jpg
Nominee Joe Biden Donald Trump
Party Democratic Republican
Home state Delaware Florida
Running mate Kamala Harris Mike Pence
Electoral vote200
Popular vote3,458,2293,377,674
Percentage50.01%48.84%

Pennsylvania Presidential Election Results 2020.svg
2020 Presidential election in Pennsylvania by congressional district.svg
PA President 2020.svg

President before election

Donald Trump
Republican

Elected President

Joe Biden
Democratic

The 2020 United States presidential election in Pennsylvania was held on Tuesday, November 3, 2020, as part of the 2020 United States presidential election in which all 50 states plus the District of Columbia participated. [2] Pennsylvania voters chose electors to represent them in the Electoral College via a popular vote, pitting the Republican Party's nominee, President Donald Trump, and running mate Vice President Mike Pence against Democratic Party nominee, former Vice President Joe Biden, and his running mate California Senator Kamala Harris. Pennsylvania has 20 electoral votes in the Electoral College. [3]

Contents

Although Trump had won the state in 2016 by a narrow margin of 0.72%, Biden was able to reclaim the state, winning it by a similarly narrow 1.17% margin. Because of the way the state counted in-person ballots first, Trump started with a wide lead on election night. However, over the next few days, Biden greatly closed the margin due to outstanding votes from Democratic-leaning areas, most notably Philadelphia and Pittsburgh, as well as mail-in ballots from all parts of the state which strongly favored him. On the morning of November 6, election-calling organization Decision Desk HQ forecast that Biden had won Pennsylvania's 20 electoral votes, and with them the election. [4] The following morning, November 7, at the same time that the Trump campaign was holding a press conference outside of a Philadelphia landscaping business, [5] nearly all major news organizations followed suit and called Pennsylvania for Biden, proclaiming him President-elect. [6]

One key to Biden's success in the state was his improvement on Hillary Clinton's margins in the large Philadelphia-area suburban counties: he won Bucks by 3.60% more than Clinton did, Delaware by 4.38% more, Montgomery by 4.80% more, and Chester—which Mitt Romney had narrowly won just eight years prior—by 6.60% more. At the same time, he reclaimed two of the three large industrial counties which had voted Democratic for at least six consecutive elections before Trump flipped them in 2016: Erie and Northampton. While Trump prevailed in the third, Luzerne County, he did so by a reduced margin with respect to 2016; and Biden increased the margin of victory in his birth county, Lackawanna County, which Trump had nearly flipped in 2016. Biden halted the four-election Democratic slide in formerly traditionally Democratic Westmoreland County, where, before 2020, Al Gore had been the last Democrat to improve on the previous nominee's vote share (and which had given Trump his margin in the state in 2016). He also improved on Clinton's margins in Lehigh County by 2.9% and won Allegheny County with the largest percentage of the vote since 1988. However, Biden's vote share in Philadelphia County actually declined slightly compared to Hillary Clinton's, although he still outperformed either Al Gore in 2000 or John Kerry in 2004 in the county. Biden would also become the first Democratic candidate running for president to garner at least 100,000 votes in the Republican stronghold county of Lancaster. [7] [8] He also became the second presidential candidate since 1964, the last time the county voted for a Democrat, to get at least 40% of the vote. [8] This was due to the large number of votes Biden received from the city of Lancaster and a competitive margin in voting precincts in and around Lititz and Columbia. [9]

Despite Biden's victory, Pennsylvania weighed in for this election as 3.28% more Republican than the national average. This is the second consecutive presidential election in which Pennsylvania voted to the right of the nation. Previously, it had not done so since 1948.

With Ohio, Florida, and Iowa backing the losing candidate for the first time since 1960, 1992, and 2000 respectively, this election established Pennsylvania, Wisconsin, and Michigan as the states with the longest bellwether streak still in effect today. The last time any of them voted against the winning candidate was 2004, when all three voted for the losing Democrat John Kerry.

Biden became the first Democrat to win the White House without carrying Luzerne County since Harry Truman in 1948. This was the first election since 1932 that the county voted for the statewide loser.

Primary elections

The primary elections were originally scheduled for April 28, 2020, also originally joining several northeastern states in holding primaries on the same date, including Connecticut, Delaware, Maryland, New York, and Rhode Island. [10] On March 26, Pennsylvania joined several other states in moving its primary to June 2 due to the COVID-19 pandemic. [11]

Republican primary

Even though the Republican National Committee mailed Pennsylvania voters encouraging mail-in voting, describing it as a "convenient and secure” option, most Republicans expressed opposition to the prospect. Earlier, the Republican-controlled House blocked a proposal to mail every Pennsylvanian a mail-in ballot application. This was in response to President Trump's skepticism of the practice, expressing concern mail-in voting may result in voter fraud that would potentially benefit the Democratic Party. [12]

2020 Pennsylvania Republican presidential primary [13]
CandidateVotes %Delegates [14]
Donald Trump 1,053,61692.1%34
Bill Weld 69,4276.1%0
Rocky De La Fuente 20,4561.8%0
Total1,143,499100%34

Trump was declared the winner in the Republican primary, and received all of the state's 34 pledged delegates to the 2020 Republican National Convention (the state also has 54 unpledged delegates). [14]

Democratic primary

2020 Pennsylvania Democratic presidential primary [15]
CandidateVotes %Delegates [16]
Joe Biden 1,264,62479.26151
Bernie Sanders (withdrawn)287,83418.0435
Tulsi Gabbard (withdrawn)43,0502.70
Total1,595,508100%186

Green Caucus

The Green Caucus was held during April 2020 and was won by Howie Hawkins. [17]

General election

Final predictions

SourceRanking
The Cook Political Report [18] Lean D (flip)
Inside Elections [19] Lean D (flip)
Sabato's Crystal Ball [20] Lean D (flip)
Politico [21] Lean D (flip)
RCP [22] Tossup
Niskanen [23] Likely D (flip)
CNN [24] Lean D (flip)
The Economist [25] Likely D (flip)
CBS News [26] Lean D (flip)
270towin [27] Lean D (flip)
ABC News [28] Lean D (flip)
NPR [29] Lean D (flip)
NBC News [30] Lean D (flip)
538 [31] Likely D (flip)

Polling

Graphical summary

Aggregate polls

Source of poll
aggregation
Dates
administered
Dates
updated
Joe
Biden

Democratic
Donald
Trump

Republican
Other/
Undecided
[lower-alpha 1]
Margin
270 to Win October 22 – November 2, 2020November 3, 202049.4%45.7%4.9%
Real Clear Politics October 29 – November 2, 2020November 3, 202048.7%47.5%3.8%
FiveThirtyEight until November 2, 2020November 3, 202050.2%45.6%4.2%
Average49.4%46.3%4.3%Biden +3.1

2020 polls

Poll sourceDate(s)
administered
Sample
size [lower-alpha 2]
Margin
of error
Donald
Trump

Republican
Joe
Biden

Democratic
Jo
Jorgensen

Libertarian
Howie
Hawkins

Green
Other Undecided
Susquehanna Polling & Research Inc. Nov 1–2499 (LV)± 4.3%49% [lower-alpha 3] 48%1%-0% [lower-alpha 4] 0%
SurveyMonkey/Axios Oct 20 – Nov 26,045 (LV)± 2%47% [lower-alpha 5] 52%--
Pulse Opinion Research/Rasmussen Reports Oct 31 – Nov 1800 (LV)± 3.5%47% [lower-alpha 3] 50%--1% [lower-alpha 6]
Research Co. Oct 31 – Nov 1450 (LV)± 4.6%46%52%--2% [lower-alpha 7] 4%
AYTM/Aspiration Oct 30 – Nov 1340 (LV)49%51%--
Change Research/CNBC Oct 29 – Nov 1699 (LV)± 3.71%46%50%2%-2%
Marist College/NBC Oct 29 – Nov 1772 (LV)± 4.4%46%51%--1%2%
Monmouth University Oct 28 – Nov 1502(RV)± 4.4%45%50%1%-0% [lower-alpha 8] 4%
502 (LV)44% [lower-alpha 9] 51%--
45% [lower-alpha 10] 50%--
Swayable Archived November 13, 2020, at the Wayback Machine Oct 27 – Nov 11,107 (LV)± 3.9%48%50%2%-
Data for Progress Oct 27 – Nov 11,417 (LV)± 2.6%45%52%2%0%0% [lower-alpha 11]
Ipsos/Reuters Oct 27 – Nov 1673 (LV)± 4.3%45% [lower-alpha 12] 51%1%1%2% [lower-alpha 13]
44% [lower-alpha 14] 51%--3% [lower-alpha 15] 2%
46% [lower-alpha 16] 52%--2% [lower-alpha 17]
Trafalgar Oct 30–311,062 (LV)± 2.93%48%46%2%-1% [lower-alpha 18] 4%
Frederick Polls/Compete Everywhere [upper-alpha 1] Oct 30–31879 (LV)± 3%48%52%--
Insider Advantage/Center for American Greatness [ permanent dead link ] [upper-alpha 2] Oct 30–31500 (LV)± 4.4%48.7%47.4%1.3%-2.6%
Siena College/NYT Upshot Oct 26–311,862 (LV)± 2.4%43%49%2%-0% [lower-alpha 19] 5% [lower-alpha 20]
Morning Consult Oct 22–312,686 (LV)± 2%43%52%--
Emerson College Oct 29–30823 (LV)± 3.3%47% [lower-alpha 3] 52%--2% [lower-alpha 7]
AtlasIntel Oct 29–30672 (LV)± 4%50%49%--2%
Targoz Market Research/PollSmart Oct 25–30998 (LV)42%56%--2% [lower-alpha 21]
Public Policy Polling/American Bridge PAC [upper-alpha 3] Oct 28–291,012 (V)45%52%--3%
Redfield & Wilton Strategies Oct 26–292,125 (LV)45%50%1%-1%3%
Harvard-Harris/The Hill Oct 26–29901 (LV)46%51%--3%
ABC/Washington Post Oct 24–29824 (LV)± 4%44%51%3%-0% [lower-alpha 22] 1%
Muhlenberg College/Morning Call Oct 23–28419 (LV)± 5.5%44%49%--4% [lower-alpha 23] 2%
SurveyMonkey/Axios Oct 1–2810,599 (LV)± 1.5%46%52%---
RMG Research/PoliticalIQ Archived October 29, 2020, at the Wayback Machine Oct 25–27800 (LV)± 3.5%45% [lower-alpha 12] 51%--2%2%
44% [lower-alpha 24] 52%--2%2%
47% [lower-alpha 25] 49%--2%2%
Quinnipiac University Oct 23–271,324 (LV)± 2.7%44%51%--1% [lower-alpha 18] 4%
Swayable Oct 23–26491 (LV)± 6%46%52%2%-
Civiqs/Daily Kos Oct 23–261,145 (LV)± 3%45%52%--2% [lower-alpha 7] 1%
Ipsos/Reuters Oct 20–26655 (LV)± 4.4%44% [lower-alpha 12] 51%3%0%1% [lower-alpha 26]
45% [lower-alpha 14] 50%--3% [lower-alpha 15] 2%
Insider Advantage/Center for American Greatness [upper-alpha 2] Oct 25400 (LV)± 4.9%48.5%45.5%3.3%-2.8%
Trafalgar Group Oct 24–251,076 (LV)± 2.91%48%48%2%-1% [lower-alpha 18] 1%
Wick Surveys Oct 24–251,000 (LV)± 3.1%49%47%--
Franklin & Marshall College Oct 19–25558 (LV)± 5%44%50%2%-1% [lower-alpha 27] 3%
Univision/University of Houston/Latino
Decisions/North Star Opinion Research
Oct 17–25723 (RV)± 3.64%45%50%--3% [lower-alpha 28] 2%
Gravis Marketing Oct 23602 (LV)± 4%44%51%--5%
Public Policy Polling/American Bridge PAC [upper-alpha 4] Oct 21–22980 (V)46%51%--4%
Civiqs/Dan Hopkins Oct 17–211,577 (A)3%46%52%--2%
YouGov/University of Wisconsin-Madison Oct 13–21669 (LV)± 4.45%44%52%--3% [lower-alpha 29]
Citizen Data Oct 17–201,000 (LV)± 3.1%39%44%9%0%1%7%
CNN/SSRS [ permanent dead link ]Oct 15–20843 (LV)± 4%43%53%2%-1% [lower-alpha 30] 1%
Muhlenberg College/Morning Call Archived November 3, 2020, at the Wayback Machine Oct 13–20416 (LV)± 5.5%44%51%--2% [lower-alpha 31] 4%
Morning Consult Oct 11–202,563 (LV)± 1.9%43%52%--
Fox News Oct 18–191,045 (LV)± 3%45%50%1%-1% [lower-alpha 32] 2%
Pulse Opinion Research/Rasmussen Reports Oct 18–19800 (LV)± 3.5%47%50%--2% [lower-alpha 17] 3%
Quinnipiac University Oct 16–191,241 (LV)± 2.8%43%51%--1% [lower-alpha 18] 5%
Change Research/CNBC Oct 16–19574 (LV) [lower-alpha 33] 47%49%--
Suffolk University/USA Today Oct 15–19500 (LV)± 4.4%42%49%1%-4% [lower-alpha 34] 4%
Ipsos/Reuters Oct 13–19653 (LV)± 4.4%45% [lower-alpha 12] 49%2%0%3% [lower-alpha 35]
45% [lower-alpha 14] 49%--3% [lower-alpha 15] 4%
Trafalgar Group/Restoration PAC [upper-alpha 5] Oct 13–151,041 (LV)± 2.96%46%48%3%-2% [lower-alpha 7] 2%
HarrisX/The Hill Oct 12–151,289 (LV)46%51%--
Insider Advantage/Center for American Greatness Archived October 17, 2020, at the Wayback Machine [upper-alpha 2] Oct 12–13400 (LV)± 4.9%43%46%2%-9%
Redfield & Wilton Strategies Oct 10–131,289 (LV)43% [lower-alpha 33] 51%1%0%
Trafalgar Group Oct 10–121,034 (LV)± 2.97%45%47%3%-3% [lower-alpha 28] 2%
RMG Research/PoliticalIQ Archived October 14, 2020, at the Wayback Machine Oct 7–12800 (LV)43% [lower-alpha 12] 49%1%1%6%
42% [lower-alpha 24] 50%1%1%6%
45% [lower-alpha 25] 47%1%1%6%
Civiqs/Rust Belt Rising [upper-alpha 6] Oct 8–11600 (LV)± 4.2%45%52%--2% [lower-alpha 7] 1%
Ipsos/Reuters Oct 6–11622 (LV)± 4.5%45% [lower-alpha 12] 51%1%0%2% [lower-alpha 36]
44% [lower-alpha 14] 51%--1% [lower-alpha 37] 4%
Morning Consult Oct 2–112,610 (LV)± 1.9%44%52%--
Redfield & Wilton Strategies Oct 9–101,145 (LV)44% [lower-alpha 33] 49%1%-
Whitman Insight Strategies Oct 5–9517 (LV)± 4.3%46%51%--1% [lower-alpha 18] 3%
Baldwin Wallace University Sep 30 – Oct 81,140 (LV)± 3.1%45%50%1%0%0% [lower-alpha 38] 4%
YouGov/CCES Archived November 1, 2020, at the Wayback Machine Sep 29 – Oct 72,703 (LV)44%52%--
Redfield & Wilton Strategies Oct 4–6927 (LV)± 3.22%42%49%1%-1% [lower-alpha 39] 7%
Emerson College Oct 4–5688 (LV)± 3.7%47% [lower-alpha 3] 51%--2% [lower-alpha 7]
Quinnipiac University Oct 1–51,211 (LV)± 2.8%41%54%--1% [lower-alpha 18] 3%
Ipsos/Reuters Sep 29 – Oct 5605 (LV)± 4.5%45%50%--2% [lower-alpha 40] 3%
Change Research/CNBC Oct 2–4468 (LV)46%50%--
Monmouth University Sep 30 – Oct 4500 (RV)± 4.4%42%54%1%-0% [lower-alpha 8] 2%
500 (LV)43% [lower-alpha 9] 54%--
45% [lower-alpha 10] 53%--
YouGov/CBS Sep 30 – Oct 21,287 (LV)± 3.2%44%51%--2% [lower-alpha 41] 5%
Siena College/NYT Upshot Sep 30 – Oct 2706 (LV)± 4.1%42%49%3%-0% [lower-alpha 19] 5% [lower-alpha 20]
SurveyMonkey/Axios Sep 1–304,613 (LV)46%52%--2%
ABC News/Washington Post Sep 21–26567 (LV)± 5.0%45%54%--0% [lower-alpha 42] 1%
Siena College/NYT Upshot Sep 25–27711 (LV)± 4.3%40%49%2%-0% [lower-alpha 19] 8% [lower-alpha 20]
TIPP/The Federalist Sep 24–26774 (LV)± 3.6%45%50%--1% [lower-alpha 43] 4%
Redfield & Wilton Strategies Sep 23–251,015 (LV)± 3.08%44%50%0%1% [lower-alpha 39] 5%
Fox News Sep 20–23856 (LV)± 3%44%51%2%1% [lower-alpha 32] 2%
910 (RV)± 3%43%51%2%2% [lower-alpha 44] 3%
Baldwin Wallace University Sep 9–221,012 (LV)± 3.6%45%47%2%0%1% [lower-alpha 45] 5%
Trafalgar Group/Restoration PAC [upper-alpha 5] Sep 18–211,006 (LV)± 2.99%46%48%1%1%2% [lower-alpha 7] 2%
YouGov/UW-Madison Elections Research
Center/Wisconsin State Journal
Sep 10–21642 (LV)45%49%--
Change Research/CNBC Sep 18–20579 (LV)45%49%--
Franklin & Marshall College Sep 14–20480 (LV)± 7.8%42%48%--
Hart Research Associates/Human Rights Campaign [ permanent dead link ] [upper-alpha 7] Sep 17–19400 (LV)± 4.9%42%53%--
CPEC [upper-alpha 8] Sep 15–17830 (LV)± 2.3%45%50%--1% [lower-alpha 46] 4%
Trafalgar Group (R) Sep 15–171,006 (LV)± 2.99%45%47%2%1%2% [lower-alpha 7] 2%
Ipsos/Reuters Sep 11–16611 (LV)± 4.5%46%49%--2% [lower-alpha 40] 4%
Civiqs/Rust Belt Rising [upper-alpha 6] Sep 11–15704 (RV)± 4.4%45%52%--1% [lower-alpha 18] 2%
Redfield & Wilton Strategies Sep 12–141,036 (LV)± 3.04%44%49%1%1%0% [lower-alpha 47] 5%
Climate Nexus Sep 8–11659 (RV)± 4%43%48%--3% [lower-alpha 48] 6%
Benenson Strategy Group/GS Strategy Group/AARP Aug 28 – Sep 81,600 (LV)± 2.5%46%49%--1% [lower-alpha 49] 4%
Marist College/NBC News Aug 31 – Sep 7771 (LV)± 4.4%44%53%--1%2%
Morning Consult Aug 29 – Sep 72,227 (LV)± (2%–4%)45% [lower-alpha 50] 50%--
Change Research/CNBC Sep 4–6829 (LV)46%50%--4% [lower-alpha 51]
TargetSmart Archived October 4, 2020, at the Wayback Machine Sep 3–6835 (LV)± 3.4%44%51%--3%3%
Susquehanna Polling & Research Inc. Aug 26 – Sep 4498 (LV)± 4.3%42%44%--6% [lower-alpha 52] 7%
Redfield & Wilton Strategies Aug 30 – Sep 31,053 (LV)± 3.02%43%48%1%1%1% [lower-alpha 39] 7%
Quinnipiac Archived September 3, 2020, at the Wayback Machine Aug 28 – Sep 11,235 (LV)± 3%44%52%--1% [lower-alpha 18] 3%
ALG Research/Progressive Policy Institute [upper-alpha 9] Aug 26 – Sep 1500 (LV)44%50%--
Monmouth University Aug 28–31400 (RV)± 4.9%45%49%2%0%1% [lower-alpha 53] 4%
400 (LV)46% [lower-alpha 54] 49%--2%3%
47% [lower-alpha 55] 48%--2%3%
Hodas & Associates/Restoration PAC [upper-alpha 5] Aug 26–31600 (LV)45%51%--4%
SurveyMonkey/Axios Aug 1–313,531 (LV)45%53%--2%
Morning Consult Aug 21–302,158 (LV)± (2%–4%)45%49%--
Pulse Opinion Research/Rasmussen Reports Aug 25–271,000 (LV)± 3%48% [lower-alpha 56] 48%--4% [lower-alpha 57]
GQR Research/Unite the Country PAC [upper-alpha 10] Aug 20–24971 (LV)± 4.4%43%52%--5%
Franklin & Marshall College Aug 17–24681 (RV)± 5.2%42% [lower-alpha 3] 50%--3% [lower-alpha 58] 7%
Change Research/CNBC Aug 21–23984 (LV)46%49%--
Global Strategy Group/Climate Power 2020
/League of Conservation Voters/Sierra Club
[upper-alpha 11]
Aug 13–19801 (RV)± 3.5%42% [lower-alpha 12] 50%2%1%5%
43% [lower-alpha 59] 53%--4%
Redfield and Wilton Strategies Aug 16–171,006 (LV)± 3.1%41%48%1%1%1% [lower-alpha 39] 8%
Civiqs/Rust Belt Rising [upper-alpha 6] Aug 13–17617 (RV)44%51%--3% [lower-alpha 28] 1%
Muhlenberg College/Morning Call Aug 11–17416 (LV)± 5.5%45%49%--3% [lower-alpha 60] 3%
Morning Consult Aug 7–161,777 (LV)± (2%–4%)44%50%--
Emerson College Aug 8–10843 (LV)± 3.8%47% [lower-alpha 61] 53%--
Change Research/CNBC Aug 7–9456 (RV)44%48%--
YouGov/CBS Aug 4–71,211 (LV)± 3.7%43%49%--3% [lower-alpha 62] 5%
OnMessage Inc./Heritage Action [upper-alpha 12] Aug 2–4400 (LV)± 4.7%46%50%--4%
YouGov/University of Wisconsin-Madison Jul 27 – Aug 6742 (RV)± 4.9%41%50%--2% [lower-alpha 63] 5%
SurveyMonkey/Axios Jul 1–314,208 (LV)48%50%--2%
Change Research/CNBC Jul 24–26382 (LV)46%48%--
Franklin & Marshall College Jul 20–26667 (RV)± 5.5%41%50%--2% [lower-alpha 17] 6%
Morning Consult Jul 17–262,092 (LV)± 2.1%42%50%--
Gravis Marketing Jul 22–241,006 (RV)± 3.1%45%48%--8%
Zogby Analytics Jul 21–23809 (RV)± 3.4%43%44%4%2%-8%
Hodas & Associates/Restoration PAC [upper-alpha 5] Jul 17–22600 (LV)45%51%--5%
Redfield & Wilton Strategies Jul 19–211,016 (LV)41%48%1%0%2% [lower-alpha 64] 8%
Fox News Jul 18–20793 (RV)± 3.5%39%50%--5% [lower-alpha 65] 6%
Pulse Opinion Research/Rasmussen Reports/American Greatness PAC Archived July 31, 2020, at the Wayback Machine [upper-alpha 2] Jul 15–16750 (LV)± 4%46%51%--2% [lower-alpha 17] 1%
Spry Strategies/American Principles Project [upper-alpha 13] Jul 11–16700 (LV)± 3.7%48%47%--5%
Monmouth University Jul 9–13401 (RV)± 4.9%40%53%--3% [lower-alpha 66] 4%
401 (LV) 42% [lower-alpha 54] 52%--3%3%
44% [lower-alpha 55] 51%--2%3%
Change Research/CNBC Jul 10–12743 (LV)42%50%--
Trafalgar Group Jun 29 – Jul 21,062 (LV)± 2.92%43%48%--6% [lower-alpha 67] 3%
SurveyMonkey/Axios Jun 8–302,184 (LV)48%50%--2%
Change Research/CNBC Jun 26–28760 (LV) [lower-alpha 33] 44%50%--
Susquehanna Polling/Fox 43 Jun 15–23715 (LV)41%46%--5%8%
Redfield & Wilton Strategies Jun 14–161,125 (LV)± 2.92%39%49%1%1%1% [lower-alpha 68] 9%
Siena College/NYT Upshot Jun 8–16651 (RV)± 4.2%40%50%--3% [lower-alpha 69] 6%
Change Research/CNBC Jun 12–14491 (LV) [lower-alpha 33] 46%49%--3% [lower-alpha 70]
Hodas & Associates/Restoration PAC [upper-alpha 5] Jun 8–11600 (LV)± 4.0%42%54%--4%
Civiqs/Dan Hopkins Jun 6–111,221 (A)3.6%46%49%--5%
Civiqs/Dan Hopkins May 30 – Jun 22,045 (A)2.4%46%49%--5%
Change Research/CNBC May 29–31579 (LV) [lower-alpha 33] 50%46%--2%2%
Morning Consult May 17–262,120 (LV)44% [lower-alpha 33] 48%--
Redfield & Wilton Strategies May 10–14963 (LV)± 3.2%39%48%--2% [lower-alpha 71] 11%
Hodas & Associates/Restoration PAC [upper-alpha 5] May 9–13600 (LV)± 3.0%51%46%--4%
Harper Polling (R) Archived May 1, 2020, at the Wayback Machine Apr 21–26644 (LV)± 3.9%43%49%--8%
Public Policy Polling [upper-alpha 14] Apr 20–211,251 (RV)44%51%--5%
Fox News Apr 18–21803 (RV)± 3.5%42%50%--
Ipsos Apr 15–20578 (RV)± 5.0%40%46%--
Susquehanna Research/Fox 43 Apr 14–20693 (LV)42%48%--
Hodas & Associates/Restoration PAC [upper-alpha 5] Apr 16–18600 (RV)± 3.0%47%47%--6%
Civiqs/Dan Hopkins Apr 4–81,912 (A)2.5%47%47%--6%
Baldwin Wallace University Great Lakes Mar 17–25973 (RV)± 3.9%47%45%--9%
Change Research Mar 21–23510 (LV)50%47%--4%
Hodas & Associates/Restoration PAC [upper-alpha 5] Mar 19–21600 (RV)47%45%--
Civiqs/Dan Hopkins Mar 14–181,589 (A)2.7%48%46%--6%
YouGov/Yahoo News Mar 6–8725 (RV)40%46%--5% [lower-alpha 72] 8%
Firehouse Strategies/Øptimus Archived December 9, 2019, at the Wayback Machine Mar 5–7533 (RV)± 5.3%45%44%--
Civiqs/Dan Hopkins Feb 27 – Mar 32,462 (A)2.2%48%46%--7%
Muhlenberg College/Morning Call Feb 12–20424 (RV)± 5.5%47%47%--2%4%
YouGov Feb 11–201,171 (RV)± 4.0%45%46%--
Quinnipiac University Archived May 13, 2020, at the Wayback Machine Feb 12–18849 (RV)± 3.4%42%50%--6% [lower-alpha 73] 3%
Expedition Strategies/Progressive Policies Institute Feb 6–18500 (RV)42%47%--11%

2017–2019 polls

Poll sourceDate(s)
administered
Sample
size [lower-alpha 2]
Margin
of error
Donald
Trump

Republican
Joe
Biden

Democratic
Other Undecided
Firehouse Strategies/Øptimus Archived December 9, 2019, at the Wayback Machine Dec 3–5, 2019598 (LV)± 4.3%45%41%8% [lower-alpha 74] 6% [lower-alpha 20]
Muhlenberg College/Morning Call Archived November 14, 2019, at the Wayback Machine Nov 4–9, 2019410 (RV)± 6.0%43%52%4%2%
Siena College/NYT Upshot Oct 13–25, 2019661 (LV)± 4.4%45%46%
Firehouse Strategies/Øptimus Archived September 12, 2019, at the Wayback Machine Sep 7–9, 2019527 (LV)± 4.2%41%45%14%
Firehouse Strategies/Øptimus Jun 11–13, 2019565 (LV)± 4.2%42%43%15%
Quinnipiac University May 9–14, 2019978 (RV)± 4.2%42%53%1%3%
WPA Intelligence Apr 27–30, 2019200 (LV)± 6.9%45%46%8%
Emerson College Archived April 20, 2019, at the Wayback Machine Mar 26–28, 2019808 (RV)± 3.4%45%55%
Firehouse Strategies/Øptimus Archived April 3, 2019, at the Wayback Machine Mar 19–21, 2019632 (LV)± 4.0%43%50%4%

Former candidates and hypothetical polling

Former candidates

Donald Trump vs. Michael Bloomberg

Poll sourceDate(s)
administered
Sample
size [lower-alpha 2]
Margin
of error
Donald
Trump (R)
Michael
Bloomberg (D)
OtherUndecided
Muhlenberg College/Morning Call Feb 12–20, 2020424 (RV)± 5.5 %48%45%2%5%
Quinnipiac University Archived May 13, 2020, at the Wayback Machine Feb 12–18, 2020849 (RV)±3.4%42%48%6% [lower-alpha 75] 3%
Expedition Strategies/Progressive Policies Institute Feb 6–18, 2020500 (RV)39%48%13%
Firehouse Strategies/Øptimus Archived December 9, 2019, at the Wayback Machine Dec 3–5, 2019598 (LV)± 4.3%45%41%9% [lower-alpha 76] 5%

Donald Trump vs. Pete Buttigieg

Poll sourceDate(s)
administered
Sample
size [lower-alpha 2]
Margin
of error
Donald
Trump (R)
Pete
Buttigieg (D)
OtherUndecided
Muhlenberg College/Morning Call Feb 12–20, 2020424 (RV)± 5.5 %46%45%3%5%
Expedition Strategies/Progressive Policies Institute Feb 6–18, 2020500 (RV)40%46%14%
YouGov Feb 11–20, 20201,171 (RV)±4.0%44%44%
Quinnipiac University Archived May 13, 2020, at the Wayback Machine Feb 12–18, 2020849 (RV)±3.4%43%47%8% [lower-alpha 77] 2%
Firehouse Strategies/Øptimus Archived December 9, 2019, at the Wayback Machine Dec 3–5, 2019598 (LV)± 4.3%46%40%7% [lower-alpha 78] 7% [lower-alpha 20]
Firehouse Strategies/Øptimus Jun 11–13, 2019565 (LV)± 4.2%45%32%23%
Quinnipiac University May 9–14, 2019978 (RV)± 4.2%44%45%4%6%

Donald Trump vs. Kamala Harris

Poll sourceDate(s)
administered
Sample
size [lower-alpha 2]
Margin
of error
Donald
Trump (R)
Kamala
Harris (D)
OtherUndecided
Quinnipiac University May 9–14, 2019978 (RV)± 4.2%45%45%3%5%
Emerson College Archived April 20, 2019, at the Wayback Machine Mar 26–28, 2019808 (RV)± 3.4%49%51%

Donald Trump vs. Amy Klobuchar

Poll sourceDate(s)
administered
Sample
size [lower-alpha 2]
Margin
of error
Donald
Trump (R)
Amy
Klobuchar (D)
OtherUndecided
Muhlenberg College/Morning Call Feb 12–20, 2020424 (RV)± 5.5 %45%44%3%8%
YouGov Feb 11–20, 20201,171 (RV)±4.0%43%43%
Quinnipiac University Archived May 13, 2020, at the Wayback Machine Feb 12–18, 2020849 (RV)±3.4%42%49%6% [lower-alpha 73] 4%

Donald Trump vs. Beto O'Rourke

Poll sourceDate(s)
administered
Sample
size [lower-alpha 2]
Margin
of error
Donald
Trump (R)
Beto
O'Rourke (D)
OtherUndecided
Quinnipiac University May 9–14, 2019978 (RV)± 4.2%46%44%4%5%
Emerson College Archived April 20, 2019, at the Wayback Machine Mar 26–28, 2019808 (RV)± 3.4%49%51%
Firehouse Strategies/Øptimus Archived April 3, 2019, at the Wayback Machine Mar 19–21, 2019632 (LV)± 4.0%47%40%8%

Donald Trump vs. Bernie Sanders

Poll sourceDate(s)
administered
Sample
size [lower-alpha 2]
Margin
of error
Donald
Trump (R)
Bernie
Sanders (D)
OtherUndecided
Baldwin Wallace University Great Lakes Mar 17–25, 2020973 (RV)± 3.9%48%42%10%
Hodas & Associates/Restoration PAC [upper-alpha 5] Mar 19–21, 2020600 (RV)49%43%
YouGov/Yahoo News Mar 6–8, 2020725 (RV)41%43%6% [lower-alpha 79] 10%
Firehouse Strategies/Øptimus Archived December 9, 2019, at the Wayback Machine Mar 5–7, 2020533 (RV)± 5.3 %46%42%
Muhlenberg College/Morning Call Feb 12–20, 2020424 (RV)± 5.5 %46%49%3%3%
YouGov Feb 11–20, 20201,171 (RV)±4.0%45%47%
Quinnipiac University Archived May 13, 2020, at the Wayback Machine Feb 12–18, 2020849 (RV)±3.4%44%48%5% [lower-alpha 80] 1%
Expedition Strategies/Progressive Policies Institute Feb 6–18, 2020500 (RV)43%45%12%
Firehouse Strategies/Øptimus Archived December 9, 2019, at the Wayback Machine Dec 3–5, 2019598 (LV)± 4.3%48%37%8% [lower-alpha 81] 6% [lower-alpha 20]
Muhlenberg College/Morning Call Archived November 14, 2019, at the Wayback Machine Nov 4–9, 2019410 (RV)± 6.0%45%50%4%1%
NYT Upshot/Siena College Oct 13–25, 2019661 (LV)± 4.4%45%44%
Firehouse Strategies/Øptimus Archived September 12, 2019, at the Wayback Machine Sep 7–9, 2019527 (LV)± 4.2%42%44%14%
Firehouse Strategies/Øptimus Jun 11–13, 2019565 (LV)± 4.2%44%41%15%
Quinnipiac University May 9–14, 2019978 (RV)± 4.2%43%50%2%3%
Tulchin Research (D) [upper-alpha 15] Apr 14–18, 2019400 (LV)± 4.9%43%51%
Emerson College Archived April 20, 2019, at the Wayback Machine Mar 26–28, 2019808 (RV)± 3.4%45%55%
Firehouse Strategies/Øptimus Archived April 3, 2019, at the Wayback Machine Mar 19–21, 2019632 (LV)± 4.0%44%44%8%

Donald Trump vs. Elizabeth Warren

Poll sourceDate(s)
administered
Sample
size [lower-alpha 2]
Margin
of error
Donald
Trump (R)
Elizabeth
Warren (D)
OtherUndecided
Muhlenberg College/Morning Call Feb 12–20, 2020424 (RV)± 5.5 %47%47%4%3%
YouGov Feb 11–20, 20201,171 (RV)±4.0%45%45%
Quinnipiac University Archived May 13, 2020, at the Wayback Machine Feb 12–18, 2020849 (RV)±3.4%44%47%8% [lower-alpha 77] 2%
Firehouse Strategies/Øptimus Archived December 9, 2019, at the Wayback Machine Dec 3–5, 2019598 (LV)± 4.3%47%40%8% [lower-alpha 81] 5% [lower-alpha 20]
Muhlenberg College/Morning Call Archived November 14, 2019, at the Wayback Machine Nov 4–9, 2019410 (RV)± 6.0%45%50%4%1%
NYT Upshot/Siena College Oct 13–25, 2019661 (LV)± 4.4%46%44%
Firehouse Strategies/Øptimus Archived September 12, 2019, at the Wayback Machine Sep 7–9, 2019527 (LV)± 4.2%41%43%16%
Firehouse Strategies/Øptimus Jun 11–13, 2019565 (LV)± 4.2%45%34%21%
Quinnipiac University May 9–14, 2019978 (RV)± 4.2%44%47%3%4%
Emerson College Archived April 20, 2019, at the Wayback Machine Mar 26–28, 2019808 (RV)± 3.4%48%52%
Zogby Analytics Aug 17–23, 2017813 (LV)± 3.4%38%46%16%
Hypothetical polling

Donald Trump vs. Generic Democrat

Poll sourceDate(s)
administered
Sample
size [lower-alpha 2]
Margin
of error
Donald
Trump (R)
Generic
Democrat (D)
Undecided
Baldwin Wallace University/Oakland University/Ohio Northern University Mar 17–25, 2020997 (RV)± 3.7%48.6% [lower-alpha 82] 49.2%2.1% [lower-alpha 83]
Expedition Strategies/Progressive Policies Institute Feb 6–18, 2020500 (RV)38%51%11%
Baldwin Wallace University/Oakland University/Ohio Northern University Jan 8–20, 20201,037 (RV)± 3.2%39.7% [lower-alpha 82] 49.5%10.7%
KFF/Cook Political Report Sep 23 – Oct 15, 2019752 (RV)± 4%29%40%22%

Donald Trump vs. Generic Opponent

Poll sourceDate(s)
administered
Sample
size [lower-alpha 2]
Margin
of error
Donald
Trump (R)
Generic
Opponent
Undecided
Muhlenberg College/Morning Call Oct 23–28, 2020419 (LV)± 5.5%42%54%4%
Muhlenberg College/Morning Call Archived November 3, 2020, at the Wayback Machine Oct 13–20, 2020416 (LV)± 5.5%44%51%5%
Muhlenberg College/Morning Call Aug 11–17, 2020416 (LV)± 5.5%44%53%3%
Muhlenberg College/Morning Call Feb 12–20, 2020424 (RV)± 5.5%42%54%4%
Muhlenberg College/Morning Call Archived November 14, 2019, at the Wayback Machine Nov 4–9, 2019410 (RV)± 6.0%42%57%2%
F&M/PoliticsPA Mar 18–24, 2019540 (RV)± 5.5%36%61% [lower-alpha 84] 4%

Electoral slates

These slates of electors were nominated by each party in order to vote in the Electoral College should their candidates win the state: [32]

Donald Trump and Mike Pence
Republican Party
Joe Biden and Kamala Harris
Democratic Party
Jo Jorgensen and Spike Cohen
Libertarian Party
  • Kyle Burton
  • Henry Conoly
  • Daniel Cooper
  • Thomas Eckman
  • Greg Faust
  • Kevin Gaughen
  • Willie Harmon
  • Ken Krawchuk
  • Brandon Magoon
  • Roy Minet
  • Paul Nicotera
  • Paul Rizzo
  • Richard Schwartzman
  • William Sloane
  • Kathleen Smith
  • Jake Towne
  • Glenn Tuttle
  • Stephen Wharhaftig
  • John Waldenberger
  • Daniel Wassmer

Results

Results by metropolitan area The 2020 United States Presidential Election in Pennsylvania by Metropolitan Area.svg
Results by metropolitan area

9,098,998 [33] residents registered to vote by the voter registration deadline on October 15, which had been extended from its original date on October 13 by court order.

Results by municipality Pennsylvania Presidential Results 2020 by Municipality.svg
Results by municipality
2020 United States presidential election in Pennsylvania [34] [35]
PartyCandidateVotes%±%
Democratic 3,458,229 50.01 +2.55
Republican 3,377,67448.84+0.66
Libertarian 79,3801.15−1.23
Total votes6,915,283 100% +12.16
Democratic win

Results by county

County [36] Joe Biden
Democratic
Donald Trump
Republican
Jo Jorgensen
Libertarian
Various candidates
Other parties
MarginTotal votes cast
#%#%#%#%#%
Adams 18,25432.13%37,56766.13%8141.43%1740.31%−19,313−34.00%56,809
Allegheny 430,75959.43%282,91339.03%8,3611.15%2,7670.38%147,84620.40%724,800
Armstrong 8,45723.22%27,48975.47%4241.16%560.15%−19,032−52.25%36,426
Beaver 38,12240.38%54,75958.01%1,2411.31%2750.29%−16,637−17.63%94,397
Bedford 4,36715.82%23,02583.39%1820.66%360.13%−18,658−67.57%27,610
Berks 93,11645.08%109,92653.22%2,9241.42%5870.28%−16,810−8.14%206,553
Blair 17,63627.67%45,30671.07%6531.02%1530.24%−27,670−43.40%63,748
Bradford 8,04626.61%21,60071.45%5131.70%730.24%−13,554−44.84%30,232
Bucks 204,71251.53%187,36747.16%4,1551.05%1,0570.27%17,3454.37%397,291
Butler 37,50833.00%74,35965.42%1,4381.27%3580.31%−36,851−32.42%113,663
Cambria 21,73030.71%48,08567.96%7591.07%1770.25%−26,355−37.25%70,751
Cameron 63425.98%1,77172.58%291.19%60.25%−1,137−46.60%2,440
Carbon 11,21233.28%21,98465.26%4331.29%600.18%−10,772−31.98%33,689
Centre 40,05551.42%36,37246.70%1,0661.37%3980.51%3,6834.72%77,891
Chester 182,37257.76%128,56540.72%3,5651.13%1,2510.40%53,80717.04%315,753
Clarion 4,67823.96%14,57874.67%2371.21%310.16%−9,900−50.71%19,524
Clearfield 9,67324.49%29,20373.94%5461.38%740.19%−19,530−49.45%39,496
Clinton 5,50231.15%11,90267.39%2211.25%360.20%−6,400−36.24%17,661
Columbia 10,53233.67%20,09864.25%5411.73%1090.35%−9,566−30.58%31,280
Crawford 12,92430.69%28,56167.82%5211.24%1080.26%−15,637−37.13%42,114
Cumberland 62,24543.78%77,21254.30%2,1381.50%5920.42%−14,967−10.52%142,187
Dauphin 78,98353.40%66,40844.90%1,9771.34%5330.36%12,5758.50%147,901
Delaware 206,70962.75%118,63936.02%2,9810.90%1,0750.33%88,07026.73%329,404
Elk 4,52226.68%12,14071.64%2441.44%400.24%−7,618−44.96%16,946
Erie 68,28649.66%66,86948.63%1,9281.40%4110.30%1,4171.03%137,494
Fayette 20,46932.87%41,25166.24%4680.75%910.15%−20,782−33.37%62,279
Forest 72827.43%1,88270.91%361.36%80.30%−1,154−43.48%2,654
Franklin 22,42227.67%57,24570.65%1,1161.38%2420.30%−34,823−42.98%81,025
Fulton 1,08513.58%6,82485.41%680.85%130.26%−5,739−71.83%7,990
Greene 4,91127.75%12,57971.08%1791.01%280.16%−7,668−43.33%17,697
Huntingdon 5,44523.84%17,06174.69%2861.25%510.22%−11,616−50.85%22,843
Indiana 12,63430.60%28,08968.03%4751.15%910.22%−15,455−37.43%41,289
Jefferson 4,52919.80%17,96478.54%3371.47%420.18%−13,435−58.74%22,872
Juniata 2,25318.66%9,64979.93%1411.17%290.24%−7,396−61.27%12,072
Lackawanna 61,99153.58%52,33445.23%1,0850.94%2850.25%9,6578.35%115,695
Lancaster 115,84741.17%160,20956.94%4,1831.49%1,1360.40%−44,362−15.77%281,375
Lawrence 15,97834.59%29,59764.08%5011.08%1110.24%−13,619−29.49%46,187
Lebanon 23,93233.30%46,73165.03%9891.38%2060.29%−22,799−31.73%71,858
Lehigh 98,49853.21%84,41845.47%2,1761.17%5630.30%14,0807.58%185,655
Luzerne 64,87342.26%86,92956.63%1,5190.99%1780.12%−22,056−14.37%153,499
Lycoming 16,97128.57%41,46269.80%8211.38%1430.24%−24,491−41.23%59,397
McKean 5,09826.13%14,08372.18%2851.46%440.23%−8,985−46.05%19,510
Mercer 21,06736.25%36,14362.19%7441.28%1630.28%−15,076−25.94%58,117
Mifflin 4,60321.36%16,67077.37%2291.06%450.21%−12,067−56.01%21,547
Monroe 44,06052.43%38,72646.08%1,0431.24%2050.24%5,3346.35%84,034
Montgomery 319,51162.41%185,46036.23%5,1861.01%1,7630.35%134,05126.18%511,920
Montour 3,77138.41%5,84459.53%1561.59%460.47%−2,073−21.12%9,817
Northampton 85,08749.64%83,85448.92%2,0011.17%4570.27%1,2330.72%171,399
Northumberland 12,70329.94%28,97568.28%6571.55%1000.24%−16,272−38.34%42,435
Perry 5,95024.06%18,29373.98%4091.65%760.31%−12,343−49.92%24,728
Philadelphia 604,17581.21%132,87017.86%4,8540.65%2,0670.28%471,30563.35%743,966
Pike 13,05240.02%19,24158.99%3230.99%00.00%−6,189−18.97%32,616
Potter 1,72619.00%7,23979.68%991.09%210.23%−5,513−60.68%9,085
Schuylkill 20,72729.29%48,87169.07%1,0051.42%1520.21%−28,144−39.78%70,755
Snyder 4,91025.60%13,98372.90%2471.29%410.21%−9,073−47.30%19,181
Somerset 8,65421.30%31,46677.45%4231.04%830.20%−22,812−56.15%40,626
Sullivan 92125.60%2,61972.79%551.53%30.08%−1,698−47.19%3,598
Susquehanna 6,23628.59%15,20769.72%3091.42%610.28%−8,971−41.13%21,813
Tioga 4,95523.45%15,74274.51%3781.79%510.24%−10,787−51.06%21,126
Union 7,47537.02%12,35661.19%2841.41%770.38%−4,881−24.17%20,192
Venango 7,58528.51%18,56969.81%3741.41%730.27%−10,984−41.30%26,601
Warren 6,06629.37%14,23768.92%3471.68%70.03%−8,171−39.55%20,657
Washington 45,08837.97%72,08060.70%1,3101.10%2780.23%−26,992−22.73%118,756
Wayne 9,19132.65%18,63766.21%2610.93%580.21%−9,446−33.56%28,147
Westmoreland 72,19235.16%130,29963.46%2,3531.15%4860.24%−58,107−28.30%205,330
Wyoming 4,70431.57%9,93666.68%2181.46%420.28%−5,232−35.11%14,900
York 88,11436.85%146,73361.36%3,6241.52%6750.28%−58,619−24.51%239,146
Totals3,461,22149.87%3,379,05548.69%79,4451.14%20,7280.30%82,1661.18%6,940,449
Pennsylvania County Swing 2020.svg
Pennsylvania County Trend 2020.svg
Pennsylvania County Flips 2020.svg

Counties that flipped from Republican to Democratic

By congressional district

Biden and Trump both won half of the 18 congressional districts in Pennsylvania, [37] including each winning one held by the opposite party.

DistrictTrumpBidenRepresentative
1st 46.6%52.4% Brian Fitzpatrick
2nd 29.1%70.1% Brendan Boyle
3rd 8.1%91.3% Dwight Evans
4th 37.4%61.5% Madeleine Dean
5th 34%65.1% Mary Gay Scanlon
6th 41.9%56.9% Chrissy Houlahan
7th 47%51.8% Susan Wild
8th 51.7%47.3% Matt Cartwright
9th 64.5%34.1% Dan Meuser
10th 50.7%47.8% Scott Perry
11th 60.2%38.3% Lloyd Smucker
12th 67.3%31.2% Fred Keller
13th 71.6%27.2% John Joyce
14th 63.2%35.7% Guy Reschenthaler
15th 71.2%27.5% Glenn Thompson
16th 58.7%40% Mike Kelly
17th 48%50.7% Conor Lamb
18th 34.4%64.5% Mike Doyle

Analysis

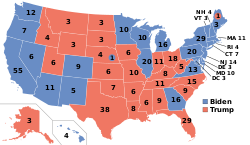
Throughout the year, Pennsylvania was regarded as the most important (or likely tipping-point) state in the entire election; Pennsylvania had 20 electoral votes, and it was one of the closest states of the 2016 presidential election. Both candidates aggressively played for the state; Trump needed the state as it represented his narrow path to re-election, while Biden needed the state to rebuild the blue wall, which Trump had broken in 2016 by carrying the northern industrial states of Michigan, Pennsylvania, and Wisconsin. [38]

Historically, Pennsylvania has usually been a competitive state. During the Second Party System from 1828 to 1852, it voted for the winner of every election. From the Civil War on, it has generally had a partisan lean; during the Third and Fourth Party Systems, Pennsylvania was a classic Yankee Republican state. When Franklin Roosevelt carried it in 1936, he became the first Democrat in eighty years to do so. Between 1936 and 1988, neither major party carried Pennsylvania for more than three straight presidential elections, although between 1952 and 1988, it voted Democratic in every close election (1960, 1968, 1976), and consistently voted more Democratic than the nation. Starting in 1992, Pennsylvania became part of the blue wall—the group of states that voted Democratic for six straight elections from 1992 through 2012. In 2016, it was one of three blue wall states that Trump won on his way to an upset victory.

State Republicans sought to require that only mail-in ballots received by Election Day be counted. The Commonwealth's Supreme Court rejected their demands, deciding that, due to probable delays due to the ongoing coronavirus and U.S. Postal Service crisis, ballots received up to three days after Election Day would also be counted. [39] Republicans then appealed the decision to the U.S. Supreme Court. Supreme Court justices produced a 4–4 tie (as the late Ruth Bader Ginsburg's seat remained vacant when the ruling was issued), with Chief Justice John Roberts siding with the three liberal justices, allowing the state supreme court decision to stand. [39]

At 1.17%, Biden's winning margin percentage in Pennsylvania was the smallest ever for a Democratic presidential candidate who won Pennsylvania. Pennsylvania remained redder than the country in 2020 even as Biden won it, by about 3.3%. As in Michigan and Wisconsin, Biden ran behind Barack Obama's performances in 2008 and 2012, though he received more votes total in the state this cycle due to record-breaking turnout.

As for Trump, he easily set the record for total number of votes for a Republican candidate in Pennsylvania history (as with Biden, largely due to record-breaking turnout). With 48.84% of the vote, he did slightly outpace both his own vote share in 2016 (48.18%) and George W. Bush's in 2004 (48.42%), the latter of which had previously stood as the highest Republican vote share in the state since 1988.

Biden's strongest base of support was the Philadelphia metro area. In the city of Philadelphia itself, Biden won by 63.4%, a weaker win than Hillary Clinton's 66.9% margin in the city in 2016, but still better than Kerry's 61.1% margin in 2004 or Gore's 62.0% margin in 2000. [40] Donald Trump improved his vote share in Philadelphia by 2.5%, [41] and, as of the counting on November 8, held a majority of the vote in the 26th, 58th, and 66th wards. However, Biden improved on Hillary Clinton dramatically in the Main Line counties of Montgomery and Chester, as well as, to a lesser extent, Delaware, increasing the Democratic vote share in these counties by 4.2%, 5.9%, and 3.5%, respectively, and winning them all by double digits. Before 1992, all three had been Republican strongholds in the state, and Chester had been considered a swing county as recently as 2012, when Romney narrowly carried it, but all three have drifted towards the Democratic column, as they tend to be socially liberal. [42]

Biden also performed strongly in Pennsylvania's other urban, suburban, and exurban areas. Crucially, he carried Allegheny County (Pittsburgh) by 20.4%, the widest margin any nominee had won the county by since 1992. [43] Centre and Dauphin both remained in the Democratic column; in the past, these counties voted Republican, though Centre County is home to Pennsylvania State University, while Dauphin County, home of Harrisburg, has followed the trend of urban areas becoming more Democratic. Biden also narrowly reclaimed two counties anchored by industrial cities which had long voted Democratic before Trump flipped them in 2016, Northampton (Bethlehem and Easton) and Erie (Erie), and improved on Hillary Clinton's margin in his birth county of Lackawanna County (Scranton), a county Hillary Clinton had barely kept in the Democratic column in 2016. In suburban Cumberland County, adjacent to Harrisburg, Biden shaved Trump's margin from 17.8% to 10.5%. [44] Northampton and Erie were the only counties to flip from one party to the other; Northampton has voted for the winner of the state in every election from 1952 on.

Trump maintained much of his momentum throughout rural and industrial Pennsylvania from four years earlier, with convincing victories in counties that were once competitive or even Democratic-leaning. He kept Luzerne County (Wilkes-Barre), which had voted Democratic six elections in a row before 2016 (and which had voted with the winner of the state from 1936 through 2016), in his column, although his margin in it was cut from 19.3% to 14.3%. Trump also won the former Democratic stronghold of Westmoreland County, although his margin in this county, crucial to his win in 2016, [45] declined. [46] Other previously competitive counties that Trump performed well in included Berks and Cambria, both of which voted for Obama in 2008. Trump further ran up the score in other conservative exurban [47] counties, most notably in Lancaster and Lebanon counties, though his margin shrank somewhat in both.

Trump won whites in the state by 15 points, although like in the rest of the country, there was a clear disparity between college-educated and non-college-educated whites. Biden won whites with a college degree by 9 points, while Trump excelled with whites without a college degree, winning this group by 32 points. Additionally, there was a gender disparity with the white vote; Trump won white men by 15 points, but only carried white women by 3 points. Finally, there was an age gap; Biden won young voters by double-digit margins, whereas Trump performed strongly with middle-aged voters; senior citizens were more even, breaking slightly for Trump. [48] Within minority blocs, Biden fared well, as he won black voters by 87 points, and won Latinos by 42 points. Three other critical voting blocs broke for Biden this cycle; he won independent voters by 8 points, moderates by 17 points, and first-time voters by 23 points. [48]

Voter demographics

Edison Research exit poll
Demographic subgroupBidenTrumpNo
Answer
 % of
Voters
Party
Democrat927N/A40
Republican891N/A41
Independent5244N/A19
Gender
Men4455147
Women5544153
Race
White 4257181
Black 927111
Latino 692745
Asian N/AN/AN/A1
OtherN/AN/AN/A1
Gender by race/ethnicity
White men3762138
White women4752143
Black men891015
Black women94426
Latino men (of any race)N/AN/A13
Latino women (of any race)831523
All other races623352
Age
18–24 years old5937313
25–29 years old673126
30–39 years old6137216
40–49 years old5246213
50–64 years old4159N/A31
65 and older4653128
Sexual orientation
LGBT 643427
Heterosexual 4752193
First time voter
First time voter 5245313
Everyone else4852N/A87
Education
High school or less3564116
Some college education4949226
Associate degree 4653117
Bachelor's degree 5445126
Advanced degree6336114
Education by race/ethnicity
White college graduates5445126
White no college degree2079135
Non-white college graduates8316114
Non-white no college degree8019125
Income
Under $30,0006037315
$30,000–49,9995345319
$50,000–99,9995346123
$100,000–199,9995148123
Over $200,000N/AN/AN/A7
Abortion should be
Legal in all cases8415125
Legal in most cases6732130
Illegal in most cases1783127
Illegal in all cases1285313
Region
Northeast4653117
Philly Suburbs8118111
Central3861122
West4356128
Source: CNN [49]

Aftermath

On November 24, 2020, the Secretary of the Commonwealth of Pennsylvania, Kathy Boockvar, certified the results, and Governor Tom Wolf, in accordance with the law, signed the certificate of ascertainment for the Biden/Harris slate of electors for Biden and Harris and sent it to the Archivist of the United States. [50] [51]

On November 25, 2020, the Pennsylvania Senate Majority (Republican) Policy committee held a public hearing regarding the counting of ballots in this election. [52] Trump planned to attend the meeting but he canceled the trip. [53] Also, on November 25th, after a group of Republican congressmen had filed a lawsuit to stop certification on Sunday November 22, Judge Patricia McCullough (R) ruled to halt further state certifications pending a hearing. The Pennsylvania Supreme Court then ruled Saturday night on November 28 to unanimously overturn Judge Patricia McCullough's ruling to halt certification because no fraud was alleged and both parties could have objected throughout the year, but did not. [54] Moreover, the Pennsylvania Supreme Court also dismissed with prejudice the requests of Representative Mike Kelly and other Republicans to either invalidate all 2.5 million mail-in ballots in Pennsylvania, or to invalidate all 6.9 million ballots in the state and have the state's Republican-controlled Legislature choose the presidential electors for the state. [55] [56] The rationale for the decision, again, was that the Republicans were challenging the law too late; they had been able to challenge the law since it became live in October 2019, but they only filed the lawsuit when the results of the November 2020 election were "becoming seemingly apparent". Hence, the Republicans had failed to act with "due diligence" in their handling of the case. [56] [57] By the time of the court's decision, the Pennsylvania election results had certified Biden's win. [58] The congressmen appealed to the US Supreme Court, but on December 8, 2020, the Supreme Court unanimously rejected the request in one sentence. [59] [60]

On December 31, 2020, Pennsylvania Congressman Dan Meuser (PA-9), Congressman Glenn ‘GT' Thompson (PA-15), Congressman Mike Kelly (PA-16), Congressman Scott Perry (PA-10), Congressman Lloyd Smucker (PA-11), Congressman Guy Reschenthaler (PA-14), Congressman John Joyce (PA-13), and Congressman Fred Keller (PA-12) released a statement that summarized their belief that the Pennsylvania state legislature had taken unlawful actions regarding the 2020 election process which, in their opinion, resulted in a "highly questionable and inaccurate vote total". [61]

Official audits and recounts

As required by state law, all counties completed a post-election sample audit. [62] With the exception of three counties, Pennsylvania's counties also participated in a voluntary risk-limiting audit pilot. [63] Both types of audits confirmed the certified results.

Lycoming County completed a hand recount and did not find any major discrepancy. [64] Butler County also completed a hand recount in two precincts and found no inaccuracies. [65]

Objection

On January 6, 2021, as Congress certified the Electoral College results confirming President-elect Joe Biden and Vice President-elect Kamala Harris as the winners, there was an objection to Pennsylvania's 20 electoral votes, brought forward by U.S. Representative Scott Perry of Pennsylvania's 10th congressional district and officially signed onto by U.S. Senator Josh Hawley of Missouri. [66] The objection failed 7–92 in the Senate, and 138–282 in the House. [67]

See also

Notes

Partisan clients
  1. Compete Everywhere primarily supports Democratic candidates
  2. 1 2 3 4 The Center for American Greatness is a pro-Trump organization
  3. Climate Power 2020 was created by the League of Conservation Voters, which endorsed Biden prior to the sampling period
  4. The American Bridge PAC exclusively supports Democratic candidates
  5. 1 2 3 4 5 6 7 8 9 The Restoration PAC is a 501 non-profit which supports Donald Trump's 2020 presidential campaign
  6. 1 2 3 Rust Belt Rising is affiliated with the Democratic Party
  7. The Human Rights Campaign endorsed Biden prior to this poll's sampling period
  8. CPEC campaigns exclusively for Democratic candidates
  9. The Progressive Policy Institute endorsed Biden prior to this poll's sampling period
  10. Unite the Country PAC endorsed Biden prior to this poll's sampling period
  11. The League of Conservation Voters and the Sierra Club endorsed Biden prior to this poll's sampling period
  12. Heritage Action is the sister organisation of the Heritage Foundation, which exclusively endorses Republican candidates
  13. This poll's sponsor is the American Principles Project, a 501(c)(4) organization that supports the Republican Party.
  14. Poll sponsored by Protect Our Care, a pro-Affordable Care Act organisation
  15. Poll sponsored by the Sanders campaign
Additional candidates
  1. Calculated by taking the difference of 100% and all other candidates combined.
  2. 1 2 3 4 5 6 7 8 9 10 11 Key:
    A – all adults
    RV – registered voters
    LV – likely voters
    V – unclear
  3. 1 2 3 4 5 With voters who lean towards a given candidate
  4. Would not vote with 0%
  5. Overlapping sample with the previous SurveyMonkey/Axios poll, but more information available regarding sample size
  6. "Some other candidate" with 1%
  7. 1 2 3 4 5 6 7 8 "Someone else" with 2%
  8. 1 2 "Other candidate" and "No one" with 0%
  9. 1 2 With a likely voter turnout model featuring high turnout
  10. 1 2 With a likely voter turnout model featuring low turnout
  11. "Other candidate or write-in" with 0%
  12. 1 2 3 4 5 6 7 Standard VI response
  13. West (B) with 2%; "Some other candidate" and would not vote with 0%
  14. 1 2 3 4 If only Biden, Trump and "some other candidate" were available
  15. 1 2 3 "Some other candidate" with 3%; would not vote with 0%
  16. Results considering those who lean towards a given candidate among those initially predisposed towards abstention, indecision or a candidate besides Biden or Trump in the response section immediately above
  17. 1 2 3 4 "Some other candidate" with 2%
  18. 1 2 3 4 5 6 7 8 "Someone else" with 1%
  19. 1 2 3 "Someone else" and would not vote with 0%
  20. 1 2 3 4 5 6 7 Includes "Refused"
  21. "Not sure/Someone else/Undecided" with 2%
  22. "None of these" and "Other" with 0%; would not vote with no voters
  23. "Neither/other" with 4%
  24. 1 2 Results generated with high Democratic turnout model
  25. 1 2 Results generated with high Republican turnout model
  26. "Some other candidate" with 1%; West (B) and would not vote with 0%
  27. "Refused" with 1%; "Some other candidate" with 0%
  28. 1 2 3 "Someone else" with 3%
  29. Includes Undecided
  30. "Other" with 1%; "None of these" with 0%
  31. "Neither/other" with 2%
  32. 1 2 "Other" with 1%; would not vote with no voters
  33. 1 2 3 4 5 6 7 Additional data sourced from FiveThirtyEight
  34. "Refused" with 3%; "Others" with 1%
  35. "Some other candidate" with 2%; West (B) with 1%; would not vote with 0%
  36. "Some other candidate" and would not vote with 1%; West (B) with 0%
  37. "Some other candidate" with 1%; would not vote with 0%
  38. "Another candidate" with 0%
  39. 1 2 3 4 "Another Third Party/Write-in" with 1%
  40. 1 2 "Some other candidate" with 2%; would not vote with 0%
  41. "Someone else/third party" with 2%
  42. "Neither" and "Other" with 0%; would not vote with no voters
  43. "Other" with 1%; "Prefer not to answer" with 0%
  44. "Other" and would not vote with 1%
  45. "Another candidate" with 1%
  46. "Third party candidate" with 1%
  47. "Another Third Party/Write-in" with 0%
  48. "Neither candidate or other candidate" with 3%
  49. Would not vote with 1%
  50. Overlapping sample with the previous Morning Consult poll, but more information available regarding sample size
  51. "Other/not sure" with 4%
  52. "Other" and "Refused" with 3%
  53. "No one" with 1%; "Other candidate" with no voters
  54. 1 2 With a likely voter turnout model featuring higher turnout than in the 2016 presidential election
  55. 1 2 With a likely voter turnout model featuring lower turnout than in the 2016 presidential election
  56. Additional data sourced from FiveThirtyEight; with voters who lean towards a given candidate
  57. "Some other candidate" with 4%
  58. "Some other candidate" with 3%
  59. If only Biden and Trump were candidates
  60. "Neither/other" with 3%
  61. Including voters who lean towards a given candidate
  62. "Someone else/third party" with 3%
  63. "Other" with 2%; would not vote with 0%
  64. West (B) and "Another Third Party/Write-In" with 1%
  65. "Other" with 4%; would not vote with 1%
  66. "Another candidate" with 3%; "No one" with 0%
  67. "Other party candidate" with 6%
  68. "other" with 1%
  69. "Another candidate" with 2%; would not vote with 1%
  70. "Libertarian Party candidate/Green Party candidate" with 3%
  71. "Third party/write-in" with 2%
  72. "Other" with 2%; would not vote with 3%
  73. 1 2 "Someone else" with 1%; would not vote with 5%
  74. A third party candidate with 6%; will not vote with 2%
  75. "Someone else" with 2%; would not vote with 4%
  76. A third party candidate with 6%; will not vote with 3%
  77. 1 2 "Someone else" with 2%; would not vote with 6%
  78. A third party candidate with 4%; will not vote with 3%
  79. "Other" with 4%; would not vote with 2%
  80. "Someone else" with 1%; would not vote with 4%
  81. 1 2 A third party candidate with 5%; will not vote with 3%
  82. 1 2 Figures for each candidate in this poll include undecided voters who were reported to lean towards that candidate at the time of polling.
  83. "It depends on who the Democrats nominate" with 1.4%; "unsure" with 0.7%
  84. 61% "time for a change" as opposed to "Trump has done a good enough job to deserve re-election"

Related Research Articles

<span class="mw-page-title-main">2020 United States presidential election in Arizona</span> Election in Arizona

The 2020 United States presidential election in Arizona was held on Tuesday, November 3, 2020, as part of the 2020 United States presidential election, in which all 50 states and the District of Columbia participated. Arizona voters chose 11 electors to represent them in the Electoral College via a popular vote pitting incumbent Republican President Donald Trump of Florida and his running mate, incumbent Vice President Mike Pence of Indiana, against Democratic challenger and former Vice President Joe Biden of Delaware and his running mate, United States Senator Kamala Harris of California. The Libertarian nominees were also on the ballot.

<span class="mw-page-title-main">2020 United States presidential election in California</span> Election in California

The 2020 United States presidential election in California was held on Tuesday, November 3, 2020, as part of the 2020 United States presidential election in which all 50 states plus the District of Columbia participated. California voters chose electors to represent them in the Electoral College via a popular vote, pitting the Republican Party's nominee, incumbent President Donald Trump, and running mate Vice President Mike Pence against Democratic Party nominee, former Vice President Joe Biden, and his running mate Kamala Harris, the junior senator from California. California had, in the 2020 election 55 electoral votes in the Electoral College, the most of any state. California was one of six states where Trump received more percentage of the two-party vote than he did in 2016. This election also marked the first time since 2004 that the Republican candidate won more than one million votes in Los Angeles County, due to increased turnout statewide.

<span class="mw-page-title-main">2020 United States presidential election in Florida</span> Election in Florida

The 2020 United States presidential election in Florida was held on Tuesday, November 3, 2020, as part of the 2020 United States presidential election, in which all 50 states and the District of Columbia participated. Florida voters chose electors to represent them in the Electoral College via a popular vote, pitting the Republican Party's nominee, incumbent president Donald Trump, and his running mate, Vice President Mike Pence, against Democratic Party nominee, former vice president Joe Biden, and his running mate, United States senator Kamala Harris, of California. Florida had 29 electoral votes in the Electoral College.

<span class="mw-page-title-main">2020 United States presidential election in Georgia</span> Election in Georgia

The 2020 United States presidential election in Georgia was held on Tuesday, November 3, 2020, as part of the 2020 United States presidential election in which all 50 states plus the District of Columbia participated. Georgia voters chose electors to represent them in the Electoral College via a popular vote, pitting the Republican Party's nominee, incumbent President Donald Trump of Florida, and running mate Vice President Mike Pence of Indiana against Democratic Party nominee, former Vice President Joe Biden of Delaware, and his running mate Senator Kamala Harris of California. Georgia has 16 electoral votes in the Electoral College.

<span class="mw-page-title-main">2020 United States presidential election in Illinois</span>

The 2020 United States presidential election in Illinois was held on Tuesday, November 3, 2020, as part of the 2020 United States presidential election in which all 50 states plus the District of Columbia participated. Illinois voters chose electors to represent them in the Electoral College via a popular vote, pitting the Republican Party's nominee, incumbent President Donald Trump of Florida, and his running mate, Vice President Mike Pence of Indiana, against Democratic Party nominee, former Vice President Joe Biden of Delaware, and his running mate, Senator Kamala Harris of California. Illinois had 20 votes in the Electoral College. Prior to the 2020 election, all news organizations predicted Illinois was a state that Biden would win, or otherwise considered a safe blue state.

<span class="mw-page-title-main">2020 United States presidential election in Iowa</span> Election in Iowa

The 2020 United States presidential election in Iowa was held on Tuesday, November 3, 2020, as part of the 2020 United States presidential election in which all 50 states plus the District of Columbia participated. Iowa voters chose electors to represent them in the Electoral College via a popular vote, pitting the Republican Party's nominee, incumbent President Donald Trump of Florida, and running mate Vice President Mike Pence of Indiana against Democratic Party nominee, former Vice President Joe Biden of Delaware, and his running mate California Senator Kamala Harris. Iowa has six electoral votes in the Electoral College.

<span class="mw-page-title-main">2020 United States presidential election in Washington (state)</span> Election in Washington

The 2020 United States presidential election in Washington was held on Tuesday, November 3, 2020, as part of the 2020 United States presidential election in which all 50 U.S. states plus the District of Columbia participated. Washington voters chose electors to represent them in the Electoral College via a popular vote, pitting the Republican Party's nominee, incumbent President Donald Trump, and running mate Vice President Mike Pence against Democratic Party nominee, former Vice President Joe Biden, and his running mate California Senator Kamala Harris. Washington has 12 electoral votes in the Electoral College.

<span class="mw-page-title-main">2020 United States presidential election in Tennessee</span> Election in Tennessee

The 2020 United States presidential election in Tennessee was held on Tuesday, November 3, 2020, as part of the 2020 United States presidential election in which all 50 states plus the District of Columbia participated. Tennessee voters chose electors to represent them in the Electoral College via a popular vote, pitting the Republican Party's nominee, incumbent President Donald Trump, and running mate Vice President Mike Pence against Democratic Party nominee, former Vice President Joe Biden, and his running mate California Senator Kamala Harris. Tennessee has 11 electoral votes in the Electoral College.

<span class="mw-page-title-main">2020 United States presidential election in Maryland</span> U.S. presidential election in Maryland

The 2020 United States presidential election in Maryland was held on Tuesday, November 3, 2020, as part of the 2020 United States presidential election in which all 50 states plus the District of Columbia participated. Maryland voters chose electors to represent them in the Electoral College via a popular vote, pitting the Republican Party's nominee, incumbent President Donald Trump, and running mate Vice President Mike Pence against Democratic Party nominee, former Vice President Joe Biden, and his running mate California Senator Kamala Harris. Maryland has 10 electoral votes in the Electoral College.

<span class="mw-page-title-main">2020 United States presidential election in Oklahoma</span> Election in Oklahoma

The 2020 United States presidential election in Oklahoma was held on Tuesday, November 3, 2020, as part of the 2020 United States presidential election in which all 50 states plus the District of Columbia participated. Oklahoma voters chose electors to represent them in the Electoral College via a popular vote, pitting the Republican Party's nominee, incumbent President Donald Trump, and running mate Vice President Mike Pence against Democratic Party nominee, former Vice President Joe Biden, and his running mate California Senator Kamala Harris. Oklahoma has seven electoral votes in the Electoral College.

<span class="mw-page-title-main">2020 United States presidential election in Virginia</span> Election in Virginia

The 2020 United States presidential election in Virginia was held on Tuesday, November 3, 2020, as part of the 2020 United States presidential election in which all 50 states plus the District of Columbia participated. Virginia voters chose electors to represent them in the Electoral College via a popular vote, pitting the Republican Party's nominee, incumbent President Donald Trump, and running mate Vice President Mike Pence against Democratic Party nominee, former Vice President Joe Biden, and his running mate California Senator Kamala Harris. Virginia has 13 electoral votes in the Electoral College.

<span class="mw-page-title-main">2020 United States presidential election in Wisconsin</span> Election in Wisconsin

The 2020 United States presidential election in Wisconsin was held on Tuesday, November 3, 2020, as part of the 2020 United States presidential election in which all 50 states plus the District of Columbia participated. Wisconsin voters chose electors to represent them in the Electoral College via a popular vote, pitting the Republican Party's nominee, incumbent President Donald Trump, and running mate Vice President Mike Pence against Democratic Party nominee, former Vice President Joe Biden, and his running mate California Senator Kamala Harris. Wisconsin has 10 electoral votes in the Electoral College.

<span class="mw-page-title-main">2020 United States presidential election in Vermont</span> Election in Vermont

The 2020 United States presidential election in Vermont was held on Tuesday, November 3, 2020, as part of the 2020 United States presidential election in which all 50 states plus the District of Columbia participated. Vermont voters chose electors to represent them in the Electoral College via a popular vote, pitting the Republican Party's nominee, incumbent President Donald Trump, and running mate Vice President Mike Pence against Democratic Party nominee, former Vice President Joe Biden, and his running mate California Senator Kamala Harris. Vermont has three electoral votes in the Electoral College.

<span class="mw-page-title-main">2020 United States presidential election in Utah</span> Election in Utah

The 2020 United States presidential election in Utah was held on Tuesday, November 3, 2020, as part of the 2020 United States presidential election in which all 50 states plus the District of Columbia participated. Utah voters chose electors to represent them in the Electoral College via a popular vote, pitting the Republican Party's nominee, incumbent President Donald Trump, and running mate Vice President Mike Pence against Democratic Party nominee, former Vice President Joe Biden, and his running mate California Senator Kamala Harris. Utah has six electoral votes in the Electoral College.

<span class="mw-page-title-main">2020 United States presidential election in Massachusetts</span> Election in Massachusetts

The 2020 United States presidential election in Massachusetts was held on Tuesday, November 3, 2020, as part of the 2020 United States presidential election in which all 50 states plus the District of Columbia participated. Massachusetts voters chose electors to represent them in the Electoral College via a popular vote, pitting the Republican Party's nominee, incumbent President Donald Trump, and running mate Vice President Mike Pence against Democratic Party nominee, former Vice President Joe Biden, and his running mate California Senator Kamala Harris. Massachusetts has 11 electoral votes in the Electoral College.

<span class="mw-page-title-main">2020 United States presidential election in Nebraska</span> Election in Nebraska

The 2020 United States presidential election in Nebraska was held on Tuesday, November 3, 2020, as part of the 2020 United States presidential election in which all 50 states plus the District of Columbia participated. Nebraska voters chose electors to represent them in the Electoral College via a popular vote, pitting the Republican Party's nominee, incumbent President Donald Trump, and running mate Vice President Mike Pence against Democratic Party nominee, former Vice President Joe Biden, and his running mate California Senator Kamala Harris. Nebraska has five electoral votes in the Electoral College, two from the state at large, and one each from the three congressional districts.

<span class="mw-page-title-main">2020 United States presidential election in Michigan</span> Election in Michigan

The 2020 United States presidential election in Michigan was held on Tuesday, November 3, 2020, as part of the 2020 United States presidential election in which all 50 states plus the District of Columbia participated. Michigan voters chose electors to represent them in the Electoral College via a popular vote, pitting the Republican Party's nominee, incumbent President Donald Trump of Florida, and his running mate, Vice President Mike Pence of Indiana against the Democratic Party nominee, former Vice President Joe Biden of Delaware, and his running mate, Senator Kamala Harris of California. Michigan had 16 electoral votes in the Electoral College.

<span class="mw-page-title-main">2020 United States presidential election in Minnesota</span> Election in Minnesota

The 2020 United States presidential election in Minnesota was held on Tuesday, November 3, 2020, as part of the 2020 United States presidential election in which all 50 states plus the District of Columbia participated. Minnesota voters chose electors to represent them in the Electoral College via a popular vote, pitting the Republican Party's nominee, incumbent President Donald Trump, and running mate Vice President Mike Pence against the Democratic Party nominee, former Vice President Joe Biden, and his running mate California Senator Kamala Harris. Minnesota has ten electoral votes in the Electoral College.

<span class="mw-page-title-main">2020 United States presidential election in Montana</span> Election in Montana

The 2020 United States presidential election in Montana was held on Tuesday, November 3, 2020, as part of the 2020 United States presidential election in which all 50 states plus the District of Columbia participated. Montana voters chose electors to represent them in the Electoral College via a popular vote, pitting the Republican Party's nominee, incumbent President Donald Trump and running mate Vice President Mike Pence, against Democratic Party nominee, former Vice President Joe Biden, and his running mate California Senator Kamala Harris. Montana had three electoral votes in the Electoral College for the 2020 election.

<span class="mw-page-title-main">2020 United States presidential election in North Carolina</span> Election in North Carolina

The 2020 United States presidential election in North Carolina was held on Tuesday, November 3, 2020, as part of the 2020 United States presidential election in which all 50 states plus the District of Columbia participated. North Carolina voters chose electors to represent them in the Electoral College via a popular vote. The state was narrowly won by the Republican Party's nominee, incumbent President Donald Trump of Florida, and running mate Vice President Mike Pence of Indiana against Democratic Party nominee, former Vice President Joe Biden of Delaware, and his running mate California Senator Kamala Harris. North Carolina had 15 electoral votes in the Electoral College.

References

  1. "Election Stats". Archived from the original on December 9, 2020. Retrieved December 11, 2020.
  2. Kelly, Ben (August 13, 2018). "US elections key dates: When are the 2018 midterms and the 2020 presidential campaign?" . The Independent . Archived from the original on August 2, 2018. Retrieved January 3, 2019.
  3. "Distribution of Electoral Votes". National Archives and Records Administration . Archived from the original on January 9, 2019. Retrieved January 3, 2019.
  4. Prokop, Andrew (November 6, 2020). "Why Decision Desk called Pennsylvania, and the presidential race, for Joe Biden". Vox . Archived from the original on November 6, 2020. Retrieved November 7, 2020.
  5. Hall, Richard (November 8, 2020). "I saw Donald Trump's presidency come crashing down at Four Seasons Total Landscaping" . The Independent . Archived from the original on November 8, 2020. Retrieved November 14, 2020. "Who was it called by?", "All of them," came the response.
  6. Stephen Collinson and Maeve Reston (November 7, 2020). "Biden wins Pennsylvania, becoming the 46th president of the United States". CNN. Archived from the original on November 7, 2020. Retrieved November 7, 2020.
  7. NBC. "Pennsylvania Presidential Election Results 2020". NBC News. Archived from the original on September 8, 2022. Retrieved September 7, 2022.
  8. 1 2 Leip, Dave. "Dave Leip's Atlas of Presidential Elections". Archived from the original on February 22, 2011. Retrieved September 7, 2022.
  9. Park, Alice; Smart, Charlie; Taylor, Rumsey; Watkins, Miles (March 30, 2021). "An Extremely Detailed Map of the 2020 Election". New York Times. Archived from the original on February 2, 2021. Retrieved September 7, 2020.
  10. Thompson, Steve; Nirappil, Fenit (February 6, 2019). "D.C. is slated to vote last in 2020 Democratic primaries. That might change". The Washington Post. Archived from the original on March 10, 2019. Retrieved June 23, 2019.
  11. "Pennsylvania just postponed its primary due to coronavirus. Here's what it means for voters and 2020 campaigns". The Philadelphia Inquirer. March 27, 2020. Archived from the original on May 14, 2020. Retrieved March 29, 2020.
  12. "Do Republicans oppose vote by mail? In Pennsylvania, it's not that simple". The Philadelphia Inquirer. April 13, 2020. Archived from the original on April 14, 2020. Retrieved April 14, 2020.
  13. "Pennsylvania Presidential Republican Primary Election Results". The New York Times. June 2, 2020. Archived from the original on June 2, 2020. Retrieved June 3, 2020.
  14. 1 2 "Pennsylvania Republican Delegation 2020". The Green Papers. Archived from the original on June 3, 2020. Retrieved June 3, 2020.
  15. "2020 Presidential Primary Official Returns". Pennsylvania Department of State. Retrieved October 14, 2020.
  16. "2020 Primary Elections: Pennsylvania results". NBC. July 17, 2020. Retrieved August 11, 2020.
  17. "Hawkins Wins PA Presidential Caucus". Green Party of Pennsylvania. May 4, 2020. Archived from the original on September 13, 2020. Retrieved September 11, 2020.
  18. "2020 POTUS Race ratings" (PDF). The Cook Political Report. Archived from the original on March 23, 2020. Retrieved May 21, 2019.
  19. "POTUS Ratings | Inside Elections". insideelections.com. Archived from the original on May 27, 2020. Retrieved May 21, 2019.
  20. "Larry J. Sabato's Crystal Ball » 2020 President". crystalball.centerforpolitics.org. Archived from the original on April 4, 2020. Retrieved May 21, 2019.
  21. "2020 Election Forecast". Politico. November 19, 2019. Archived from the original on June 14, 2020. Retrieved April 8, 2020.
  22. "Battle for White House". RCP. April 19, 2019. Archived from the original on May 3, 2020. Retrieved April 27, 2020.
  23. 2020 Bitecofer Model Electoral College Predictions Archived April 23, 2020, at the Wayback Machine , Niskanen Center, March 24, 2020, retrieved: April 19, 2020.
  24. David Chalian; Terence Burlij (June 11, 2020). "Road to 270: CNN's debut Electoral College map for 2020". CNN. Archived from the original on June 16, 2020. Retrieved June 16, 2020.
  25. "Forecasting the US elections". The Economist. Archived from the original on July 5, 2020. Retrieved July 7, 2020.
  26. "2020 Election Battleground Tracker". CBS News. July 12, 2020. Archived from the original on July 12, 2020. Retrieved July 13, 2020.
  27. "2020 Presidential Election Interactive Map". 270 to Win. Archived from the original on April 15, 2020. Retrieved April 15, 2020.
  28. "ABC News Race Ratings". ABC News. July 24, 2020. Archived from the original on July 24, 2020. Retrieved July 24, 2020.
  29. Montanaro, Domenico (August 3, 2020). "2020 Electoral Map Ratings: Trump Slides, Biden Advantage Expands Over 270 Votes". NPR.org. Archived from the original on August 4, 2020. Retrieved August 3, 2020.
  30. "Biden dominates the electoral map, but here's how the race could tighten". NBC News. August 6, 2020. Archived from the original on August 7, 2020. Retrieved August 6, 2020.
  31. "2020 Election Forecast". FiveThirtyEight. August 12, 2020. Archived from the original on September 11, 2020. Retrieved August 14, 2020.
  32. Commonwealth of Pennsylvania (November 24, 2020). "Pennsylvania Certificate of Ascertainment 2020" (PDF). National Archives and Records Administration. Archived (PDF) from the original on June 29, 2021. Retrieved July 17, 2021.
  33. "Home". Pennsylvania Department of State. Archived from the original on August 24, 2017. Retrieved March 2, 2021.
  34. Pennsylvania Department of State. "Tuesday, November 3, 2020 Official Returns – Statewide". Pennsylvania Election Returns. Archived from the original on November 22, 2021. Retrieved November 22, 2021.
  35. Federal Election Commission (January 28, 2021). "Official 2020 Presidential General Election Results" (PDF). Archived (PDF) from the original on February 10, 2021. Retrieved November 24, 2021.
  36. "2020 Presidential General Election Results - Pennsylvania".
  37. "Daily Kos Elections' presidential results by congressional district for 2020, 2016, and 2012". Daily Kos. Archived from the original on March 4, 2021. Retrieved March 4, 2021.
  38. Sprunt, Barbara (November 3, 2020). "Unlocking The Keystone State: Why Pennsylvania Is Crucial". NPR. Archived from the original on November 3, 2020. Retrieved December 19, 2020.
  39. 1 2 de Vogue, Ariane (October 19, 2020). "Supreme Court allows Pennsylvania to count mail-in ballots received after Election Day". CNN. Archived from the original on February 17, 2021. Retrieved November 21, 2020.
  40. Tamari, Jonathan; Brennan, Chris; Walsh, Sean Collins; Lai, Jonathan (November 15, 2020). "Philly was supposed to turn out huge for Biden. It didn't. What happened?". Philadelphia Inquirer . Archived from the original on December 5, 2020. Retrieved December 7, 2020.
  41. Brennan, Chris (November 8, 2020). "Philly put Biden over the top, but Trump did better in the city than four years ago". Philadelphia Inquirer . Archived from the original on November 14, 2020. Retrieved November 13, 2020.
  42. Garrison, Joey (November 13, 2020). "Donald Trump keeps baselessly claiming voter fraud in cities. But suburbs actually lost him the election". USA Today . Archived from the original on November 13, 2020. Retrieved November 13, 2020.
  43. Morrison, Oliver (November 12, 2020). "How Allegheny County delivered Pennsylvania to Biden". Public Source. Archived from the original on November 27, 2020. Retrieved December 19, 2020.
  44. Sentinel, Zack Hoopes The (November 24, 2020). "Analysis: Mapping out the 2020 vote in Cumberland County". The Sentinel. Archived from the original on December 2, 2020. Retrieved January 15, 2021.
  45. "Trump, the Republican Party, and Westmoreland County". Atavist. August 1, 2018. Archived from the original on January 21, 2021. Retrieved January 15, 2021.
  46. "Westmoreland County still went heavily for Trump — just not as much as 2016 | TribLIVE.com". triblive.com. November 7, 2020. Archived from the original on November 7, 2020. Retrieved January 15, 2021.
  47. admin (April 3, 2012). "Coming to an exurb near you". Central Penn Business Journal. Archived from the original on March 10, 2021. Retrieved January 16, 2021.
  48. 1 2 "Pennsylvania Exit Polls: How Different Groups Voted". The New York Times. November 3, 2020. Archived from the original on December 18, 2020. Retrieved December 19, 2020.
  49. "Pennsylvania 2020 President exit polls". www.cnn.com. Archived from the original on December 30, 2022. Retrieved December 14, 2020.
  50. Teresa Boeckel, Pennsylvania certifies election win for Joe Biden and Kamala Harris Archived November 26, 2020, at the Wayback Machine , York Daily Record (November 24, 2020).
  51. Lauren Egan, Pennsylvania certifies Biden win, dimming Trump hopes of overturning election result Archived January 20, 2021, at the Wayback Machine , NBC News (November 24, 2020).
  52. "The Pennsylvania Senate Majority Policy Committee is holding a public hearing to discuss 2020 election issues and irregularities, at the request of Republican Senator Doug Mastriano". YouTube . Archived from the original on November 25, 2020. Retrieved November 25, 2020.{{cite web}}: CS1 maint: bot: original URL status unknown (link)
  53. Swanson, Ian (November 25, 2020). "Trump cancels plans to attend Pennsylvania GOP event on election". TheHill. Archived from the original on November 25, 2020. Retrieved November 25, 2020.
  54. Vella, Lauren (November 28, 2020). "Pennsylvania Supreme Court strikes down GOP bid to stop election certification". The Hill . Archived from the original on November 29, 2020. Retrieved November 29, 2020.
  55. "Pa. Supreme Court Dismisses Request From Mike Kelly And Sean Parnell To Declare Mail-In Voting Unconstitutional In State, Deny Results From 2020 Election Mail-In Ballots". KDKA. Associated Press. November 28, 2020. Archived from the original on November 28, 2020. Retrieved November 28, 2020.
  56. 1 2 Viebeck, Elise (November 29, 2020). "Pennsylvania Supreme Court dismisses lawsuit against mail ballots with prejudice in another defeat for Trump". The Washington Post . Archived from the original on November 29, 2020. Retrieved November 29, 2020.
  57. Havener, Chrispin (November 29, 2020). "PA Supreme Court dismisses lawsuit seeking to make all mail-in votes unconstitutional". WJAC . Archived from the original on December 2, 2020. Retrieved November 29, 2020.
  58. "Biden certified as winner of Pennsylvania presidential vote". AP NEWS. November 24, 2020. Archived from the original on November 27, 2020. Retrieved December 11, 2020.
  59. "The Supreme Court has rejected Republicans' request to overturn Biden's Pennsylvania win". Business Insider. December 8, 2020. Archived from the original on December 8, 2020. Retrieved December 8, 2020. rejected a request to overturn
  60. Supreme Court of the United States (December 8, 2020). "20A98: KELLY, MIKE, ET AL. V. PENNSYLVANIA, ET AL" (PDF). Orders of the Court - Term Year 2020. Archived (PDF) from the original on December 9, 2020. Retrieved December 9, 2020. The application for injunctive relief presented to Justice Alito and by him referred to the Court is denied.
  61. "PENNSYLVANIA MEMBERS OF CONGRESS RELEASE STATEMENT REGARDING CERTIFICATION OF ELECTORS". Representative Dan Meuser. December 31, 2020. Archived from the original on May 25, 2022. Retrieved June 20, 2022.
  62. Woodall, Candy (June 9, 2021). "Wolf, Democrats say Pa. already had election audits — and Biden won". GoErie. Retrieved September 8, 2023.
  63. Albiges, Marie (March 10, 2021). "Pa. Audit Confirms Biden Got More Votes than Trump, but Can't Tell Us Much Else". Philadelphia Inquirer. Retrieved September 8, 2023.
  64. Walker, Carter (January 13, 2023). "No significant changes found in hand recount of 2020 presidential election in Pa.'s Lycoming County". Spotlight PA. Votebeat. Retrieved April 1, 2024.
  65. McGoldrick, Gillian (August 18, 2022). "Butler County Finishes 2020 Election Review After 170 Hours". Pittsburgh Post-Gazette. Governing. Retrieved April 1, 2024.
  66. O'Key, Sean; Wolf, Zachary B. (January 6, 2021). "Tracking the electoral vote count in Congress". CNN . Archived from the original on January 6, 2021. Retrieved January 20, 2021.
  67. "Roll Call 1". Office of the Clerk, U.S. House of Representatives . January 7, 2021. Archived from the original on January 7, 2021. Retrieved January 20, 2021.

Further reading