1940 United States presidential election in Pennsylvania

Last updated

1940 United States presidential election in Pennsylvania
Flag of Pennsylvania.svg
  1936 November 5, 1940 1944  
  FDRoosevelt1938.jpg WendellWillkie.jpg
Nominee Franklin D. Roosevelt Wendell Willkie
Party Democratic Republican
Home state New York New York
Running mate Henry A. Wallace Charles L. McNary
Electoral vote360
Popular vote2,171,0351,889,848
Percentage53.23%46.33%

Pennsylvania Presidential Election Results 1940.svg
County Results

President before election

Franklin D. Roosevelt
Democratic

Elected President

Franklin D. Roosevelt
Democratic

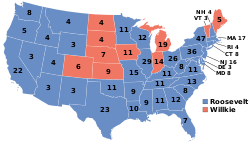
The 1940 United States presidential election in Pennsylvania took place on November 5, 1940 as part of the 1940 United States presidential election. Voters chose 36 representatives, or electors to the Electoral College, who voted for president and vice president.

Contents

Pennsylvania voted to give Democratic nominee, President Franklin D. Roosevelt an unprecedented third term, over the Republican nominee, corporate lawyer Wendell Willkie, a dark horse candidate who had never before run for a political office. Roosevelt won Pennsylvania by a margin of 6.9%. This is also one of only four occasions where Pennsylvania and Michigan voted for different presidential candidates ever since the Democrats and Republicans became the two major parties in U.S. politics. [1] [a]

Results

1940 United States presidential election in Pennsylvania [2]
PartyCandidateVotesPercentageElectoral votes
Democratic Franklin D. Roosevelt (incumbent)2,171,03553.23%36
Republican Wendell Willkie 1,889,84846.33%0
Socialist Norman Thomas 10,9670.27%0
Communist Earl Browder 4,5190.11%0
Industrial Government John Aiken1,5180.04%0
Write-ins Write-ins8270.02%0
Totals4,078,714100.00%36

Results by county

CountyFranklin Delano Roosevelt
Democratic
Wendell Lewis Willkie
Republican
Various candidates
Other parties
MarginTotal votes cast [3]
# %# %# %# %
Adams 7,35446.01%8,60953.86%200.13%-1,255-7.85%15,983
Allegheny 367,92658.03%263,28541.52%2,8490.45%104,64116.50%634,060
Armstrong 12,14445.44%14,52454.34%600.22%-2,380-8.90%26,728
Beaver 33,60957.78%24,32441.81%2390.41%9,28515.96%58,172
Bedford 7,38845.32%8,86454.38%490.30%-1,476-9.05%16,301
Berks 53,30161.31%32,11136.94%1,5221.75%21,19024.37%86,934
Blair 21,57344.65%26,63955.13%1060.22%-5,066-10.48%48,318
Bradford 6,60530.75%14,82669.02%490.23%-8,221-38.27%21,480
Bucks 20,58644.78%25,16954.75%2120.46%4,5839.97%45,967
Butler 13,87541.52%19,45058.20%960.29%-5,575-16.68%33,421
Cambria 42,89458.44%30,30641.29%1930.26%12,58817.15%73,393
Cameron 1,45044.60%1,79355.15%80.25%-343-10.55%3,251
Carbon 12,77754.50%10,61845.29%510.22%2,1599.21%23,446
Centre 9,86947.90%10,66551.77%680.33%-796-3.86%20,602
Chester 22,47344.18%28,22255.48%1740.34%-5,749-11.30%50,869
Clarion 6,56441.99%9,03557.79%340.22%-2,471-15.81%15,633
Clearfield 17,70553.23%15,40746.32%1480.44%2,2986.91%33,260
Clinton 7,41954.03%6,29145.81%220.16%1,1288.21%13,732
Columbia 12,52356.76%9,51843.14%210.10%3,00513.62%22,062
Crawford 10,19738.92%15,89160.65%1150.44%-5,694-21.73%26,203
Cumberland 15,75850.64%15,29749.16%610.20%4611.48%31,116
Dauphin 38,30547.30%42,39452.35%2760.34%-4,089-5.05%80,975
Delaware 60,22542.74%80,15856.88%5340.38%-19,933-14.15%140,917
Elk 6,92049.78%6,94949.99%310.22%-29-0.21%13,900
Erie 31,73546.19%36,60853.29%3550.52%-4,873-7.09%68,698
Fayette 41,96063.47%23,90836.16%2460.37%18,05227.30%66,114
Forest 91933.59%1,81166.19%60.22%-892-32.60%2,736
Franklin 12,71349.21%13,08450.64%390.15%-371-1.44%25,836
Fulton 1,98248.40%2,10851.48%50.12%-126-3.08%4,095
Greene 10,21460.17%6,72639.63%340.20%3,48820.55%16,974
Huntingdon 5,63137.97%9,14161.64%580.39%-3,510-23.67%14,830
Indiana 12,03543.53%15,54756.23%680.25%-3,512-12.70%27,650
Jefferson 8,55941.37%12,08158.40%470.23%-3,522-17.03%20,687
Juniata 3,57950.46%3,50749.44%70.10%721.02%7,093
Lackawanna 71,34356.32%54,93143.36%4110.32%16,41212.95%126,685
Lancaster 32,21041.62%44,93958.07%2450.32%-12,729-16.45%77,394
Lawrence 18,81449.07%19,36150.50%1670.44%-547-1.43%38,342
Lebanon 13,31549.61%13,44950.11%730.27%-134-0.50%26,837
Lehigh 33,00752.44%29,58447.00%3560.57%3,4235.44%62,947
Luzerne 101,57755.85%79,68543.81%6220.34%21,89212.04%181,884
Lycoming 18,36346.05%21,42353.72%910.23%-3,060-7.67%39,877
McKean 6,91131.63%14,82267.84%1150.53%-7,911-36.21%21,848
Mercer 16,96844.42%21,05855.12%1750.46%-4,090-10.71%38,201
Mifflin 6,99352.31%6,35247.51%240.18%6414.79%13,369
Monroe 6,67052.57%6,00147.30%160.13%6695.27%12,687
Montgomery 49,40940.15%73,25059.52%4030.33%-23,841-19.37%123,062
Montour 3,08053.04%2,72346.89%40.07%3576.15%5,807
Northampton 33,30456.49%25,38543.06%2660.45%7,91913.43%58,955
Northumberland 26,31553.31%22,91446.42%1340.27%3,4016.89%49,363
Perry 4,60143.87%5,87756.03%110.10%-1,276-12.17%10,489
Philadelphia 532,14959.69%354,87839.81%4,4590.50%177,27119.88%891,486
Pike 1,81841.08%2,59658.65%120.27%-778-17.58%4,426
Potter 2,73134.30%5,20565.36%270.34%-2,474-31.07%7,963
Schuylkill 48,73952.71%43,50547.05%2310.25%5,2345.66%92,475
Snyder 2,47830.17%5,72269.66%140.17%-3,244-39.49%8,214
Somerset 14,08544.71%17,36955.13%520.17%-3,284-10.42%31,506
Sullivan 1,62644.04%2,05955.77%70.19%-433-11.73%3,692
Susquehanna 5,38336.04%9,52063.73%350.23%-4,137-27.69%14,938
Tioga 4,43427.51%11,64572.24%400.25%-7,211-44.74%16,119
Union 2,22028.27%5,61271.45%220.28%-3,392-43.19%7,854
Venango 6,87327.89%17,72871.95%380.15%-10,855-44.06%24,639
Warren 5,82534.39%11,01665.04%970.57%-5,191-30.65%16,938
Washington 50,82963.43%29,02636.22%2850.36%21,80327.21%80,140
Wayne 3,46027.26%9,20372.50%300.24%-5,743-45.25%12,693
Westmoreland 64,56759.90%42,64339.56%5770.54%21,92420.34%107,787
Wyoming 2,54832.51%5,27367.28%160.20%-2,725-34.77%7,837
York 39,54356.56%30,22843.23%1460.21%9,31513.32%69,917
Totals2,175,53853.35%1,885,26546.23%17,0040.42%290,2737.12%4,077,807

Counties that flipped from Democratic to Republican

See also

Notes

  1. The other times were in 1856, 1932, and 1976.

References

  1. Brownstein, Ronald (September 16, 2024). "Why these three states are the most consistent tipping point in American politics". CNN. Retrieved September 16, 2024.
  2. David Leip. "1940 Presidential General Election Results – Pennsylvania". Dave Leip’s U.S. Election Atlas. Retrieved March 24, 2018.
  3. Scammon, Richard M. (compiler); America at the Polls: A Handbook of Presidential Election Statistics 1920-1964; pp. 381-382 ISBN   0405077114