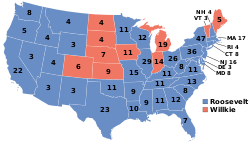
| ||||||||||||||||||||||||||
All 13 North Carolina votes to the Electoral College | ||||||||||||||||||||||||||
---|---|---|---|---|---|---|---|---|---|---|---|---|---|---|---|---|---|---|---|---|---|---|---|---|---|---|
| ||||||||||||||||||||||||||
County Results
| ||||||||||||||||||||||||||
|
Elections in North Carolina |
---|
The 1940 United States presidential election in North Carolina took place on November 5, 1940, as part of the 1940 United States presidential election. North Carolina voters chose 13 [2] representatives, or electors, to the Electoral College, who voted for president and vice president.
As a former Confederate state, North Carolina had a history of Jim Crow laws, disfranchisement of its African-American population and dominance of the Democratic Party in state politics. However, unlike the Deep South, the Republican Party had sufficient historic Unionist white support from the mountains and northwestern Piedmont to gain one-third of the statewide vote total in most general elections, [3] where turnout was higher than elsewhere in the former Confederacy due substantially to the state’s early abolition of the poll tax in 1920. [4] Like Virginia, Tennessee and Oklahoma, the relative strength of Republican opposition meant that North Carolina did not have statewide white primaries, although certain counties did use the white primary. [5] North Carolina was one of six states that swung more Democratic compared to 1936, alongside Delaware, New Hampshire, Rhode Island, Vermont, and Maine.
In 1928, anti-Catholicism in the Outer Banks and growing middle-class urban Republicanism in Piedmont cities turned North Carolina to GOP nominee Herbert Hoover, [6] but this was sharply and severely reversed in the following decade beginning with Hoover’s failed nomination of John Johnston Parker to the Supreme Court. [7] With the South having the highest unemployment in the nation and blaming its fate upon the North and Wall Street, [8] exceptionally heavy support was given to Democratic nominee Franklin D. Roosevelt in 1932 and 1936 everywhere except in a few rock-ribbed Republican mountain bastions. [6] Nevertheless, there was virtually no change to the state’s social structure during the New Deal, [9] and the conservative “Shelby Dynasty” was strong enough to prevent any populist challenge so much as developing. [10] After the 1936 Democratic landslide and Roosevelt’s failed “court-packing” plan, the state’s leading federal officeholders came to increasingly oppose Roosevelt’s policies. [9]
Although the state’s relatively numerous Republicans were highly active in support of nominees Wendell Willkie and Senate Minority Leader Charles L. McNary, early analysts said Roosevelt remained so popular with the state’s voters that there was no chance of the incumbent losing. [11] A poll in mid-October had Roosevelt carrying the state by a three-to-one margin after having given the incumbent 72 percent during the third week of September. [12]
Party | Candidate | Votes | % | |
---|---|---|---|---|
Democratic | Franklin D. Roosevelt (inc.) | 609,015 | 74.03% | |
Republican | Wendell Willkie | 213,633 | 25.97% | |
Total votes | 822,648 | 100% |
County | Franklin Delano Roosevelt Democratic | Wendell Lewis Willkie Republican | Margin | |||
---|---|---|---|---|---|---|
% | # | % | # | % | # | |
Martin | 97.76% | 4,628 | 2.24% | 106 | 95.52% | 4,522 |
Northampton | 97.33% | 3,826 | 2.67% | 105 | 94.66% | 3,721 |
Bertie | 97.10% | 3,287 | 2.90% | 98 | 94.21% | 3,189 |
Greene | 96.64% | 2,990 | 3.36% | 104 | 93.28% | 2,886 |
Pitt | 96.46% | 10,067 | 3.54% | 369 | 92.93% | 9,698 |
Hertford | 96.40% | 2,464 | 3.60% | 92 | 92.80% | 2,372 |
Edgecombe | 95.97% | 7,516 | 4.03% | 316 | 91.93% | 7,200 |
Halifax | 95.67% | 7,982 | 4.33% | 361 | 91.35% | 7,621 |
Franklin | 95.42% | 4,724 | 4.58% | 227 | 90.83% | 4,497 |
Granville | 94.85% | 3,924 | 5.15% | 213 | 89.70% | 3,711 |
Chowan | 94.68% | 1,547 | 5.32% | 87 | 89.35% | 1,460 |
Hoke | 94.21% | 1,904 | 5.79% | 117 | 88.42% | 1,787 |
Currituck | 93.76% | 1,532 | 6.24% | 102 | 87.52% | 1,430 |
Lenoir | 93.42% | 6,247 | 6.58% | 440 | 86.84% | 5,807 |
Nash | 93.24% | 8,456 | 6.76% | 613 | 86.48% | 7,843 |
Wilson | 93.13% | 7,912 | 6.87% | 584 | 86.25% | 7,328 |
Gates | 92.78% | 1,388 | 7.22% | 108 | 85.56% | 1,280 |
Anson | 92.46% | 4,552 | 7.54% | 371 | 84.93% | 4,181 |
Scotland | 92.26% | 2,981 | 7.74% | 250 | 84.52% | 2,731 |
Union | 91.89% | 7,179 | 8.11% | 634 | 83.77% | 6,545 |
Vance | 91.80% | 4,252 | 8.20% | 380 | 83.59% | 3,872 |
Warren | 91.55% | 2,676 | 8.45% | 247 | 83.10% | 2,429 |
Robeson | 90.86% | 9,251 | 9.14% | 931 | 81.71% | 8,320 |
Onslow | 89.79% | 2,383 | 10.21% | 271 | 79.58% | 2,112 |
Richmond | 89.34% | 6,530 | 10.66% | 779 | 78.68% | 5,751 |
Craven | 88.70% | 4,916 | 11.30% | 626 | 77.41% | 4,290 |
Person | 88.23% | 3,239 | 11.77% | 432 | 76.46% | 2,807 |
Pender | 88.06% | 2,249 | 11.94% | 305 | 76.12% | 1,944 |
Camden | 87.76% | 961 | 12.24% | 134 | 75.53% | 827 |
Lee | 87.48% | 3,682 | 12.52% | 527 | 74.96% | 3,155 |
Wake | 87.16% | 18,083 | 12.84% | 2,665 | 74.31% | 15,418 |
Caswell | 86.93% | 2,335 | 13.07% | 351 | 73.86% | 1,984 |
Pasquotank | 86.75% | 3,314 | 13.25% | 506 | 73.51% | 2,808 |
Columbus | 86.33% | 5,900 | 13.67% | 934 | 72.67% | 4,966 |
Durham | 85.60% | 14,810 | 14.40% | 2,491 | 71.20% | 12,319 |
Beaufort | 85.52% | 5,528 | 14.48% | 936 | 71.04% | 4,592 |
Jones | 85.47% | 1,371 | 14.53% | 233 | 70.95% | 1,138 |
Cumberland | 84.40% | 6,050 | 15.60% | 1,118 | 68.81% | 4,932 |
Bladen | 84.34% | 2,925 | 15.66% | 543 | 68.69% | 2,382 |
New Hanover | 84.03% | 8,600 | 15.97% | 1,635 | 68.05% | 6,965 |
Perquimans | 83.76% | 1,176 | 16.24% | 228 | 67.52% | 948 |
Washington | 82.65% | 1,724 | 17.35% | 362 | 65.29% | 1,362 |
Cleveland | 82.59% | 9,346 | 17.41% | 1,970 | 65.18% | 7,376 |
Rockingham | 82.51% | 11,315 | 17.49% | 2,398 | 65.03% | 8,917 |
Cabarrus | 82.03% | 11,776 | 17.97% | 2,579 | 64.07% | 9,197 |
Wayne | 81.41% | 7,222 | 18.59% | 1,649 | 62.82% | 5,573 |
Duplin | 81.06% | 5,394 | 18.94% | 1,260 | 62.13% | 4,134 |
Mecklenburg | 80.40% | 28,768 | 19.60% | 7,013 | 60.80% | 21,755 |
Gaston | 80.08% | 17,262 | 19.92% | 4,294 | 60.16% | 12,968 |
Hyde | 79.55% | 1,202 | 20.45% | 309 | 59.10% | 893 |
Dare | 79.40% | 1,214 | 20.60% | 315 | 58.80% | 899 |
Haywood | 78.55% | 8,631 | 21.45% | 2,357 | 57.10% | 6,274 |
Alamance | 77.17% | 11,429 | 22.83% | 3,382 | 54.33% | 8,047 |
Orange | 76.95% | 3,673 | 23.05% | 1,100 | 53.91% | 2,573 |
Rowan | 76.24% | 13,023 | 23.76% | 4,059 | 52.48% | 8,964 |
Forsyth | 74.36% | 20,664 | 25.64% | 7,125 | 48.72% | 13,539 |
Harnett | 74.33% | 6,602 | 25.67% | 2,280 | 48.66% | 4,322 |
Buncombe | 74.04% | 24,878 | 25.96% | 8,723 | 48.08% | 16,155 |
Tyrrell | 73.31% | 1,140 | 26.69% | 415 | 46.62% | 725 |
Guilford | 73.11% | 26,565 | 26.89% | 9,770 | 46.22% | 16,795 |
Iredell | 73.00% | 10,328 | 27.00% | 3,820 | 46.00% | 6,508 |
McDowell | 70.48% | 5,290 | 29.52% | 2,216 | 40.95% | 3,074 |
Johnston | 70.41% | 9,976 | 29.59% | 4,192 | 40.82% | 5,784 |
Chatham | 68.76% | 4,025 | 31.24% | 1,829 | 37.51% | 2,196 |
Carteret | 68.53% | 3,896 | 31.47% | 1,789 | 37.06% | 2,107 |
Surry | 67.98% | 8,871 | 32.02% | 4,178 | 35.96% | 4,693 |
Rutherford | 67.84% | 8,869 | 32.16% | 4,204 | 35.68% | 4,665 |
Caldwell | 67.82% | 6,334 | 32.18% | 3,005 | 35.65% | 3,329 |
Catawba | 66.51% | 11,233 | 33.49% | 5,656 | 33.02% | 5,577 |
Pamlico | 66.48% | 1,448 | 33.52% | 730 | 32.97% | 718 |
Jackson | 65.44% | 4,563 | 34.56% | 2,410 | 30.88% | 2,153 |
Brunswick | 64.10% | 2,717 | 35.90% | 1,522 | 28.19% | 1,195 |
Henderson | 63.06% | 6,336 | 36.94% | 3,712 | 26.11% | 2,624 |
Swain | 62.96% | 2,422 | 37.04% | 1,425 | 25.92% | 997 |
Montgomery | 62.70% | 3,007 | 37.30% | 1,789 | 25.40% | 1,218 |
Moore | 62.60% | 4,330 | 37.40% | 2,587 | 25.20% | 1,743 |
Transylvania | 62.13% | 3,312 | 37.87% | 2,019 | 24.25% | 1,293 |
Polk | 61.63% | 2,454 | 38.37% | 1,528 | 23.25% | 926 |
Alleghany | 61.60% | 1,952 | 38.40% | 1,217 | 23.19% | 735 |
Davidson | 61.37% | 11,084 | 38.63% | 6,978 | 22.73% | 4,106 |
Lincoln | 61.26% | 4,901 | 38.74% | 3,099 | 22.53% | 1,802 |
Stokes | 61.18% | 4,274 | 38.82% | 2,712 | 22.36% | 1,562 |
Burke | 59.70% | 7,242 | 40.30% | 4,889 | 19.40% | 2,353 |
Yancey | 58.10% | 3,489 | 41.90% | 2,516 | 16.20% | 973 |
Stanly | 58.04% | 6,321 | 41.96% | 4,569 | 16.09% | 1,752 |
Graham | 56.32% | 1,404 | 43.68% | 1,089 | 12.64% | 315 |
Macon | 55.99% | 2,941 | 44.01% | 2,312 | 11.97% | 629 |
Alexander | 55.27% | 2,739 | 44.73% | 2,217 | 10.53% | 522 |
Randolph | 54.51% | 8,455 | 45.49% | 7,056 | 9.02% | 1,399 |
Cherokee | 54.32% | 3,180 | 45.68% | 2,674 | 8.64% | 506 |
Clay | 53.43% | 1,349 | 46.57% | 1,176 | 6.85% | 173 |
Davie | 53.35% | 2,896 | 46.65% | 2,532 | 6.71% | 364 |
Ashe | 53.04% | 4,716 | 46.96% | 4,175 | 6.08% | 541 |
Watauga | 49.16% | 3,615 | 50.84% | 3,739 | -1.69% | -124 |
Yadkin | 47.31% | 3,660 | 52.69% | 4,077 | -5.39% | -417 |
Sampson | 46.96% | 5,107 | 53.04% | 5,769 | -6.09% | -662 |
Wilkes | 46.36% | 7,299 | 53.64% | 8,446 | -7.28% | -1,147 |
Madison | 40.72% | 3,171 | 59.28% | 4,617 | -18.57% | -1,446 |
Mitchell | 30.59% | 1,450 | 69.41% | 3,290 | -38.82% | -1,840 |
Avery | 28.85% | 1,194 | 71.15% | 2,944 | -42.29% | -1,750 |
Large portions of the interior of the United States – heavily populated by German Americans – opposed increasing "tension" with Nazi dictator Adolf Hitler and would switch support to Willkie. [14] North Carolina, however, was historically one of the least isolationist states, and its almost entirely English and Scotch-Irish descended electorate strongly favored as much aid to Britain’s World War II effort as possible. [15] Thus, North Carolina’s electorate did not merely resist the GOP shift in the heartland – in many Appalachian counties with normally substantial Republican support, FDR gained on what he had achieved in his 1932 and 1936 national landslides. [13]
North Carolina was thus won in a landslide by incumbent President Roosevelt and running mate Agriculture Secretary Henry A. Wallace, with 74.03 percent of the popular vote, against Willkie’s 25.97 percent. [16] [17]
As of the 2020 presidential election [update] , this is the last election in which Davie County and Randolph County voted for a Democratic presidential candidate. [18] This is also the best Democratic performance in the state since Andrew Jackson in 1832. [19]
The 1932 United States presidential election was the 37th quadrennial presidential election, held on Tuesday, November 8, 1932. The election took place against the backdrop of the Great Depression. The incumbent Republican President Herbert Hoover was defeated in a landslide by Democrat Franklin D. Roosevelt, the governor of New York and the vice presidential nominee of the 1920 presidential election. Roosevelt was the first Democrat in 80 years to simultaneously win an outright majority of the electoral college and popular vote, a feat last accomplished by Franklin Pierce in 1852, as well as the first Democrat in 56 years to win a majority of the popular vote, which was last achieved by Samuel J. Tilden in 1876. Roosevelt was the last sitting governor to be elected president until Bill Clinton in 1992. Hoover became the first incumbent president to lose an election to another term since William Howard Taft in 1912, the last to do so until Gerald Ford lost 44 years later, and the last elected incumbent president to do so until Jimmy Carter lost 48 years later. The election marked the effective end of the Fourth Party System, which had been dominated by Republicans. It was the first time since 1916 that a Democrat was elected president.
The 1940 United States presidential election was the 39th quadrennial presidential election. It was held on Tuesday, November 5, 1940. Incumbent Democratic President Franklin D. Roosevelt defeated Republican businessman Wendell Willkie to be reelected for an unprecedented third term in office. Until 1988, this was the last time in which the incumbent's party won three consecutive presidential elections. It was also the fourth presidential election in which both major party candidates were registered in the same home state; the others have been in 1860, 1904, 1920, 1944, and 2016.
The 1944 United States presidential election was the 40th quadrennial presidential election. It was held on Tuesday, November 7, 1944. The election took place during World War II, which ended the following year. Incumbent Democratic President Franklin D. Roosevelt defeated Republican Thomas E. Dewey to win an unprecedented fourth term. It was also the fifth presidential election in which both major party candidates were registered in the same home state; the others have been in 1860, 1904, 1920, 1940, and 2016.
The New Deal coalition was an American political coalition that supported the Democratic Party beginning in 1932. The coalition is named after President Franklin D. Roosevelt's New Deal programs, and the follow-up Democratic presidents. It was composed of voting blocs who supported them. The coalition included labor unions, blue-collar workers, big city machines, racial and religious minorities, white Southerners, and intellectuals. Besides voters the coalition included powerful interest groups: Democratic Party organizations in most states, city machines, labor unions, some third parties, universities, and foundations. It was largely opposed by the Republican Party, the business community, and rich Protestants. In creating his coalition, Roosevelt was at first eager to include liberal Republicans and some radical third parties, even if it meant downplaying the "Democratic" name. By the 1940s, the Republican and third-party allies had mostly been defeated. In 1948, the Democratic Party stood alone and survived the splits that created two splinter parties.
The 1940 United States presidential election in New York took place on November 5, 1940. All contemporary 48 states were part of the 1940 United States presidential election. Voters had chosen 47 electors to the Electoral College, which selected the president and vice president.
The 1940 United States presidential election in Massachusetts took place on November 5, 1940, as part of the 1940 United States presidential election, which was held throughout all contemporary 48 states. Voters chose 17 representatives, or electors to the Electoral College, who voted for president and vice president.
The 1940 United States presidential election in Vermont took place on November 5, 1940, as part of the 1940 United States presidential election which was held throughout all contemporary 48 states. Voters chose three representatives, or electors to the Electoral College, who voted for president and vice president.
The 1936 United States presidential election in Vermont took place on November 3, 1936, as part of the 1936 United States presidential election which was held throughout all contemporary 48 states. Voters chose three representatives, or electors to the Electoral College, who voted for president and vice president.
The 1940 United States presidential election in New Hampshire took place on November 5, 1940. All contemporary 48 states were part of the 1940 United States presidential election. State voters chose four electors to the Electoral College, which selected the president and vice president.
The 1940 United States presidential election in Maine took place on November 5, 1940. All contemporary 48 states were part of the 1940 United States presidential election. State voters chose five electors to the Electoral College, which selected the president and vice president. Maine was won by Republican businessman Wendell Willkie of New York, who was running against incumbent Democratic President Franklin D. Roosevelt of New York. Willkie ran with Senator Charles L. McNary of Oregon while Roosevelt ran with Henry A. Wallace of Iowa.
The 1940 United States presidential election in South Carolina took place on November 5, 1940. All contemporary 48 states were part of the 1940 United States presidential election. State voters chose eight electors to the Electoral College, which selected the president and vice president.
The 1940 United States presidential election in Wyoming took place on November 5, 1940, as part of the 1940 United States presidential election. State voters chose three representatives, or electors, to the Electoral College, who voted for president and vice president.
The 1944 United States presidential election in Alabama took place on November 7, 1944, as part of the 1944 United States presidential election. Alabama voters chose eleven representatives, or electors, to the Electoral College, who voted for president and vice president.
The 1940 United States presidential election in Alabama took place on November 5, 1940, as part of the 1940 United States presidential election. Alabama voters chose 11 representatives, or electors, to the Electoral College, who voted for president and vice president. In Alabama, voters voted for electors individually instead of as a slate, as in the other states.
The 1936 United States presidential election in Arkansas took place on November 3, 1936, as part of the 1936 United States presidential election. State voters chose nine representatives, or electors, to the Electoral College, who voted for president and vice president.
The 1940 United States presidential election in Arkansas took place on November 5, 1940, as part of the 1940 United States presidential election. State voters chose nine representatives, or electors, to the Electoral College, who voted for president and vice president.
The 1944 United States presidential election in North Carolina took place on November 7, 1944, as part of the 1944 United States presidential election. North Carolina voters chose 14 representatives, or electors, to the Electoral College, who voted for president and vice president.
The 1940 United States presidential election in Nebraska took place on November 5, 1940, as part of the 1940 United States presidential election. Voters chose seven representatives, or electors, to the Electoral College, who voted for president and vice president.
The 1940 United States presidential election in Tennessee took place on November 5, 1940, as part of the 1940 United States presidential election. Tennessee voters chose 11 representatives, or electors, to the Electoral College, who voted for president and vice president.
The 1936 United States presidential election in North Carolina took place on November 3, 1936, as part of the 1936 United States presidential election. North Carolina voters chose 13 representatives, or electors, to the Electoral College, who voted for president and vice president.