1940 United States presidential election in Minnesota

Last updated

1940 United States presidential election in Minnesota
Flag of Minnesota (1893-1957).svg
  1936 November 5, 1940 1944  
  FDRoosevelt1938.png WendellWillkie.jpg
Nominee Franklin D. Roosevelt Wendell Willkie
Party Democratic Republican
Home state New York New York
Running mate Henry A. Wallace Charles L. McNary
Electoral vote110
Popular vote644,196596,274
Percentage51.49%47.66%

Minnesota Presidential Election Results 1940.svg
County Results

President before election

Franklin D. Roosevelt
Democratic

Elected President

Franklin D. Roosevelt
Democratic

The 1940 United States presidential election in Minnesota took place on November 5, 1940, as part of the 1940 United States presidential election. Voters chose 11 electors, or representatives to the Electoral College, who voted for president and vice president.

Contents

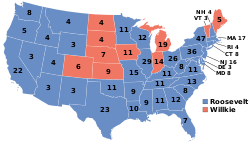
Minnesota was won by the Democratic candidate, incumbent President Franklin D. Roosevelt won the state over dark horse Republican nominee Wendell Willkie of New York by a margin of 47,922 votes, or 3.83%. Nationally, Roosevelt was re-elected to an unprecedented third term as president, with 449 electoral votes and a 9.97% lead over Willkie in the popular vote.

Results

1940 United States presidential election in Minnesota [1]
PartyCandidateVotesPercentageElectoral votes
Democratic Franklin D. Roosevelt (incumbent)644,19651.49%11
Republican Wendell Willkie 596,27447.66%0
Socialist Norman Thomas 5,4540.44%0
Communist Earl Browder 2,7110.22%0
Socialist Labor John W. Aiken 2,5530.20%0
Totals1,251,188100.00%11

Results by county

CountyFranklin Delano Roosevelt
Democratic
Wendell Lewis Willkie
Republican
Various candidates
Other parties
MarginTotal votes cast [2]
# %# %# %# %
Aitkin 3,61048.33%3,74450.12%1161.55%-134-1.79%7,470
Anoka 5,50155.66%4,30243.53%800.81%1,19912.13%9,883
Becker 6,43259.47%4,29239.68%920.85%2,14019.79%10,816
Beltrami 7,03665.68%3,51132.77%1661.55%3,52532.90%10,713
Benton 2,74243.79%3,49155.76%280.45%-749-11.96%6,261
Big Stone 2,51756.16%1,92542.95%400.89%59213.21%4,482
Blue Earth 5,88037.73%9,64261.87%620.40%-3,762-24.14%15,584
Brown 3,67832.55%7,53366.66%900.80%-3,855-34.11%11,301
Carlton 7,15967.09%3,40031.87%1111.04%3,75935.23%10,670
Carver 1,75321.11%6,52878.62%220.26%-4,775-57.51%8,303
Cass 4,39251.47%4,08947.92%520.61%3033.55%8,533
Chippewa 3,96954.07%3,30745.05%640.87%6629.02%7,340
Chisago 2,74643.06%3,56955.97%620.97%-823-12.91%6,377
Clay 6,29558.32%4,45041.23%480.44%1,84517.09%10,793
Clearwater 3,28970.31%1,35428.94%350.75%1,93541.36%4,678
Cook 68650.22%67349.27%70.51%130.95%1,366
Cottonwood 2,99141.23%4,22858.28%360.50%-1,237-17.05%7,255
Crow Wing 6,87654.79%5,52444.02%1501.20%1,35210.77%12,550
Dakota 9,32752.57%8,33947.00%770.43%9885.57%17,743
Dodge 2,35741.90%3,25757.90%110.20%-900-16.00%5,625
Douglas 4,50748.95%4,65250.53%480.52%-145-1.57%9,207
Faribault 4,09937.36%6,81662.13%560.51%-2,717-24.77%10,971
Fillmore 3,82632.69%7,83966.98%390.33%-4,013-34.29%11,704
Freeborn 6,94250.75%6,68348.85%550.40%2591.89%13,680
Goodhue 6,47541.36%9,09558.09%860.55%-2,620-16.73%15,656
Grant 2,29148.09%2,44351.28%300.63%-152-3.19%4,764
Hennepin 145,16853.69%122,96045.48%2,2300.82%22,2088.21%270,358
Houston 2,08229.98%4,82569.48%370.53%-2,743-39.50%6,944
Hubbard 2,14145.45%2,54454.00%260.55%-403-8.55%4,711
Isanti 2,65449.51%2,61748.82%901.68%370.69%5,361
Itasca 9,89964.89%5,19634.06%1591.04%4,70330.83%15,254
Jackson 4,06554.33%3,38745.27%300.40%6789.06%7,482
Kanabec 2,18548.07%2,31150.85%491.08%-126-2.77%4,545
Kandiyohi 7,18762.28%4,26336.94%900.78%2,92425.34%11,540
Kittson 3,16770.69%1,27928.55%340.76%1,88842.14%4,480
Koochiching 5,21970.98%2,09528.49%390.53%3,12442.49%7,353
Lac qui Parle 3,10644.86%3,78954.73%280.40%-683-9.87%6,923
Lake 2,75073.67%93324.99%501.34%1,81748.67%3,733
Lake of the Woods 1,63864.79%85033.62%401.58%78831.17%2,528
Le Sueur 3,75040.27%5,54359.52%200.21%-1,793-19.25%9,313
Lincoln 2,53652.95%2,22046.36%330.69%3166.60%4,789
Lyon 5,23454.66%4,30544.96%360.38%9299.70%9,575
McLeod 2,88430.62%6,47468.73%620.66%-3,590-38.11%9,420
Mahnomen 1,95964.40%1,06935.14%140.46%89029.26%3,042
Marshall 4,54964.67%2,44134.70%440.63%2,10829.97%7,034
Martin 4,29040.02%6,40959.79%210.20%-2,119-19.77%10,720
Meeker 3,61541.62%5,02657.86%450.52%-1,411-16.24%8,686
Mille Lacs 3,61950.61%3,45948.37%731.02%1602.24%7,151
Morrison 5,14447.04%5,73452.43%580.53%-590-5.40%10,936
Mower 7,98852.49%7,16947.11%600.39%8195.38%15,217
Murray 3,20351.00%3,04448.46%340.54%1592.53%6,281
Nicollet 2,83237.57%4,67462.01%310.41%-1,842-24.44%7,537
Nobles 3,91943.26%5,10456.34%360.40%-1,185-13.08%9,059
Norman 3,71662.81%2,16136.53%390.66%1,55526.28%5,916
Olmsted 8,39347.82%9,09651.83%620.35%-703-4.01%17,551
Otter Tail 7,70535.62%13,73763.51%1870.86%-6,032-27.89%21,629
Pennington 3,88666.53%1,85731.79%981.68%2,02934.74%5,841
Pine 5,26355.25%4,10643.10%1571.65%1,15712.15%9,526
Pipestone 2,39040.91%3,42358.59%290.50%-1,033-17.68%5,842
Polk 10,65266.64%5,20032.53%1330.83%5,45234.11%15,985
Pope 3,26653.63%2,80546.06%190.31%4617.57%6,090
Ramsey 78,99057.17%57,09341.32%2,0821.51%21,89715.85%138,165
Red Lake 2,02369.40%87630.05%160.55%1,14739.35%2,915
Redwood 3,63737.18%6,10562.41%400.41%-2,468-25.23%9,782
Renville 4,58842.32%6,19657.15%580.53%-1,608-14.83%10,842
Rice 4,68736.40%8,14363.25%450.35%-3,456-26.84%12,875
Rock 1,98340.05%2,94459.46%240.48%-961-19.41%4,951
Roseau 4,28970.05%1,73028.25%1041.70%2,55941.79%6,123
Saint Louis 68,62066.87%32,24331.42%1,7601.72%36,37735.45%102,623
Scott 2,91040.57%4,24159.13%210.29%-1,331-18.56%7,172
Sherburne 1,57038.86%2,45060.64%200.50%-880-21.78%4,040
Sibley 1,98626.17%5,56473.32%390.51%-3,578-47.15%7,589
Stearns 9,30536.58%16,02763.01%1020.40%-6,722-26.43%25,434
Steele 3,66839.87%5,51759.97%140.15%-1,849-20.10%9,199
Stevens 2,01843.38%2,61956.30%150.32%-601-12.92%4,652
Swift 3,89957.61%2,81541.59%540.80%1,08416.02%6,768
Todd 4,55341.71%6,30257.73%610.56%-1,749-16.02%10,916
Traverse 2,09459.14%1,43440.50%130.37%66018.64%3,541
Wabasha 2,65531.90%5,65667.95%130.16%-3,001-36.05%8,324
Wadena 2,40545.04%2,89854.27%370.69%-493-9.23%5,340
Waseca 2,67337.06%4,51562.60%250.35%-1,842-25.54%7,213
Washington 6,28848.18%6,71051.41%540.41%-422-3.23%13,052
Watonwan 2,78344.25%3,47855.30%280.45%-695-11.05%6,289
Wilkin 2,17651.20%2,06748.64%70.16%1092.56%4,250
Winona 7,18742.55%9,59956.83%1050.62%-2,412-14.28%16,891
Wright 3,99332.26%8,29767.04%870.70%-4,304-34.77%12,377
Yellow Medicine 3,78648.61%3,96450.89%390.50%-178-2.29%7,789
Totals644,19651.49%596,27447.66%10,7190.86%47,9223.83%1,251,189

Counties that flipped from Democratic to Republican

See also

References

  1. "1940 Presidential General Election Results – Minnesota". Dave Leip's U.S. Election Atlas. Retrieved October 5, 2016.
  2. Scammon, Richard M. (compiler); America at the Polls: A Handbook of Presidential Election Statistics 1920-1964; pp. 234-235 ISBN   0405077114