1936 United States presidential election in Minnesota

Last updated

1936 United States presidential election in Minnesota
Flag of Minnesota (1893-1957).svg
  1932 November 3, 1936 1940  
  FDR in 1933 (cropped).jpg LandonPortr (cropped).jpg Rep. William Lemke for Fraiser. A new informal pix of Rep. William Lemke LCCN2016875538 (cropped close 3x4).jpg
Nominee Franklin D. Roosevelt Alf Landon William Lemke
Party Democratic Republican Union
Home state New York Kansas North Dakota
Running mate John Nance Garner Frank Knox Thomas C. O'Brien
Electoral vote1100
Popular vote698,811350,46174,296
Percentage61.84%31.01%6.58%

Minnesota Presidential Election Results 1936.svg
County Results

President before election

Franklin D. Roosevelt
Democratic

Elected President

Franklin D. Roosevelt
Democratic

The 1936 United States presidential election in Minnesota took place on November 3, 1936, as part of the 1936 United States presidential election. Voters chose 11 electors, or representatives to the Electoral College, who voted for president and vice president.

Contents

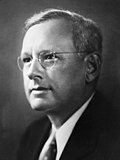
Minnesota was won by the Democratic candidate, incumbent President Franklin D. Roosevelt won the state over Kansas governor Alf Landon by a margin of 348,350 votes, or 30.83%—nearly doubling Landon's overall share of the state's vote. Nationally, Roosevelt was soundly re-elected, with 523 electoral votes and a landslide 24.26% lead over Landon in the popular vote. Landon carried only two states: Maine and Vermont, whilst in Minnesota Landon won just three counties: Otter Tail County in the rural west, Carver County outside the Twin Cities, and Fillmore County in the southeast of the state; of these, only Fillmore has ever voted Democratic in a presidential election since. [1]

Only five presidential nominees have ever won a greater percentage of the vote in Minnesota than Roosevelt did in 1936: Theodore Roosevelt in 1904 (74%), Warren G. Harding in 1920 (70.6%), Lyndon B. Johnson in 1964 (63.8%), Abraham Lincoln in 1860 (63.5%), and James A. Garfield in 1880 (62.3%)—every one of them going on to win the election nationally. As of the 2024 election, this is the last election in which either major party candidate exceeded 80% of the vote in any Minnesota county, with Roosevelt doing so in Lake County (ironically, the only county in the state that Roosevelt did not win in 1932, due to a strong showing by Socialist Norman Thomas).

Roosevelt's 30.8% margin of victory over Landon remains the widest margin by which any Democrat has ever carried Minnesota in a presidential election.

Results

1936 United States presidential election in Minnesota [2]
PartyCandidateVotesPercentageElectoral votes
Democratic Franklin D. Roosevelt (incumbent)698,81161.84%11
Republican Alf Landon 350,46131.01%0
Union William Lemke 74,2966.58%0
Socialist Norman Thomas 2,8720.25%0
Communist Earl Browder 2,5740.23%0
Socialist Labor John W. Aiken 9610.09%0
Totals1,129,975100.00%11

Results by county

CountyFranklin Delano Roosevelt
Democratic
Alfred Mossman Landon
Republican
William Frederick Lemke [3]
Union
Various candidates
Other parties
MarginTotal votes cast [4]
# %# %# %# %# %
Aitkin 3,80657.57%2,46637.30%2293.46%1101.66%1,34020.27%6,611
Anoka 4,50156.91%2,58632.70%7889.96%340.43%1,91524.21%7,909
Becker 6,47368.38%2,68328.34%2492.63%610.64%3,79040.04%9,466
Beltrami 6,50772.65%2,18224.36%1571.75%1111.24%4,32548.29%8,957
Benton 3,11153.52%1,78330.67%90515.57%140.24%1,32822.85%5,813
Big Stone 2,64866.22%1,11627.91%2215.53%140.35%1,53238.31%3,999
Blue Earth 8,25555.89%5,55037.58%9216.24%430.29%2,70518.32%14,769
Brown 6,63764.64%2,67926.09%8998.76%520.51%3,95838.55%10,267
Carlton 7,13675.29%2,16322.82%810.85%981.03%4,97352.47%9,478
Carver 2,81438.59%3,09542.44%1,36618.73%170.23%-281-3.85%7,292
Cass 4,44060.54%2,63435.91%2293.12%310.42%1,80624.63%7,334
Chippewa 4,02761.40%2,22333.89%2684.09%410.63%1,80427.50%6,559
Chisago 3,36055.26%2,46240.49%2293.77%290.48%89814.77%6,080
Clay 6,28265.29%2,88029.93%4164.32%430.45%3,40235.36%9,621
Clearwater 3,20875.34%93922.05%922.16%190.45%2,26953.29%4,258
Cook 79365.86%38732.14%181.50%60.50%40633.72%1,204
Cottonwood 3,92959.32%2,50937.88%1712.58%140.21%1,42021.44%6,623
Crow Wing 6,56161.47%3,61133.83%4314.04%700.66%2,95027.64%10,673
Dakota 8,89057.73%4,04326.26%2,40715.63%580.38%4,84731.48%15,398
Dodge 2,81254.73%2,13841.61%1763.43%120.23%67413.12%5,138
Douglas 4,18656.84%2,68136.41%4746.44%230.31%1,50520.44%7,364
Faribault 5,60356.90%3,77338.32%4514.58%200.20%1,83018.58%9,847
Fillmore 4,76445.79%5,05448.58%5595.37%270.26%-290-2.79%10,404
Freeborn 7,37859.96%4,65337.81%2451.99%290.24%2,72522.15%12,305
Goodhue 8,25757.50%5,68239.57%3642.53%580.40%2,57517.93%14,361
Grant 2,35857.87%1,56638.43%1212.97%300.74%79219.44%4,075
Hennepin 144,28958.78%81,20633.08%18,4687.52%1,5170.62%63,08325.70%245,480
Houston 3,15651.74%2,70144.28%2213.62%220.36%4557.46%6,100
Hubbard 2,31256.92%1,61839.83%1062.61%260.64%69417.09%4,062
Isanti 3,44267.19%1,43728.05%2013.92%430.84%2,00539.14%5,123
Itasca 8,89669.41%3,59228.03%1901.48%1391.08%5,30441.38%12,817
Jackson 5,18772.09%1,67623.29%3114.32%210.29%3,51148.80%7,195
Kanabec 2,57963.09%1,35033.02%1333.25%260.64%1,22930.06%4,088
Kandiyohi 6,59569.25%2,50026.25%3523.70%770.81%4,09543.00%9,524
Kittson 3,12773.25%1,08025.30%310.73%310.73%2,04747.95%4,269
Koochiching 5,06577.77%1,31620.21%841.29%480.74%3,74957.56%6,513
Lac qui Parle 3,24354.09%2,06634.46%67911.32%80.13%1,17719.63%5,996
Lake 2,71780.15%61718.20%300.88%260.77%2,10061.95%3,390
Lake of the Woods 1,56676.32%38518.76%733.56%281.36%1,18157.55%2,052
Le Sueur 5,07757.27%2,84932.14%92010.38%190.21%2,22825.13%8,865
Lincoln 2,66261.42%1,19927.66%44810.34%250.58%1,46333.76%4,334
Lyon 5,16361.29%2,55130.28%6958.25%150.18%2,61231.01%8,424
McLeod 4,44955.21%2,94136.50%6357.88%330.41%1,50818.71%8,058
Mahnomen 2,02576.88%47418.00%1204.56%150.57%1,55158.88%2,634
Marshall 4,80270.08%1,90427.79%1161.69%300.44%2,89842.29%6,852
Martin 6,49266.08%3,09031.45%2152.19%280.28%3,40234.63%9,825
Meeker 4,24256.25%2,47932.87%79710.57%240.32%1,76323.38%7,542
Mille Lacs 3,76760.56%2,09133.62%3335.35%290.47%1,67626.95%6,220
Morrison 6,11262.06%2,68227.23%1,02210.38%320.32%3,43034.83%9,848
Mower 8,22861.01%4,74335.17%4673.46%490.36%3,48525.84%13,487
Murray 3,92667.05%1,60127.34%3165.40%120.20%2,32539.71%5,855
Nicollet 4,13659.06%2,36033.70%4886.97%190.27%1,77625.36%7,003
Nobles 4,91960.94%2,60132.22%5316.58%210.26%2,31828.72%8,072
Norman 3,77868.67%1,57028.54%891.62%651.18%2,20840.13%5,502
Olmsted 8,95860.04%5,31635.63%5833.91%620.42%3,64224.41%14,919
Otter Tail 8,64247.72%8,89949.14%4382.42%1310.72%-257-1.42%18,110
Pennington 3,73672.47%1,25824.40%1001.94%611.18%2,47848.07%5,155
Pine 5,79767.11%2,45228.39%3093.58%800.93%3,34538.72%8,638
Pipestone 3,02658.53%1,88136.38%2504.84%130.25%1,14522.15%5,170
Polk 11,33773.44%3,75124.30%2451.59%1040.67%7,58649.14%15,437
Pope 3,20061.05%1,86935.65%1593.03%140.27%1,33125.39%5,242
Ramsey 86,28666.00%30,55323.37%13,20010.10%6890.53%55,73342.63%130,728
Red Lake 2,05777.53%48718.36%893.35%200.75%1,57059.18%2,653
Redwood 4,96555.34%3,28636.63%6917.70%300.33%1,67918.71%8,972
Renville 5,34456.53%3,04932.25%1,02110.80%390.41%2,29524.28%9,453
Rice 5,92848.09%4,88839.65%1,47311.95%380.31%1,0408.44%12,327
Rock 2,91060.15%1,75236.21%1633.37%130.27%1,15823.94%4,838
Roseau 3,76171.42%1,32625.18%1242.35%551.04%2,43546.24%5,266
Saint Louis 69,36574.18%22,33223.88%7090.76%1,1041.18%47,03350.30%93,510
Scott 3,86158.87%1,52823.30%1,15317.58%170.26%2,33335.57%6,559
Sherburne 1,88150.33%1,62343.43%2235.97%100.27%2586.90%3,737
Sibley 4,14061.47%2,18432.43%3885.76%230.34%1,95629.04%6,735
Stearns 12,76056.51%5,26223.30%4,48519.86%730.32%7,49833.21%22,580
Steele 4,48154.49%3,37341.01%3624.40%80.10%1,10813.47%8,224
Stevens 2,35259.42%1,43136.15%1674.22%80.20%92123.27%3,958
Swift 3,74962.63%1,61827.03%61010.19%90.15%2,13135.60%5,986
Todd 5,62756.26%3,78037.79%5755.75%200.20%1,84718.47%10,002
Traverse 2,29773.06%76124.20%822.61%40.13%1,53648.85%3,144
Wabasha 4,12253.55%2,66334.60%89311.60%190.25%1,45918.96%7,697
Wadena 2,60556.03%1,89840.83%1172.52%290.62%70715.21%4,649
Waseca 3,52055.45%2,48239.10%3305.20%160.25%1,03816.35%6,348
Washington 6,76857.80%3,86332.99%1,0308.80%490.42%2,90524.81%11,710
Watonwan 3,66863.55%1,93033.44%1602.77%140.24%1,73830.11%5,772
Wilkin 2,42861.66%1,27832.45%2205.59%120.30%1,15029.20%3,938
Winona 9,26859.60%5,35334.42%8505.47%800.51%3,91525.18%15,551
Wright 5,36347.25%4,08736.01%1,84216.23%590.52%1,27611.24%11,351
Yellow Medicine 3,92158.71%2,02930.38%71710.74%120.18%1,89228.33%6,679
Totals698,81161.84%350,45931.01%74,2966.58%6,4070.57%348,35230.83%1,129,973

Counties that flipped from Democratic to Republican

Counties that flipped from Republican to Democratic

See also

References

  1. Sullivan, Robert David; ‘How the Red and Blue Map Evolved Over the Past Century’; America Magazine in The National Catholic Review; June 29, 2016
  2. "1936 Presidential Election Results, 1936". Dave Leip's U.S. Election Atlas. Retrieved October 5, 2016.
  3. Géoelections; 1936 Presidential Election Popular Vote (.xlsx file for €15 on request)
  4. Scammon, Richard M. (compiler); America at the Polls: A Handbook of Presidential Election Statistics 1920-1964; pp. 234-235 ISBN   0405077114