The Wisconsin Territory was established by the federal government effective July 3, 1836, and existed until its eastern portion was granted statehood (as Wisconsin) in 1848. Therefore, the federal government set up the Minnesota Territory effective March 3, 1849. The newly organized territorial legislature created nine counties across the territory in October of that year. One of those original counties, Wabasha, had portions partitioned off in 1853 to create Fillmore and Rice counties. Then on February 20, 1855,[4] portions of Rice, Wabasha, and Fillmore counties were partitioned off to create the present county, with Rochester (which was also platted that year) as county seat. The county name recognized David Olmsted (1822–1861),[5] a member of the first territorial council and the fourth mayor of St. Paul.[6][7]
The county boundaries have remained unchanged since 1855.
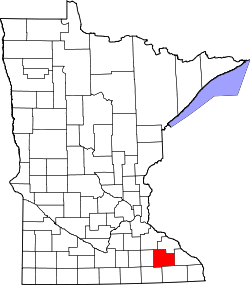
Geography
Olmsted County is a fairly unusual mix of urban and rural areas in that there's no transition or buffer between the two environments. Rochester, Minnesota's third-largest city with roughly 123,000 people, sits in the Zumbro River valley at the center of the county. Outside the valley, with the exception of a small amount of urban growth in the last few years, is farmland with small agricultural communities and no directly adjacent suburbs. Stewartville, the county's second-largest city, has about 6,000 people.
Olmsted County is drained by three rivers, all flowing to the Mississippi. The Zumbro flows northward through the west central part of the county, into Wabasha County. The Whitewater flows northeast from the northeast part of the county into Winona County, and the Root flows east-southeastward through the lower part of the county into Fillmore County. The county terrain consists of low rolling hills, etched by drainage gullies and marked by occasional buttes. The available area is devoted to agriculture or developed for other uses.[8] The terrain slopes to the east and north,[9] and its highest point is a hill 7.5 miles (12.1km) west of Stewartville, at 1,380ft (420m) ASL.[10]
According to the United States Census Bureau, the county has a total area of 654.754 square miles (1,695.81km2), of which 653.509 square miles (1,692.58km2) is land and 1.245 square miles (3.22km2) (0.19%) is water.[11] It is the 46th largest county in Minnesota by total area.[12]
Soils of Olmsted County
It is one of four Minnesota counties that have no natural lakes (the other three are Mower, Pipestone, and Rock).
U.S. Decennial Census[15] 1790–1960[16] 1900–1990[17] 1990–2000[18] 2010–2020[2]
As of the second quarter of 2025, the median home value in Olmsted County was $380,616.[19]
According to realtor website Zillow, the average price of a home as of November 30, 2025, in Olmsted County is $337,521.[20]
As of the 2024 American Community Survey, there are 67,723 estimated households in Olmsted County with an average of 2.41 persons per household. The county has a median household income of $92,942. Approximately 5.9% of the county's population lives at or below the poverty line. Olmsted County has an estimated 69.6% employment rate, with 51.6% of the population holding a bachelor's degree or higher and 95.7% holding a high school diploma.[2] There were 73,143 housing units at an average density of 111.92 per square mile (43.2/km2).
The top five reported languages (people were allowed to report up to two languages, thus the figures will generally add to more than 100%) were English (88.5%), Spanish (3.1%), Indo-European (2.6%), Asian and Pacific Islander (3.5%), and Other (2.3%).
Racial and ethnic composition
Olmsted County, Minnesota – racial and ethnic composition Note: the US Census treats Hispanic/Latino as an ethnic category. This table excludes Latinos from the racial categories and assigns them to a separate category. Hispanics/Latinos may be of any race.
As of the 2024 estimate, there were 166,424 people and 67,723 households residing in the county. The population density was 254.66 inhabitants per square mile (98.3/km2). There were 73,143 housing units at an average density of 111.92 per square mile (43.2/km2). The racial makeup of the county was 80.8% White (75.4% NH White), 8.6% African American, 0.5% Native American, 7.1% Asian, 0.1% Pacific Islander, _% from some other races and 2.9% from two or more races. Hispanic or Latino people of any race were 6.3% of the population.[26]
2020 census
As of the 2020 census, the county had a population of 162,847. The median age was 37.1 years. 23.7% of residents were under the age of 18 and 15.9% of residents were 65 years of age or older. For every 100 females there were 95.5 males, and for every 100 females age 18 and over there were 92.7 males age 18 and over.[27][28]
82.6% of residents lived in urban areas, while 17.4% lived in rural areas.[29]
There were 65,242 households in the county, of which 29.9% had children under the age of 18 living in them. Of all households, 50.0% were married-couple households, 16.9% were households with a male householder and no spouse or partner present, and 26.2% were households with a female householder and no spouse or partner present. About 29.2% of all households were made up of individuals and 10.0% had someone living alone who was 65 years of age or older.[27]
There were 69,270 housing units, of which 5.8% were vacant. Among occupied housing units, 70.0% were owner-occupied and 30.0% were renter-occupied. The homeowner vacancy rate was 1.0% and the rental vacancy rate was 9.0%.[27]
2010 census
As of the 2010 census, there were 144,248 people, 57,084 households, and _ families residing in the county. The population density was 220.78 inhabitants per square mile (85.2/km2). There were 60,501 housing units at an average density of 92.60 per square mile (35.8/km2). The racial makeup of the county was 85.70% White, 4.76% African American, 0.24% Native American, 5.41% Asian, 0.05% Pacific Islander, 1.64% from some other races and 2.21% from two or more races. Hispanic or Latino people of any race were 4.22% of the population.
2000 census
As of the 2000 census, there were 124,277 people, 47,807 households, and 32,317 families residing in the county. The population density was 190.0 inhabitants per square mile (73.4/km2). There were 49,422 housing units at an average density of 75.7 per square mile (29.2/km2). The racial makeup of the county was 90.33% White, 2.68% African American, 0.26% Native American, 4.27% Asian, 0.03% Pacific Islander, 0.92% from some other races and 1.51% from two or more races. Hispanic or Latino people of any race were 2.38% of the population.
There were 47,807 households, out of which 35.20% had children under the age of 18 living with them, 56.70% were married couples living together, 8.00% had a female householder with no husband present, and 32.40% were non-families. 25.80% of all households were made up of individuals, and 7.60% had someone living alone who was 65 years of age or older. The average household size was 2.53 and the average family size was 3.09.
The county population contained 27.00% under the age of 18, 8.50% from 18 to 24, 32.20% from 25 to 44, 21.60% from 45 to 64, and 10.80% who were 65 years of age or older. The median age was 35 years. For every 100 females, there were 96.60 males. For every 100 females age 18 and over, there were 93.60 males.
The median income for a household in the county was $51,316, and the median income for a family was $61,610. Males had a median income of $40,196 versus $29,994 for females. The per capita income for the county was $24,939. About 3.80% of families and 6.40% of the population were below the poverty line, including 6.70% of those under age 18 and 9.50% of those age 65 or over.
Politics
Olmsted has historically been a Republican-leaning county, but rapid population growth in Rochester has made it more competitive in recent years. In 2020, Joe Biden won it by nearly 11 points, the best performance of any Democratic presidential nominee since Lyndon Johnson in 1964.
Although it has trended Democratic at the presidential level, Olmsted County continues to lean Republican in state and local races, with split ticket voting becoming more common. Two of the county's three seats in the Minnesota Senate are held by Republicans, as are two of the five seats in the Minnesota House of Representatives. Since 1970, Olmsted County has voted for the DFL nominee for governor thrice: in 1974, 2018, and 2022. In 2018, then-Representative Tim Walz benefitted from high recognition in the district with a reputation at the time as a moderate. Republican nominee Doug Wardlow concurrently won the greatest number of votes in Olmsted County in the 2018 Minnesota Attorney General election.
This page is based on this Wikipedia article Text is available under the CC BY-SA 4.0 license; additional terms may apply. Images, videos and audio are available under their respective licenses.